Precision Measurement of Energy and Position Resolutions of the BTeV Electromagnetic Calorimeter Prototype
Abstract
The energy dependence of the energy and position resolutions of the electromagnetic calorimeter prototype made of lead tungstate crystals produced in Bogoroditsk (Russia) and Shanghai (China) is presented. These measurements were carried out at the Protvino accelerator using a 1 to 45 GeV electron beam. The crystals were coupled to photomultiplier tubes. The dependence of energy and position resolutions on different factors as well as the measured electromagnetic shower lateral profile are presented.
, , , , , , , , , , , , , , , , , , , , , , , , , , , , ††thanks: corresponding author, email: semenov@mx.ihep.su , , , ††thanks: deceased , , , , , ,
1 Introduction
BTeV is a dedicated experiment at the Tevatron proton-antiproton collider at Fermilab that will study and quark decays [1]. A thorough investigation of B decays requires the ability to study decay modes containing single photons, ’s, and ’s. Total absorption shower counters made of scintillating crystals have been known for decades for their superb energy and spatial resolutions. The crystals act as both the shower development medium and light producer. Lead tungstate (PbWO4) crystals are distinguished with their high density, short radiation length and small Moliere radius. The CMS and ALICE experiments at the CERN LHC have chosen these crystals for their Electromagnetic calorimeters [2],[3]. An electromagnetic calorimeter made of PbWO4 crystals has also been selected as the baseline for the BTeV experiment. Unlike CMS or ALICE BTeV ECAL is not in a high magnetic field, so we can use photomultiplier tubes rather than avalanche photodiodes or vacuum phototriodes. This should provide less noise and better resolution at low energies. According to the PbWO4 manufacturers specifications the expected light collection is 5000 photoelectrons at 1 GeV.
The performance of lead tungstate crystals produced in Bogoroditsk Techno-Chemical Plant (BTCP) and Shanghai Institute of Ceramics (SIC) has been studied at the accelerator U70 in Protvino, Russia in 2001. The specific goals were to understand how to set specifications for crystal production and measure the predicted energy and position resolution.
2 Testbeam Facility
The BTeV ECAL testbeam setup consisted of a array of PbWO4 crystals coupled to ten-stage photomultiplier tubes, a beam with a momentum tagging system on individual particles and a trigger system using scintillation counters (see Fig. 1). The crystals had a square cross-section of 2727 mm2 and were 220 mm long and wrapped with 170m Tyvec.

PbWO4 light yield strongly depends on temperature [2],[5]. To eliminate the effects of temperature variation crystals were placed inside a thermally insulated light-tight box. We controlled the temperature in the box using a LAUDA cryothermostat with an accuracy of ∘C. To measure the temperature of the crystals, 24 separate temperature sensors were placed on the front and rear ends of various crystals.
A moving platform was used to inject the beam on different points of the crystal matrix. The platform was designed to move in the both vertical and horizontal directions and was controlled remotely. The box was placed on a revolving table mounted on the platform. Rotation of the table was important for studying an angular resolution and optical transmission of the crystals.
In order to measure the energy resolution we need to take into account the electron beam energy spread which was 2-3% at high energies up to 45 GeV and was 5-7% at low energies down to 1 GeV. These values are significantly larger than expected performance of the crystals. Thus we constructed a system that measured the momentum of each electron in the beam [7]. It consisted of four drift chamber stations and an analyzing magnet. Three stations had X and Y chamber pairs, and the fourth one had only an X chamber pair. Each chamber covered an area about cm2. A gas mixture of 70% Ar and 30% isobutane was used. The position resolution of the chambers was 160 m. An electron momentum was measured with a resolution of 0.13% at 45 GeV where the multiple scattering was negligible. At 1 GeV the resolution of 2% was caused mainly by multiple scattering of electrons on materials along the beam line (the flanges of the vacuum tubes and drift chambers, 0.006 of radiation length in total.)
The positions of the beam telescope scintillating counters S1, S2, S3 and S4 are shown in Fig. 1. Counters sizes were 10 cm in diameter for S1, S2 and S3 and cm for S4. The coincidence of the signals from these counters formed the main beam trigger. The finger counters Fx and Fy with sizes 5 mm were used mainly in calibration and precise energy resolution measurements to limit the beam size.
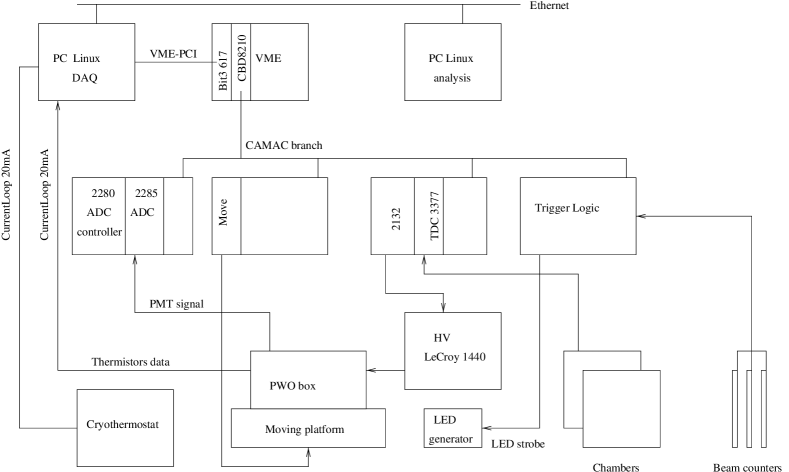
Data acquisition (DAQ) was CAMAC-based and PC-controlled using VME (see Fig. 2). The DAQ system consisted of
-
•
CAMAC crate with an ADC system for crystals readout,
-
•
TDC modules measuring the timing of drift chambers signals, and
-
•
trigger logic.
A CES CBD8210 CAMAC branch driver VME board was used as an interface to the CAMAC crates. It also provided interrupts to control DAQ program flow. The DAQ programs ran in a PC under Linux operating system. A Bit3 PCI-VME interface was used to communicate with the VME crate. The Fermilab software tool HistoScope was used both as run-control frame and for a simple on-line analysis of the data. Data also were sent to another computer for more detailed analysis and archiving. This was implemented by pipe and TCP/IP socket system calls. The slow control subsystem included
-
•
high voltage control and monitoring by LeCroy 1440 HV power supply,
-
•
temperature control of the crystal’s box using the LAUDA cryothermostat,
-
•
monitoring of temperatures in the crystal matrix by a set of thermistors,
-
•
monitoring of the phototubes gains via pulsed LED,
-
•
the moving platform control elements.
Light from each crystal was viewed by a PMT through an optical grease coupling. We used R5800 Hamamatsu phototubes equipped with transistorized bases developed at Fermilab. High voltage to the tubes was supplied by a LeCroy 1440 HV system. Signals were sent to the control room patch-panel without any connection to ground inside the crystal box to avoid ground loops. LeCroy 2285 15-bits integrating ADC modules were used to measure the signal charge within 150 ns gate, chosen to be somewhat longer than the natural decay time of the crystals, where we expect 99% of the light in 100 ns. The ADC sensitivity could be programmed with a power controller module. During most of our studies we used 30 fC per count.
Signals from drift chamber sense wires were sent to amplifier-discriminator cards that were installed on the chambers. We used UPD16 cards produced by the IHEP Electronics department with a threshold. The output from the UPD16 was a balanced ECL signal with an 80 ns width. The output signal went to a TDC input using a 60-meter twisted-pair cable and started the TDC conversion operation. The conversion was stopped by a delayed trigger. The delay was chosen to have all start–stop time values in the 1 ms timeout window. With a 10-bit TDC scale, the precision is 1 ns per count.
3 Monitoring System
One of the problems in high precision measurements is the long-term stability of measuring devices. Placing the crystal matrix together with photomultipliers into a thermoinsulated box we have reduced already the influence of the temperature, which is the most important instability factor. But we still had some electronics outside the box. Besides, some other factors (such as photomultiplier gain dependence on mean anode current) might cause drift in the output signal. To monitor and take into account possible drift, a LED pulser system was implemented. A generator fired the super-bright blue LED with 470 nm wavelength, that provided light to 50 fibers. Each fiber was fed to one (crystal+PMT+ADC) channel of the setup. To monitor the stability of the LED pulser we used 2 PIN-diodes HAMAMTSU S6468-05 as well as a dedicated PMT with calibrated light from a light source with YAP:Ce crystal [6]. The LED pulses had the height 2–3 times less and the width similar to those of the scintillation light produced in the PbWO4 crystal by 27 GeV electron. The LED was triggered by the DAQ system 10 times during each of the intervals between accelerator spills. This provided enough statistics to accurately monitor the stability every few minutes. We had checked the stability of the LED pulser relative to the YAP:Ce calibrated light and found it was better 0.1% during at least 15 hours.
4 Crystal Light Response Uniformity
GEANT simulations show that an adequate light response uniformity along the length of the crystal is a key to achieve excellent energy resolution (see Fig. 8). The non-uniformity of the light yield (LY) along the crystal length contributes to the constant term of the relative energy resolution.
To measure the LY uniformity, the crystal matrix was rotated by 90∘ around the vertical axis and crystals were scanned using a muon beam in 1 cm steps. The position of the muon track going through the crystal was reconstructed using the drift chambers. Pulse-height distribution collected for each of the 1 cm intervals along the crystal lengths were fitted with a modified Landau distribution to obtain a peak position.
The peak position of the energy loss distribution for minimum ionizing particle as a function of the distance to the PMT is shown in Fig. 3. The PMT position is at cm. The data were fitted in the region of the expected shower maximum (3 to 10 X0) to a straight line in order to determine the slope of the LY uniformity. The LY values were normalized to the value of LY at cm.

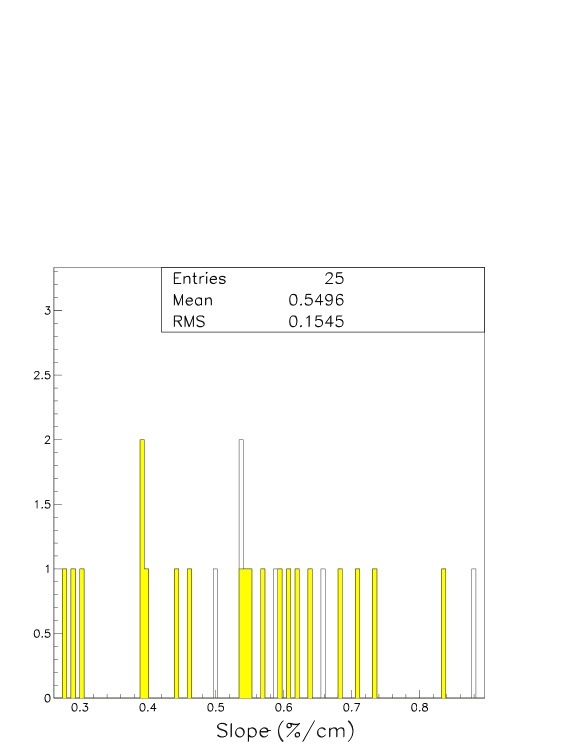
A distribution of the slopes of the LY uniformity was obtained for the groups of 25 crystals each from Bogoroditsk and Shanghai. The results are shown in Fig. 4. No difference between the Bogoroditsk and the Shanghai crystals was observed.
5 Energy Resolution and Comparison With GEANT Simulations
Using the test beam setup described above the energy resolution of the electromagnetic calorimeter prototype ( matrix) were measured. The electron beam was directed to the center of the matrix. To disentangle various contributions to the energy and position resolution six electron beam energies of 1, 2, 5, 10, 27, and 45 GeV were used.
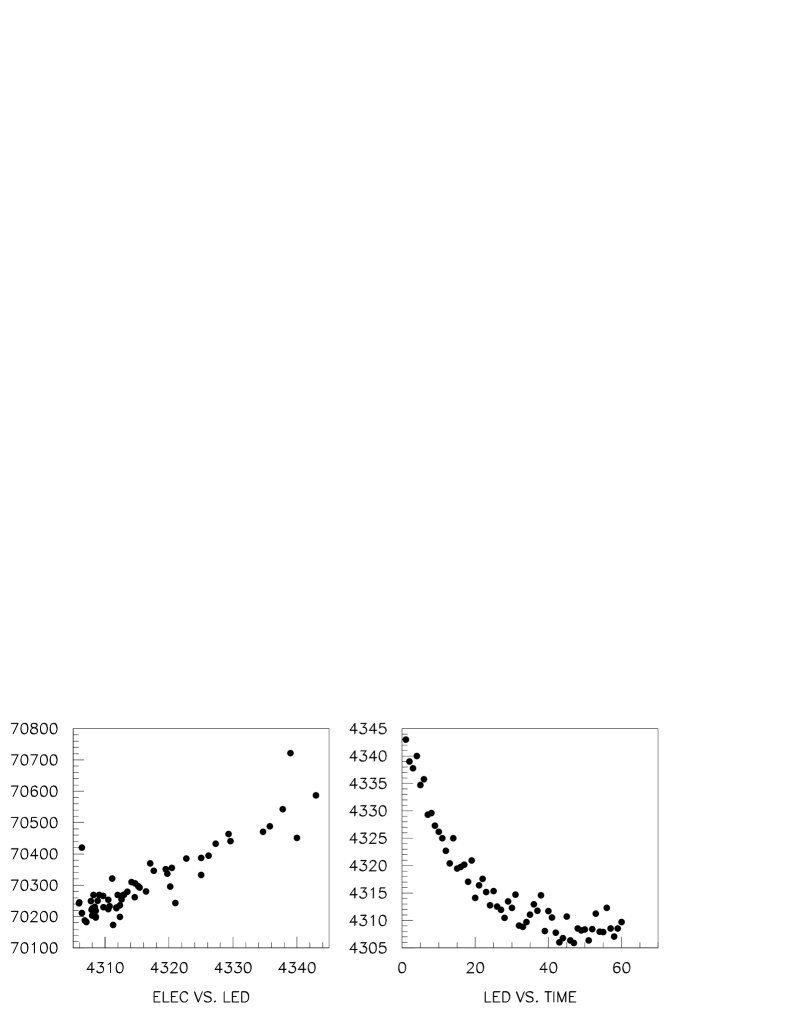
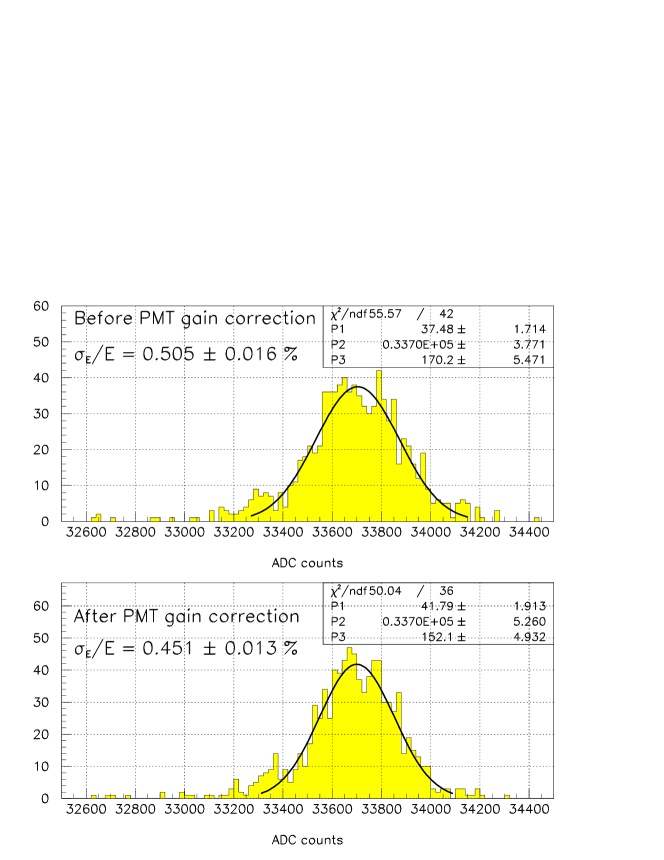
To measure a good energy resolution of the calorimeter prototype we had to take into account a photomultiplier gain instability. Variations of the PMT gain were caused by the changes of the electron beam intensity. To monitor PMT gain we used LED pulser monitor system described above. Monitor system data were used to correct PMT gain. Fig. 5 (right), shows the average pulse heights from LED pulser signals as a function of time. The left plot in Fig. 5 shows a linear correlation between the average LED signal and electron beam pulse height. The energy resolution before and after the PMT gain correction with the use of the LED data is presented in Fig. 6. All results below were obtained with PMT gain correction.
The energy resolution as a function of is shown in Fig. 7.

The energy resolution is described well using a function
| (1) |
where is in GeV, a represents a constant term arising from calibration errors, shower leakage, mostly from the back of the crystals, and non-uniformity in the light collection efficiency along the length of the crystals. The stochastic term, %, arises from photon statistics and leakage of shower, mainly in the transverse directions outside the 55 crystal array. The last term %, sometimes called a noise term, usually arises from noise of the photon detection electronics, which was negligible in our case. Instead, the momentum measurement resolution arising from multiple scattering of the electrons in the beam line is estimated to contribute 2.2% to this term and is, in fact, consistent with what we observe.
The measured constant term is %. Our Monte Carlo studies show that the shower fluctuation and non-uniformity contribute 0.23% and 0.27%, respectively. The measured longitudinal non-uniformities were used as inputs in this Monte Carlo study. Adding these contributions in quadrature we estimate the constant term to be 0.35%, which is consistent with what we measure.
The same Monte Carlo studies show that shower fluctuation results in 0.72% contribution to b. To estimate the other major contributions in the b term we need to know the photo-electron yield. The vendors of the crystals BTCP (Bogoroditsk Techno-Chemical Plant), Russia and SIC (Shanghai Institute of Ceramics), China measured this number to be about 10 pe/MeV using Cs137 and Co60 gamma sources and 2” PMT’s with bialkali photo cathode, covering the entire crystal end. Since the PMT’s used in the beam test have sensitive areas of () mm diameter attached to the crystal ends measuring 27 mm square, the covered area is only ()%. This implies that photo-electron yield in our beam test studies is 5 pe/MeV, and its contribution in the b term is ()%. Combining these two contributions as well as an additional small contribution from the LY non-uniformity to the b term, we expect the stochastic term to be ()%, which is consistent with the measured value of ()%. We did not see big difference in energy resolution for crystals produced in Bogoroditsk and Shanghai.

Curve I includes the effects of shower fluctuation and leakages for our particular crystal size. The light yield non-uniformity along the crystal contribution is added on curve II. Photon statistics is included into the calculations in curve III. Dots in the Fig. 8 represent the experimental data which had have the effects of multiple scattering of the beam electrons and tagging system resolution removed.
We studied the dependence of the energy resolution on the angle of electron incidence on the crystals. No changes were observed up to a few degrees. In the 55 crystal array it began to deteriorate at angles greater than 5∘ (see Fig. 9). The effect is more-or-less constant over the energy range we studied.
6 Temperature Dependence of the Crystal Light Output
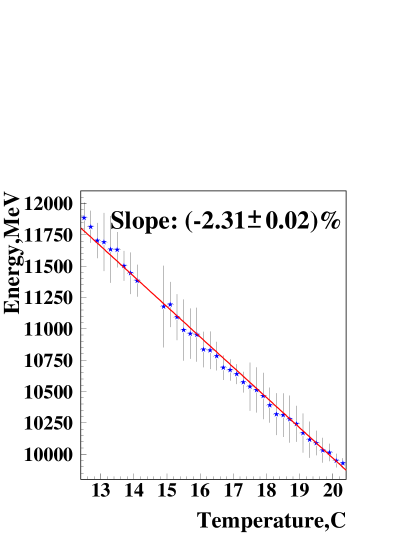
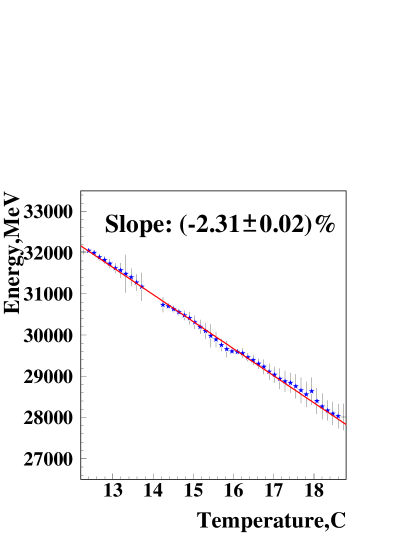
We made an independent measurement of a temperature variation effect on the PbWO4 crystal light output. The temperature dependence measurements were made at electron energies of 10 and 27 GeV. The rate of the temperature change was about 1 ∘C/hour during both the warm up and the cool down periods. The temperature inside the box was measured using our 24 thermistors array, averaging the values. The temperature was measured once per spill (approximately 0.1 Hz). The slope of the change in the vicinity of 18 ∘C was found to be about -2% per ∘C, in agreement with previous measurements. Fig. 10 shows our measurements with 10 and 27 GeV electrons.
 |
 |
7 Electromagnetic Shower Lateral Profile
We have measured the transverse electromagnetic shower profile and also its dependence on energy. We use only events with an electron hitting the central crystal of the array for the further analysis to avoid shower leakage outside matrix.
In this analysis, the crystals were divided into virtual squares of 1 mm2. During the accumulation of the data for shower profiles three two-dimensional arrays 135135 were used, where the two dimensions stood for x and y coordinates perpendicular to the beam. Each cell of the arrays corresponded to the 1 mm2 of the crystal matrix. Each of the arrays contained number of events, the energy sum, and the sum of the energy squared correspondingly. For any selected event only 25 cells in each of these arrays were used for accumulation. Coordinates of each cell to be filled were determined by the distances x and y of the center of each out of 25 crystals in the matrix relative to the electron coordinates determined by the drift chambers.
After the accumulation of the data was done, the arrays were modified. Considering a symmetry of the shower profile in the both projections, only 1/8 of the full arrays are left. Thus we mapped the information from the cells symmetrical relative to the center of the 55 matrix. Finally three “triangular” tables (the 55 crystal matrix viewed from the center of the matrix appears as a triangle with 68 cells along the two equal sides, that is along 2.5 crystals with a step of 1 mm) were determined. The first one contained the number of events accumulated for each cell, the second one contained an average energy deposit in particular cell, and the third one contained the r.m.s. () of this average energy deposit. Each final table had 2346 elements. These tables were accumulated for the energies 1, 2, 5, 10, 27, and 45 GeV. The energy sharing information is important for developing an algorithm of a reconstruction of two gamma-quanta from two strongly overlapped showers at different energies.
A typical electromagnetic shower profile, for 45 GeV electrons, is presented in Fig. 11. It defines an average energy deposit, normalized on the total energy deposit in the 55 crystal array, in the crystal with a distance between its center and an electron -coordinate. The electron -coordinate here is within 1 mm slice of the crystal center.

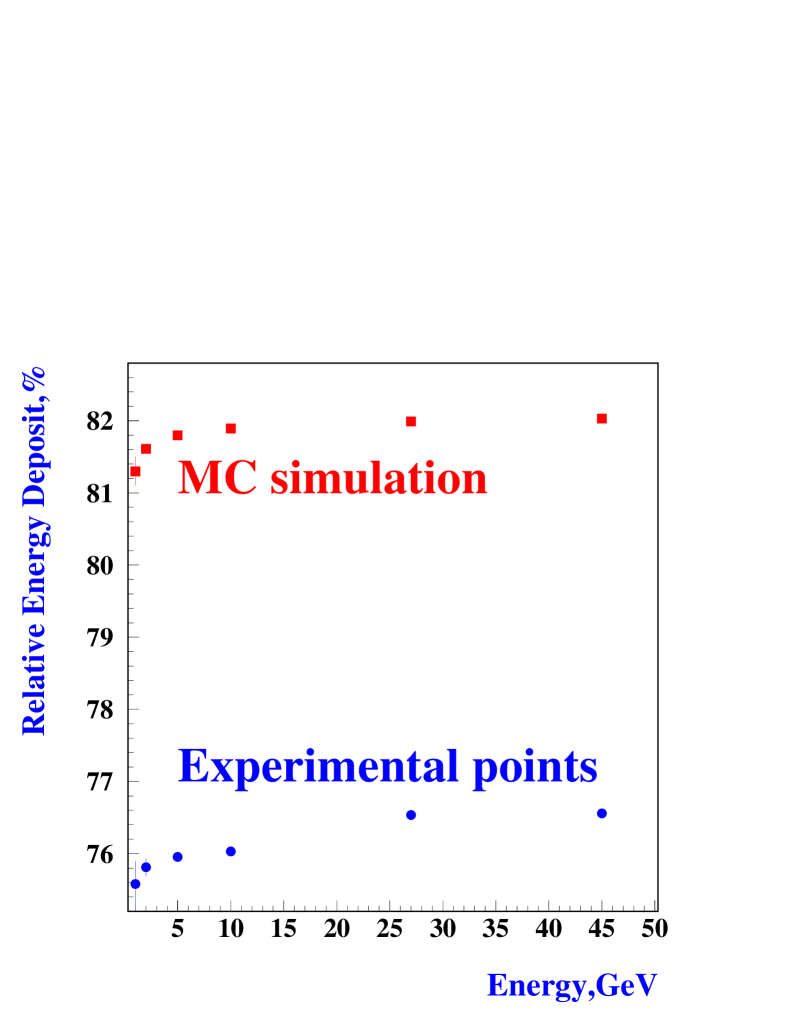
We found that the lateral shower profile changes very slightly in the energy range 1–45 GeV. When an electron hits the square of 44 mm2 in the center of middle crystal of the calorimeter prototype, about 76% of the full energy is deposited in this crystal. The dependence of the energy deposit on energy is presented in Fig. 12.
In Table 1 the relative energy deposit (in %) in the six crystals when an electron hits the square of 44 mm2 in the center of the matrix is presented. These six counters reproduce the triangle matrix obtained as described above when each cell of the arrays corresponds to a crystal. The upper lines of the numbers stand for an average over 1 and 2 GeV, while the bottom lines show values for 45 GeV. We see that while the energy changes by about a factor of 30, the shower profiles changes by only 1% in the center and at most 10% at the edges.
| center | center+1 | center+2 | |
|---|---|---|---|
| center, 1-2 GeV | 75.7 | ||
| 45 GeV | 76.6 | ||
| center+1, 1-2 GeV | 3.92 | 1.180 | |
| 45 GeV | 3.83 | 1.137 | |
| center+2, 1-2 GeV | 0.402 | 0.250 | 0.076 |
| 45GeV | 0.375 | 0.226 | 0.069 |
The test beam results on the electromagnetic shower lateral profile have been compared with the GEANT 3.21 simulation results with tracing cuts of 500 KeV for electrons/positrons and 60 KeV for photons. The GEANT 4 simulation with the same tracing cuts and with the much lower 1 KeV production and tracing cuts gives very similar results. The GEANT simulation indicates that the simulated shower transverse profile does not change with the incoming energy. About 82% of the energy collected over matrix is predicted by GEANT to be in the central crystal, but our measurements show only about 76-77%. GEANT does better when considering the fraction of the energy contained in the sub-array; GEANT predicts 97%, while the measurement is 96%. It is also interesting that the shower profile simulated with GEANT is a bit narrower in comparison to the experimental result. One of the possible explanations may be Cherenkov’s effect light contribution.
8 Position Resolution and Comparison With GEANT Simulations
The position resolution of the calorimeter prototype was also obtained using the test beam data. We used the center-of-gravity technique to define the measured coordinate in the crystal matrix and the drift chambers to define the true coordinate of the particle hitting the crystals. This method requires the knowledge of the energy and the angle of incidence of the particle in order to choose the right correction curve (so called, the S-curve) which will be used to correct the measured position. The measured position is defined as follows:
| (2) |
where is the energy deposited in the i-th crystal and is the position of its center, relative to (0,0) for the central crystal, and refers to the number of crystals in the sum. While for the energy resolution it is better to take , for the spatial resolution n prefers to be taken as 9 due to the influence of large energy fluctuations in the tails of an electromagnetic shower on the spatial resolution. The measured position versus the true position for 27 Gev electrons for normal incidence is presented in Fig. 13 (S-curve). The weighted sum (2) biases the measurement towards the center of the crystal as can been seen in this figure. For normal incidence the correction S-curve is almost independent of energy, most likely due to the fact that the Moliere radius has a negligible energy dependence.

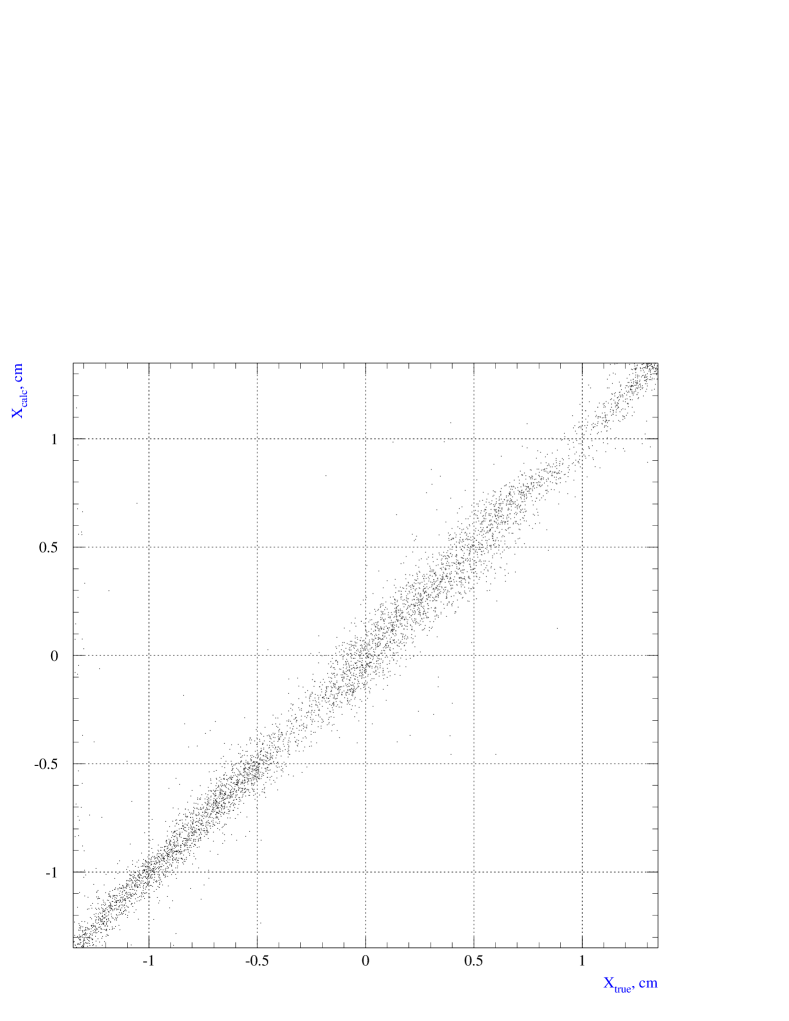
The S-curve fit function was used to obtain a calculated coordinate. The dependence of the calculated coordinate in the PbWO4 matrix on the true coordinate defined by the drift chambers for 27 GeV electrons is presented in Fig. 14. The width of the line in Fig. 14 gives the calorimeter prototype position resolution.
The resolution, averaged over electrons spread across the entire central crystal was calculated for several beam energies. The results are shown in Fig. 15. We obtained the following dependence of resolution on energy
| (3) |
(E in units of GeV and in mm). This agrees well with the resolution expected from Monte Carlo simulation, which is
| (4) |


The spatial resolution strongly depends on the position of an electron hitting the matrix relative to the center of a crystal, as shown in Fig. 16. We see that the spatial resolution is better by almost a factor of three the edge of the crystal relative to the center. As shown in Figure 16, experimental resolution in the center of the crystall is better than MC simulation, since GEANT simulated shower is a bit narrower than measured.
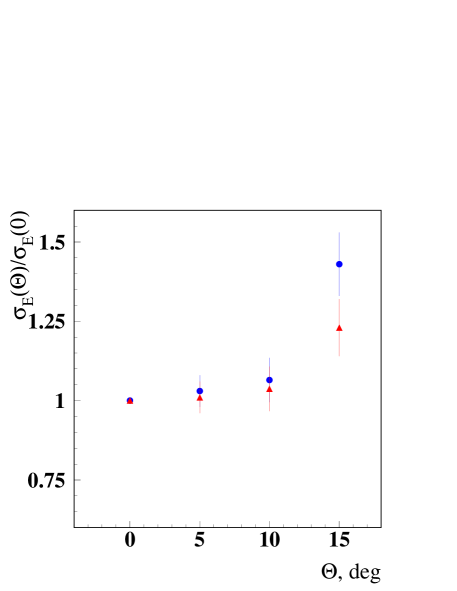
In order to study the dependence of position resolution on the angle at which an electron hits the calorimeter prototype, the crystal matrix was turned by 5, 10 and 15 degrees relative to normal. Data were taken at 10 and 27 GeV for each angle. At each angle the S-curve was determined and fitted. The dependence of position resolution on angle relative to the one at zero degree incidence for 10 GeV and 27 GeV electrons is given in Fig. 17. We see that position resolution at 15 degrees is worse than at zero degree by a factor of 1.5 at 10 GeV and 2.5 at 27 GeV. The curves in the figure are results of fits by the function:
| (5) |
where is a position resolution at angle , is a position resolution at zero degree, – fit parameter. When the matrix is turned at some angle, the additional contribution in position resolution comes from longitudinal fluctuations of the electromagnetic shower maximum. The geometrical factor of this effect is proportional to .

9 Conclusion
The measurements of energy and position resolutions of Our electromagnetic calorimeter prototype made of lead tungstate crystals for the BTeV experiment at Fermilab have been carried out at the IHEP test beam facility at the Protvino 70 GeV accelerator. The crystals were produced in Bogoroditsk (Russia) and Shanghai (China) and were assembled in 5x5 arrays.
Studies were made in the electron beam energy range from 1 to 45 GeV. The energy tagged beam has allowed us to measure the stochastic term in energy resolution as (1.80.1)%. We have not seen significant difference in energy resolution of the Bogoroditsk and Shanghai crystals. The non-uniformity of light yield along the crystal has been measured with the use of the muon beam when the crystal matrix was rotated by 90 degrees with respect to the beam direction. Taking into account this effect as well as photostatistics has resulted in good agreement between the measured energy resolutions and the GEANT Monte Carlo simulations.
The stochastic term in the dependence of position resolution on energy in our measurements is about 2.8 mm which is in agreement with Monte Carlo simulations. For 27 GeV electrons position resolution is 750 m in the center of the crystal, and is 250 m at a boundary between two crystals.
The dependence of energy resolution on the angle at which particle hits the crystals relative to the normal has been measured. Energy resolution does not deteriorate until the angle is about 5∘. But there is significant dependence of position resolution on the angle. The position resolution at 15∘ is worse than at 0∘ by a factor of 1.5 at 10 GeV and 2.5 times for 27 GeV. Projective geometry rather than planar geometry has been chosen for the BTeV calorimeter.
The electromagnetic shower lateral profile changes very slightly in the energy range 1–45 GeV. When an electron hits the center of the calorimeter prototype made of a PbWO4 with the size mm3, about 76% of the full energy is deposited in the central crystal. Shower shape tables were measured for six energies within 1–45 GeV region. It will be important for developing an algorithm of a reconstruction of two gamma-quanta from two overlapped showers at different energies. The shower profile simulated with GEANT is a bit narrower in comparison to the experimental result.
The temperature dependence of a crystal light output was measured to be -2.3%/∘C (at 18 ∘C) for two electron beam energies, 10 and 27 GeV.
10 Acknowledgments
We would like to thank the IHEP management for providing us a beam line and accelerator time for our test beam studies. Special thanks to Fermilab for providing equipment for data acquisition.The authors would like to thank O.A. Grachov and I.V. Kotov for useful discussions. This work was partially supported by the U.S. National Science Foundation and the Department of Energy.
References
- [1] A. Kulyavtsev et al., “Proposal for an Experiment to Measure Mixing, CP Violation and Rare Decays in Charm and Beauty Particle Decays at the Fermilab Collider - BTeV,” May 2000; G. Y. Drobychev et al., “Update to Proposal for an Experiment to Measure Mixing, CP Violation and Rare Decays in Charm and Beauty Particle Decays at the Fermilab Collider - BTeV,” March 2002. See http://www-btev.fnal.gov/public/hep/general/proposal/index.shtml .
- [2] CMS, The Electromagnetic Calorimeter Project Technical Design Report, CERN/LHCC 97-33, CMS TDR 4 (1997).
- [3] ALICE, Technical Design Report of the Photon Spectrometer (PHOS), CERN/LHCC 99-4, ALICE TDR 2 (1999).
- [4] GEANT, Detector Description and Simulation Tool, Computing and Networks Division, CERN
- [5] O.V.Buyanov et al., A first electromagnetic calorimeter prototype of PbWO4 crystals. NIM, A349, 62–69,1994.
- [6] V.A.Kachanov et al., Light source for energy stabilization of calorimeter detectors based on photodetectors. NIM, A314, 215–218, 1992.
- [7] V.A.Batarin et al., Development of a Momentum Determined Electron Beam in the 1-45 GeV Range, e-Print ArXiv hep-ex/0208012; Preprint IHEP 2002-29, Protvino, 2002.