Identification problems of muon and electron events in the Super-Kamiokande detector
Abstract
In the measurement of atmospheric and fluxes, the calculations of the Super Kamiokande group for the distinction between muon-like and electron-like events observed in the water Čerenkov detector have initially assumed a mis-identification probability of less than 1 % and later 2 % for the sub-GeV range. In the multi-GeV range, they compared only the observed behaviors of ring patterns of muon and electron events, and claimed a 3 % mis-identification. However, the expressions and the calculation method do not include the fluctuation properties due to the stochastic nature of the processes which determine the expected number of photoelectrons (p.e.) produced by muons and electrons. Our full Monte Carlo (MC) simulations including the fluctuations of photoelectron production show that the total mis-identification rate for electrons and muons should be larger than or equal to 20 % for sub-GeV region. Even in the multi-GeV region we expect a mis-identification rate of several % based on our MC simulations taking into account the ring patterns. The mis-identified events are mostly of muonic origin.
Comparing the intensities per kiloton-year between the 33 kiloton-year (the first half of the total exposure of 79.3 kty) and 46.3 kton-year (the latter half) exposures, moreover, the respective values for -like event numbers, -like event numbers and the ratio for (-like number)/(-like number) are not consistent within the given statistical uncertainties in the sub-GeV and multi-GeV regions for the two subsamples. It should be also remarked that results for the whole zenith angle distributions of e-like and of -like events in the sub-GeV ranges and those of -like and -like(FC) events in the multi-GeV ranges are inconsistent for the 33 kton-year and 46.3 kton-year exposures. We also studied the significance probability of the results after subdividing the whole zenith angle distribution into upward () and downward () going events. Their significance probabilities also support our claim that the method used by the Super K. group is inadequate for the identification of muons and electrons.
pacs:
95.55.Vj,96.40.Tv1 Introduction
The most recent Super Kamiokande (Super K.) results for the study of atmospheric neutrinos and the neutrino anomaly before the large accident of the detector have been presented for the 79.3 kiloton-year (kty) exposure by Kajita and Totsuka [1] and at the 27th International Cosmic Ray Conference, Hamburg, August 2001 [2]. Using their reports, we have compared the respective intensities/kty as shown in Table 1 for the sub-GeV results (visible energy, <1330 MeV) and for the multi-GeV results ( >1330 MeV). These results are subdivided into exposures of 25.5 kty(analysis A) and 25.8 kty(analysis B) [3, 4], also 33.0 kty [5, 6, 7] and 46.3 () kty [1, 2], as given in the published papers and reports.
Table 1 shows a comparison of various event samples for -like event numbers, -like event numbers, (-like+-like) numbers and the ratio for (-like number)/(-like number) in the sub-GeV and multi-GeV regions [8]. The actual event numbers are shown in the second and the fourth column. Disagreements between the related two exposures are indicated by respective identifier marks. Earlier data for the sub-GeV region collected during the period from May 1996 to October 1997 have been analysed independently by group A for the exposure of 25.5 kty and group B for the exposure of 25.8 kty, respectively [3]. The comparisons are shown in the upper part in table 1. Both the event rates per kty for -like number, (-like number + -like number) and the ratio for (-like number)/(-like number) appear to be in conflict above the respective statistical uncertainties. Therefore, our main purpose for the present considerations is to compare those event rates for both exposures. The systematic uncertainties depend on the different kty values, but they are smaller than the statistical ones.
In both A and B groups, the event rates for -like event numbers marked by and for (-like + -like) event numbers marked by in the sub-GeV range do not agree. Also, the ratios for (-like)/(-like) events marked by are inconsistent in spite of the fact that the same data sample is analysed. However, the Super K. group finally has considered only the result of analysis A disregarding analysis B which has given larger number of -like events than analysis A.
| Sub-GeV | 25.5 kty (Analysis A) | 25.8 kty (Analysis B) | ||||||||||||
| -like number | 983 | 38. | 6 | 1. | 2 | /kty | 967 | 37. | 5 | 1. | 2 | /kty | ||
| -like number | 900 | 35. | 3 | 1. | 2 | /kty | 1041 | 40. | 4 | 1. | 3 | /kty | ||
| -like+-like | 1883 | 73. | 84 | 1. | 70 | /kty | 2008 | 78. | 75 | 1. | 76 | /kty | ||
| (-like)/(-like) | 1. | 09 | 0. | 05 | 0. | 93 | 0. | 04 | ||||||
| Sub-GeV | 33.0 kty (-98) | 46.3 kty (=79.3-33.0 kty) | ||||||||||||
| -like number | 1231 | 37. | 30 | 1. | 06 | /kty | 1633 | 35. | 27 | 0. | 87 | /kty | ||
| -like number | 1158 | 35. | 09 | 1. | 03 | /kty | 1328 | 35. | 21 | 0. | 87 | /kty | ||
| -like+-like | 2389 | 72. | 39 | 1. | 48 | /kty | 3263 | 70. | 48 | 1. | 23 | /kty | ||
| (-like)/(-like) | 1. | 06 | 0. | 04 | 1. | 00 | 0. | 04 | ||||||
| Multi-GeV | 33.0 kty (-98) | 46.3 kty (=79.3-33.0 kty) | ||||||||||||
| -like number | 290 | 8. | 8 | 0. | 5 | /kty | 334 | 7. | 2 | 0. | 4 | /kty | ||
| -like(FC) number | 230 | 7. | 0 | 0. | 5 | /kty | 328 | 7. | 1 | 0. | 4 | /kty | ||
| -like+-like(FC) | 520 | 15. | 8 | 0. | 7 | /kty | 662 | 14. | 3 | 0. | 6 | /kty | ||
| (-like)/(-like) | 1. | 26 | 0. | 11 | 1. | 02 | 0. | 08 | ||||||
| -like(PC) number | 301 | 9. | 1 | 0. | 5 | /kty | 453 | 9. | 8 | 0. | 5 | /kty | ||
Various observed intensity values of the 33.0 kty exposure (including the data in 25.5 kty run [3]) are compared to those of the 46.3 kty [1] in the central part of Table 1. The former is the first half in the total 79.3 kty exposure and the other is the latter half of the 79.3 kty exposure. The -like intensities marked with are not quite consistent with each other within the respective statistical uncertainties.
Similar comparisons are given for the multi-GeV region. The -like ”fully contained (FC) events” relate to all of the visible energy being contained in the inner detector and ”partially contained (PC)” refers to events with some of the visible energy in the outer detector. For the identification procedure in the multi-GeV region, the Super K. group utilizes the characteristic Čerenkov ring pattern of muons and electrons. A -like event produces a clear outer ring edge of Čerenkov light while an electron-like event creates a fuzzy ring pattern due to the production of cascade showers and multiple scattering of low-energy electrons [1]. The comparison between the 33.0 kty and 46.3 kty cases are given in the lower part of Table 1. The intensities of -like events marked with appear to exhibit a large difference (of the order of %) comparable to the sub-GeV case. Accordingly both intensities for (-like events + -like events) and also the ratio (-like intesity)/(-like intesity), marked with and respectively, are different beyond their statistical uncertainties. However, intensities for -like (FC) and (PC) events for both exposures are consistent within the respective uncertainties.
2 Study of the identification capability of the Super K. detector
The only experimental test of the identification capability was carried out by part of the Super K. group using the 12-GeV proton synchrotron at KEK, Japan [9]. For the test, they used a 1000 ton water Čerenkov detector. The water tank was cylindrical (about 10 m in height and 10 m in diameter) and its inner detector had a cylindrical volume of 9.6 m in diameter and 9.3 m in height. It was equipped with 380 photomultiplier tubes (PMTs with 50-cm dia.). On the other hand the Super Kamiokande detector [3] has a cylindrical volume, 39 m in diameter and 42 m in height, containing about 50 000 metric tons of water. The fiducial volume of 32 000 metric tons is cylindrical of 33.8 m in diameter and 36.2m in height. It is equipped with 11 146 50-cm PMTs (1773 PMTs each on the upper and lower surfaces and 7600 PMTs on the sides) which cover 40 % of the inner surface. It is therefore conceivable that the large scale differences between the two detectors may lead a larger mis-identifications for the full Super K. detector than the one that was obtained for the 1000 ton exposures. In addition, the experimental data from the test set-up are of low statistics and limited only to sub-GeV events. There are no results for multi-GeV events because of the smallness of the 1000 ton detector.
The Super K. group has performed a Monte Carlo (MC) calculation to establish a relation, , between the average number of photoelectrons (p.e.), the electron momentum , and the angle of incidence . The angle was between the particle direction and the center of circular area of 50 cm diameter. In the framework of this simulation it was assumed that the electron with a given momentum was started from a vertex at the center of sphere of 16.9 m radius. The relation is based only on the average number of p.e., neglecting the fluctuations around its average. By using this relation the expected p.e. number produced by the electron in the -th PMT on the inner surface of the cylindrical volume was calculated with the following expression
This expression was given as equation (6.7) in Kasuga’s PhD paper [10]. In this expression, the exponent of 1.5 for (16.9 m/) should have been 2.0. Also a p.e. number distribution for muons is given in a similar expression (6.8), which is
The explanation for the denominator in the second case is incorrect in Figure 6.6 of Kasuga [10] and Figure 2.14 of Sakai [11], afterwards being corrected by Ishihara in Figure 5.7 [12]. Also they define the probability function suitable for the Particle Identification (P.I.), given by
with = + (0.1 . The first term with the factor 1.2 in comes from the actual PMT charge resolution and the second factor takes into account the gain uncertainty in the PMT. The likelihood functions for -like events and for -like events shown in their expression (6.12) are obtained with the probability for studying the identification capability of the events, and , with an opening angle of 1.5 from the reconstructed particle direction. By adding information of the Čerenkov opening angles combined with the information of the ring pattern, the used method is improved with a PID (Particle Identification) parameter as given in their expression (6.16) to obtain a reduced mis-identification probability. Using the Monte Carlo simulation by applying these expressions to the experimental data obtained at the 12-GeV proton synchrotron, the group concluded [10, 13] that they were able to identify electrons and muons with mis-identification probabilities of less than a few % in the momentum range 250-1000 MeV/. In the similar study in Sakai’s PhD paper [11], however, the mis-identifications for are given as several % and for as a few % as shown in Table 7.1 and Table 7.2 in his paper using the same expression with the exponent 2.0, without considering stochastic processes of cascade showers. The Super K. group does not apply the identification method for multi-GeV region. They argue that muons in multi-GeV range can produce very large p.e. numbers compared to electrons of the same momentum, even increasing for larger momenta. Therefore, the identification procedure applied for the sub-GeV range is unnecessary for multi-GeV events according to their estimates.
3 Our full MC simulation
The Super Kamiokande collaboration has determined the relations relevant for the mis-identification probabilities ( or ) by only using the average number of photoelectrons. Of course, it is natural to expect that there are many events where the observed number of p.e. fluctuates around the average number. These fluctuations are not only caused by Poisson distributions, but also by the stochastic processes in the electromagnetic interactions of electrons and muons. Moreover, it is also an oversimplification to use only ionization and knock-on electron production for the expected p.e. numbers in the muon expression (equation (6.8) in the paper) [10]. However, in order to describe correctly the behaviors of fluctuations, additional energy-loss processes, like direct electron pair production and bremsstrahlung cannot be neglected. In the cylindrical fiducial volume, also, different path lengths of Čerenkov light due to different vertex positions and incident angles contribute to the fluctuations of the p.e. numbers. Therefore we simulated 100 events each with different vertex positions and determined the average p.e. number, while the p.e. number obtained by the Kasuga expression (6.8) depends only on the distance between between the -th PM and the vertex. To clearly demonstrate the effect we show the total photoelectron numbers for muons and electrons in the sub-GeV and multi-GeV ranges in their dependence on various vertex positions (different z-values) at x = y = 0 cm and for vertical incidence in figure 1 and 2.


In view of such a complicated situation, we have performed a full MC simulation including all kinds of fluctuations using the EGS code for the Super Kamiokande detector. The EGS simulation can be initiated for electrons or photons which originate from a muon. As far as all other necessary quantities (water transparency, vertex position resolution and angular resolution etc.) are concerned, we follow the procedure used by the Super K. group. The step size of track lengths in our Monte Carlo is taken as 0.028 radiation lengths for electron events. Also we use the probability function defined by Kasuga [10] and determine the likelihood functions. As an appropriate coordinate system, we consider the x- and y-axes to be in a horizontal plane and the z-axis to extend perpendicularly downward. So the upper circular surface is at z= 0 cm and the lower one at z= 3400 cm. The non-linear behaviour in both figures reflect effects of vertex positions (corresponding to different z values), by which some tracks of events escape from the fiducial volume.


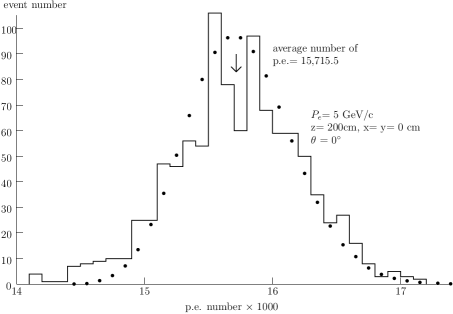


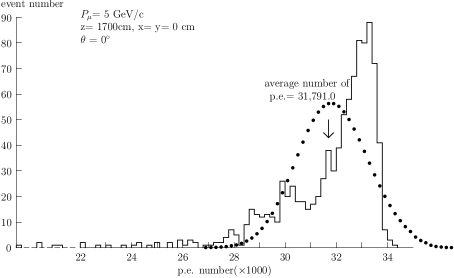
As a reference, figures 3 and 4 show the fluctuation pattern of electrons and of muons of 300 MeV/ for the vertex position of z= 200 cm and obtained with 1000 MC events. The average p.e. number for electrons with 300 MeV/ is larger than that of muons with the same momentum, but the situation is reversed at 5 GeV/. The full black points in the respective figures show the Poisson distribution calculated for each average p.e. number where the track started at the respective vertex position. Figures 5 and 6 give the results for the same momentum at a different vertex point (z = 1700 cm). Figures 7 and 8 are for 5 GeV/ at z = 200 cm and figures 9 and 10 for 5 GeV/ at z = 1700 cm. In these figures we have shown only events for the minimum momentum value in sub-GeV range and the maximum momentum value in multi-GeV range. These results show that electrons of 300 MeV/ started at z = 200 cm and 1700 cm show comparatively larger deviations from the Poisson distributions than those of muons under the same condition. On the other hand muons of 5 GeV/ at both given z-values exhibit larger fluctuations than electrons. Also, for the inclined incidence directions similar fluctuations occur with even stronger deviations compared to the vertical case. Accordingly, the fully simulated MC results clearly prove that the fluctuations owing to the stochastic processes can produce a serious impact on the identification problems of muon and electron events not only in the sub-GeV region but also in the multi-GeV region through their effect on the ring patterns.
3.1 Our distributions
We inspected the distributions for electron and muon events with various momenta in the sub-GeV range and also some in the multi-GeV range for various starting positions (z-values), keeping x = y = 0. Then, the momenta of electrons and muons were selected such as to produce almost the same p.e. numbers. The mis-identification rates between both event types are obtained from their estimated results as obtained from the distributions. For this purpose 500 muon and electron events each were used. As shown in table 2, the corresponding mis-identification probabilities are summarized and identified by various symbols. The mis-identification rates for muons (% values) as explained below the table are defined in the following way: [(muon numbers misidentified as electrons) (electron numbers misidentified as muons)]/(original number of muons). The mis-identification rates appear to be larger than the ones given in Kasuga’s paper. From the results shown in the table, one might consider it difficult to reliably distinguish electron from muon events in particular in the sub GeV region, although the situation is improving with increasing momentum. However, these mis-identification rates are only valid for the case of x = y = 0.
| z(cm) | |||||
| 200 | |||||
| 700 | |||||
| 1200 | |||||
| 1700 | |||||
| 2200 | |||||
| 2700 | |||||
| 3000 | |||||
| z(cm) | |||||
| 200 | |||||
| 700 | |||||
| 1200 | |||||
| 1700 | |||||
| 2200 | |||||
| 2700 | |||||
| 3000 | |||||
| the resultant mis-identification rate for muons; | |||||
| : %, : %, : %, : %, : % | |||||
| : means – distribution with the opposite signs. | |||||
As an example, we show in figure 11 the distributions of for 300 MeV/ electrons and for 500 MeV/ muons (the events with the chosen momenta will radiate almost similar p.e. numbers on average) for z = 2700 cm. In some cases it is difficult to distinguish betweem the two event types. Figure 12 gives the same quantity for 2000 MeV/ electrons and for 2000 MeV/ muons at z = 1200 cm which allows to distinguish between the two event types. But, this is only true for vertical incidence keeping x = y = 0. One should notice that the distribution for muons is much wider than that for electrons. This aspect is very likely caused by stronger fluctuations due to stochastic interaction processes of muons rather than fluctuations due to the shower development of electrons. As seen in table 2, the distributions of electrons and muons would lead to a mis-identification of few % for muons in the region of z = 200 cm 2200 cm typically in the multi-GeV region. However, these results are only true for events started at the given vertex position of x = y = 0 and for vertical incidence. For z >2200 cm, mis-identification rates of several % for muons are obtained, and it has to be kept in mind that some muons could escape through the bottom surface of the detector. Moreover, such muons with oblique incidences can generate distributions differently shaped compared to those for vertical incidence.


3.2 Our results with PID parameter
Following Kasuga’s method of Particle Identification (PID) using the pattern and opening angle of the Čerenkov ring, furthermore, we calculated the PID parameter values. For the sub-GeV region, we obtained the % values for muon deficits in table 3 using a number of 9240 for electrons and 14 910 for muons starting at vertex points from z = 200 cm to 3000 cm with their incidence direction along the z-axes (x = 0 cm, and y = 0 cm, 50 cm, 100 cm, 250 cm, 500 cm and 750 cm). The event numbers are taken from the intensities of the and energy spectra [15]. Then, according to our simulation, 4312 electrons and 6958 muons are estimated to stop up to z = 1400 cm. means the electron is misidentified as a muon, and the opposite. The table shows substantial shifts from muons to electrons.
| Sub-GeV | z=200 | z=200 | z=200 | z=200 | ||||
|---|---|---|---|---|---|---|---|---|
| region | 1400 cm | 3000 cm | 1400 cm | 3000 cm | ||||
| 1) x=0, y=0 cm | 2) x=0, y=50 cm | |||||||
| event number | 4312 | 6958 | 9240 | 14 910 | 4312 | 6958 | 9240 | 14 910 |
| , | 1 | 641 | 143 | 1202 | 78 | 3153 | 611 | 4154 |
| increase | +14.8 % | % | +11.5 % | % | +71.3 % | % | +38.3 % | % |
| 3) x=0, y=100 cm | 4) x=0, y=250 cm | |||||||
| event number | 4312 | 6958 | 9240 | 14 910 | 4312 | 6958 | 9240 | 14 910 |
| , | 75 | 3334 | 672 | 4411 | 98 | 3479 | 798 | 4615 |
| increase | +75.6 % | % | +40.5 % | % | +78.4 % | % | +41.4 % | % |
| 5) x=0, y=500 cm | 6) x=0, y=750 cm | |||||||
| event number | 4312 | 6958 | 9240 | 14 910 | 4312 | 6958 | 9240 | 14 910 |
| , | 140 | 3541 | 846 | 3924 | 106 | 3485 | 688 | 4735 |
| increase | +78.9 % | % | +33.0 % | % | +78.4 % | % | +43.8 % | % |
| 7) x=0, y=1000 cm | 8) x=y=0 cm, | |||||||
| event number | 4312 | 6958 | 9240 | 14910 | 4312 | 6958 | 9240 | 14 910 |
| , | 25 | 3307 | 596 | 4570 | 6 | 3995 | 211 | 5694 |
| increase | +76.1 % | % | +43.0 % | % | +92.5 % | % | +59.3 % | % |
| 9) x=y=0 cm, | 10) x=y=0 cm, | |||||||
| event number | 4312 | 6958 | 9240 | 14 910 | 4312 | 6958 | 9240 | 14 910 |
| , | 3 | 4197 | 173 | 6421 | 1 | 4226 | 142 | 6877 |
| increase | +97.3 % | % | +67.6 % | % | +98.0 % | % | +72.9 % | % |
For instance, in case of both events starting at z = 200 3000 cm and at x = y = 0 with = , the percentage of misidentified muons is % = and % = for electrons. From these values, we obtain (number of muons misidentified as electrons) (number of electrons misidentified as muons) a deficit of 7.1 % of muons and an 11.5 % increase of electrons, i.e. the interactions of muon neutrinos would be systematically misinterpreted as those of electron neutrinos. For reference, some results for inclined incidence (, and ) at vertex positions of x = y = 0 cm are added. Integrating numerically these values for muon deficits considering the number of neutrinos as given by the () energy spectrum, we obtain a total mis-identification between electron and muon events for starting positions at z = 200 3000 cm to be at least 20 % for the sub-GeV region.
| Multi-GeV | z=200 | z=200 | z=200 | z=200 | ||||
|---|---|---|---|---|---|---|---|---|
| region | 1400 cm | 2900 cm | 1400 cm | 2900 cm | ||||
| 1) x=0, y=0 cm | 2) x=0, y=100 cm | |||||||
| event number | 949 | 1190 | 1897 | 2378 | 949 | 1190 | 1897 | 2378 |
| , | 5 | 18 | 95 | 167 | 23 | 37 | 88 | 188 |
| increase | +1.4 % | % | +3.8 % | % | +1.5 % | % | +5.3 % | % |
| 3) x=0, y=250 cm | 4) x=0, y=500 cm | |||||||
| event number | 949 | 1190 | 1897 | 2378 | 949 | 1190 | 1897 | 2378 |
| , | 4 | 41 | 81 | 73 | 14 | 57 | 88 | 236 |
| increase | +3.9 % | % | % | +3.0 % | +4.5 % | % | +7.8 % | % |
| 5) x=0, y=750 cm | 6) x=y=0 cm, | |||||||
| event number | 949 | 1190 | 1897 | 2378 | 949 | 1190 | 1897 | 2378 |
| , | 18 | 118 | 102 | 309 | 7 | 13 | 84 | 58 |
| increase | +10.5 % | % | +10.9 % | % | +0.6 % | % | % | +1.1 % |
| 7) x=y=0 cm, | 8) x=y=0 cm, | |||||||
| event number | 949 | 1190 | 1897 | 2378 | 949 | 1190 | 1897 | 2378 |
| , | 31 | 14 | 148 | 38 | 5 | 41 | 81 | 73 |
| increase | +1.8 % | % | % | +4.6 % | +3.8 % | % | % | +0.3 % |
In the multi-GeV region, we used 1897 Monte Carlo events for electrons and 2380 MC events for muons as predicted by the respective neutrino fluxes. Similar PID parameters were calculated with vertex positions of z = 200 cm to 1400 cm and of z = 200 cm to 2900 cm. Some of the muons started at z 1400 cm would escape from the fiducial volume. Table 4 again indicates the deficits of muons similar as in the sub-GeV region. This leads us, thus, to conclude that even in the multi-GeV region the analysis procedure used by the Super Kamiokande group shifts about more than several % of muons into the electron category.
For checking with the ring patterns, we inspected 300 events each randomly selected from 1897 electron events and 2380 muon events starting at vertex positions from z = 200 cm to 1400 cm for vertical incidence along the z-axis (x = 0 cm, and y = 0 cm, 100 cm, 250 cm, 500 cm and 750 cm). This resulted in a number of cases where it was difficult to distinguish muon from electron events which corresponded to 5 % and 11 %, respectively, in each 300 event sample.
4 Comparisons of the zenith angle distributions in the sub-GeV and multi-GeV ranges
Subdivided into the 33 kty (the first half) and 46.3 kty (the last half) expressions from the total 79.3 kty exposure, we compare both the observed zenith angle distributions for the sub-GeV and multi-GeV ranges using -tests [18]. All the numbers of events can be read off the Super K. papers. Although the Super K. group uses 10 bins for the observed zenith angle distribution of the complete 79.3 kty exposure [19], the 10 bins are only available for the 79.3 kty exposure for the sub-GeV and multi-GeV ranges. Therefore, we can not inspect the distributions of 33 kty and 46.3 kty exposures with 10 bins. Accordingly, we subdivided the whole observed zenith angle distributions separately into 5 bins for the respective distributions of 33 kty and 46.3 kty exposures. In table 5, their zenith angle distributions of various events are represented with 5 bins for . Further, for comparing both the upward-directed and downward-directed events among them, we subdivided the data into 3 bins each for and . The region of being near the horizontal direction was included for both distributions.
| zenith angle | sub-GeV -like | sub-GeV -like | multi-GeV -like | ||||||
| 33 kty | 46.3 kty | 33 kty | 46.3 kty | 33 kty | 46.3 kty | ||||
| . | 0 | . | 6 | 288 | 349 | 183 | 291 | 50 | 41 |
| . | 6 | . | 2 | 233 | 344 | 226 | 273 | 55 | 73 |
| . | 2 | 0. | 2 | 258 | 306 | 229 | 304 | 70 | 95 |
| 0. | 2 | 0. | 6 | 226 | 304 | 265 | 352 | 75 | 64 |
| 0. | 6 | 1. | 0 | 226 | 330 | 255 | 410 | 40 | 60 |
| (whole)/ | 7.97/5 | s.p.=0.17 | 8.34/5 | s.p.=0.15 | 13.92/5 | s.p=0.017 | |||
| (upward)/ | 7.52/3 | s.p.=0.068 | 4.90/3 | s.p.=0.18 | 5.78/3 | s.p=0.13 | |||
| (downward)/ | 4.29/3 | s.p.=0.24 | 3.84/3 | s.p.=0.28 | 8.18/3 | s.p=0.044 | |||
| zenith angle | multi-GeV FC | multi-GeV PC | multi-GeV (FC+PC) | ||||||
| . | 0 | . | 6 | 32 | 44 | 32 | 47 | 64 | 91 |
| . | 6 | . | 2 | 31 | 44 | 44 | 68 | 75 | 112 |
| . | 2 | 0. | 2 | 45 | 64 | 91 | 131 | 136 | 195 |
| 0. | 2 | 0. | 6 | 73 | 78 | 68 | 124 | 151 | 202 |
| 0. | 6 | 1. | 0 | 49 | 98 | 66 | 83 | 115 | 181 |
| (whole)/ | 7.11/5 | s.p.=0.21 | 3.93/5 | s.p.=0.56 | 1.36/5 | s.p=0.93 | |||
| (upward)/ | 0.015/3 | s.p.=0.99 | 0.33/3 | s.p.=0.95 | 0.22/3 | s.p=0.97 | |||
| (downward)/ | 7.10/3 | s.p.=0.073 | 3.64/3 | s.p.=0.30 | 1.18/3 | s.p=0.76 | |||
It is generally known that a significance probability (s.p.) of 0.05 in a statistical test indicates consistency for the two data sets. In the present cases, also, s.p. values of little larger than 0.05 may indicate some degrees of mis-identification. In the following we carefully check the variances of the s.p. values of the respective distributions. In table 5, a small s.p. value of 0.068 was seen for the upward directed zenith angle distribution of sub-GeV -like events. Further, in multi-GeV -like events, we found an extremely rare s.p. value = 0.017 for the whole zenith angle distribution. The downward directed events were also described by a s.p.= 0.044 which was smaller than 0.05, and the upward directed one of s.p.= 0.13 was smaller than the other upward directed ones except for the sub-GeV -like events. Although multi-GeV -like (FC + PC) events showed very large s.p. values for all the distributions, the downward-directed FC events could only be characterized by a s.p. value of 0.073. However, all distributions of the PC events show large s.p. values. These varying results might be connected to the identification problem of muons and electrons.
For testing our s.p. values, we used the upward through-going muon flux and the upward-going stopping events in expressed with 10 bins for the former and 5 bins for the latter of the 79.3 kty exposure. Both these events are sure to be muons as they are irrelevant to the identification of muons and electrons. Similar tests were done for both distributions expressed by 5 bins each from the subdivision of the 79.3 kty exposure into the respective 33.0 kty and 46.3 kty exposures. From these data, we obtained s.p. values of 0.66 for 5 bins for the upward through-going muon flux, and a s.p. value of 0.37 for 5 bins in the upward-going stopping events. These s.p. values are not in conflict with being muons. From this we infer that the poor s.p. values shown in table 5 5, for some of the zenith angle distributions of -like and of -like events in the sub-GeV and multi-GeV ranges and also for the downward directed -like (FC) events, may be connected to the poor identification capability for muons and electrons in the 33 kty and 46.3 kty exposures. Thus, we come to the conclusion that these events may show an appreciate mis-identification between muons and electrons.
Accordingly, the comparison of the observed zenith angle distribution of various events with the expected one based on the neutrino oscillation hypothesis is still an open question. In addition, the comparisons of the upward-going muon flux with the null and the neutrino oscillation hypothesis have to face the problem about the absolute value of the neutrino and muon fluxes at ground level for different zenith angles. Namely, very recently, the measurement of atmospheric vertical muon fluxes at ground level in the momentum ranges from 200 MeV/ to 120 GeV/ by the CAPRICE group [19] and from 0.6 to 20 GeV/ by the BESS group [20] were done by using low mass superconducting magnet spectrometers. The former are about 10 % to 15 % lower and the latter about 20 % lower than the previous experimental results. The OKAYAMA group [21] using a solid iron magnet telescope has obtained the vertical muon fluxes from 1.5 to 100 GeV/ which are consistent with both the above measurements. Also, the NMSU-WIZARD/CAPRICE98 [22] balloon-borne magnetic spectrometer reports new measurements at several atmospheric depths in the momentum range 0.3 - 20 GeV/.
5 Conclusion
Based on our MC simulation which includes fluctuations of the produced number of photoelectrons due to the stochastic nature of energy-loss mechanisms, we conclude that the total mis-identification rate for muon and electron events is larger than or equal to 20 % in the sub-GeV region and also at least several % in the multi-GeV region. In both cases the correct treatment of the particle identification would lead to an increase of the muon neutrino flux, namely of 20 % in the sub-GeV range and 5 % in the multi-GeV region. Among others, this mis-identification problem is related to the fact that electrons will always initiate electromagnetic cascades leading to a fuzzy image of the Čerenkov ring pattern. On the other hand muons can occasionally undergo electromagnetic interactions (knock-on production, bremsstrahlung and direct electron pair production). In these cases the muon track overlaps with the shower initiated by the secondaries created by the muon. The emerging pattern can easily be mistaken for an electron.
In addition, our tests showed that the zenith angle distributions observed by Super K. for -like and -like (FC), except -like (PC) events in the first half of the total exposure of 79.3 kty (33.0 kty) and the second half (46.3 kty) are inconsistent both for the sub-GeV and multi-GeV ranges. In special, very different s.p. values between 0.99 and 0.073 for both observed zenith angle distributions of upward-directed and downward-directed -like (FC) events suggest that the downward going events suffer from mis-identifications between muons and electrons. Given these results, we conclude that due to the uncertainty of the identification capability for muon and electron events in the Super K. detector one cannot yet firmly establish the existence of an atmospheric neutrino anomaly. A better knowledge and precision treatment of the particle identification technique including discussions of the absolute intensities for the zenith angle dependent upward going events and the accurate atmospheric neutrino fluxes in general will certainly help to resolve the remaining problems.
References
References
- [1] Kajita T and Totsuka Y 2001 Rev. Mod. Phys.73 85
- [2] Kameda J et al2001 Proc. 27th Int. Cosmic Ray Conf., Hamburg 1057
- [3] Fukuda Y et al1998 Phys. Lett.B 433 9
- [4] Fukuda Y et al1998 Phys. Lett.B 436 33
- [5] Fukuda Y et al1998 Phys. Rev. Lett.81 1562
- [6] Kajita T 1999 Nucl. Phys.B (Proc. Suppl.) 77 123
- [7] Kaneyuki K et al2000 JPS meeting, Niigata 9/23
- [8] Mitsui K et al2001 Proc. 27th Int. Cosmic Ray Conf., Hamburg 1214
- [9] Kasuga S et al1996 Phys. Lett.B 374 238
- [10] Kasuga S 1998 PhD Thesis, Univ. of Tokyo
- [11] Sakai A 1998 PhD Thesis, Univ. of Tokyo
- [12] Ishihara K 1999 PhD Thesis, Univ. of Tokyo
- [13] Kasuga S 1995 Master Thesis. Univ. of Tokyo
- [14] Fukuda Y et al1994 Phys. Lett.B 335 237
- [15] Honda M et al1995 Phys. Rev.D 52 4985
- [16] Fukuda Y et al1999 Phys. Rev. Lett.82 2644
- [17] Fukuda Y et al1999 Phys. Lett.B 467 185
- [18] Press W H et al1992 Numerical Recipes in C: The Art of Scientific Computing second edition, Cambridge Press
- [19] Kremer J et al1999 Phys. Rev. Lett.83 4241
- [20] Motoki M et al2001 Proc. 27th Int. Cosmic Ray Conf., Hamburg 927
- [21] Tsuji S et al2001 Proc. 27th Int. Cosmic Ray Conf., Hamburg 931
- [22] Hansen P et al2001 Proc. 27th Int. Cosmic Ray Conf., Hamburg 921