ATMOSPHERIC AND LONG BASELINE NEUTRINO
Abstract
This paper presents the recent results from Super-Kamiokande atmospheric neutrinos and from K2K accelerator neutrinos. Both results show the signal of neutrino oscillation, and provide new and precise information of oscillation parameters. The oscillation parameters are constraint to be between and for and to be greater than 0.92 for .
1 Introduction
After discovery of neutrino oscillation in atmospheric neutrinos by Super-Kamiokande (SK) [1], much attentions are attracted by this new phenomena. In this paper, the new results from SK atmospheric neutrinos and the new result from K2K accelerator long baseline neutrino experiment are presented. The paper only provides the digest of new results, and does not provide the description of the experiments and the analysis. The description of the experiments is found in references [1, 2] and the description of the analysis is found in NEUTRINO 2002 conference [3].
2 Atmospheric Neutrino
The recent results on atmospheric neutrinos from Super-Kamiokande (SK) experiment are presented in this paper. The observation of atmospheric neutrinos by SK is based on 1,489 live-day exposure. The standard selection criteria and analysis techniques are shown in the reference [1], and are not explained in this paper.
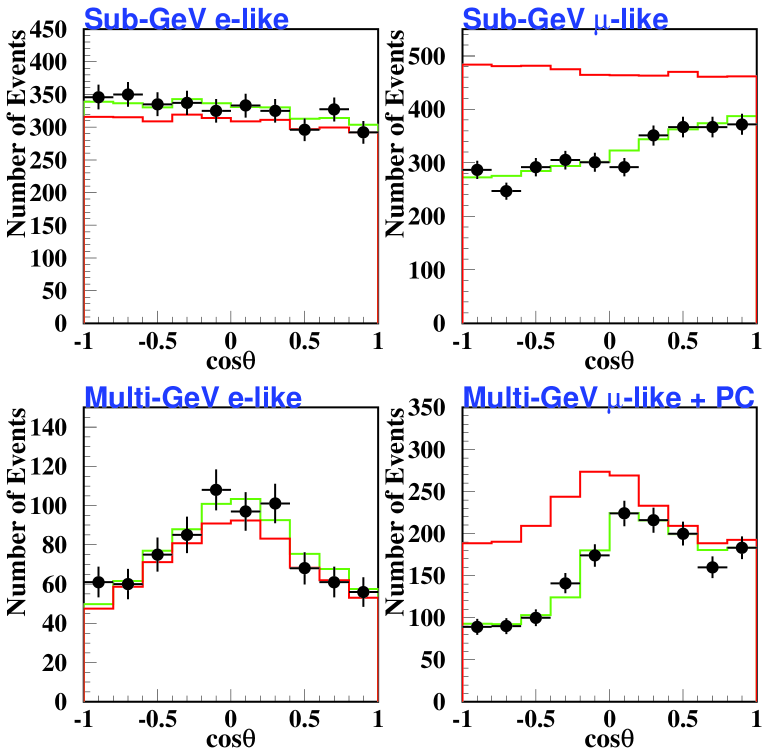
At first, the number of contained events with the vertex inside of the fiducial volume of the detector are shown in Table 1.
| Event category | # DATA | # MC (Honda) |
| Sub-GeV FC 1 ring event | 3266 | 3081.0 |
| Sub-GeV FC 1 ring event | 3181 | 4703.9 |
| Sub-GeV FC multi-ring event | 2457 | 2985.6 |
| Sub-GeV FC Total | 8904 | 10770.5 |
| Multi-GeV FC 1 ring event | 772 | 707.8 |
| Multi-GeV FC 1 ring event | 664 | 968.2 |
| Multi-GeV FC multi-ring event | 1532 | 1903.5 |
| Multi-GeV FC Total | 2968 | 3579.4 |
| PC event | 913 | 1230.0 |
Sub-GeV : Deposited Energy in SK is less than 1.33 GeV.
Multi-GeV : Deposited Energy in SK is larger than 1.33 GeV.
FC : Fully Contained events with both the vertex and the stopping point inside of SK.
PC : Partially Contained events with the vertex inside and the stopping point outside of SK.
ring : The number of “ring” corresponds to the number of observed particles.
The observed number of muon neutrinos are smaller than the Monte Carlo (MC)
prediction. The double ratio of the number of events and the number of
events between data and MC are:
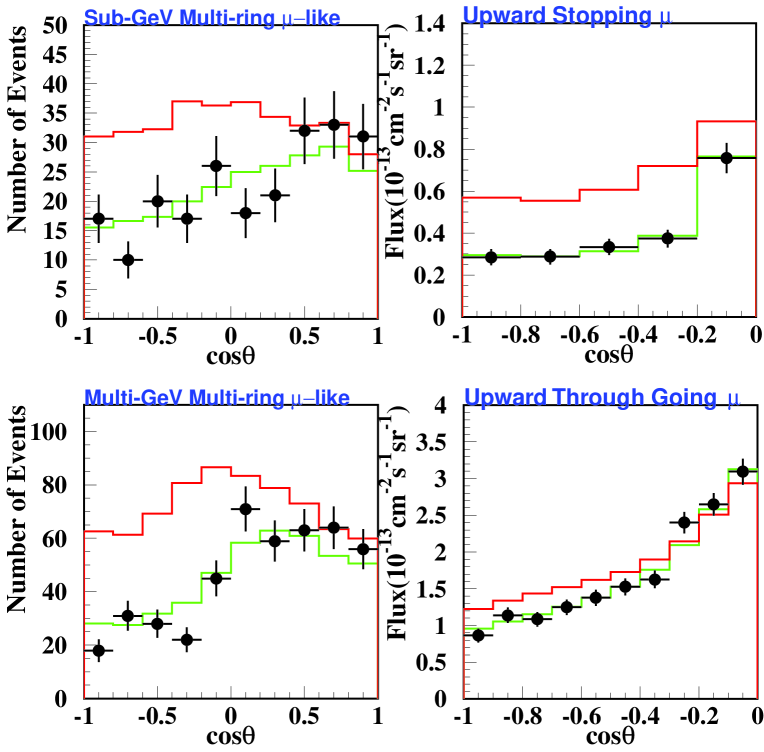
The flux of upward through-going muon originated by higher energy
neutrinos is
with the
expectation of .
The flux of upward stopping muon is
with the
expectation of .
All measurements show the deficit of muon neutrinos.
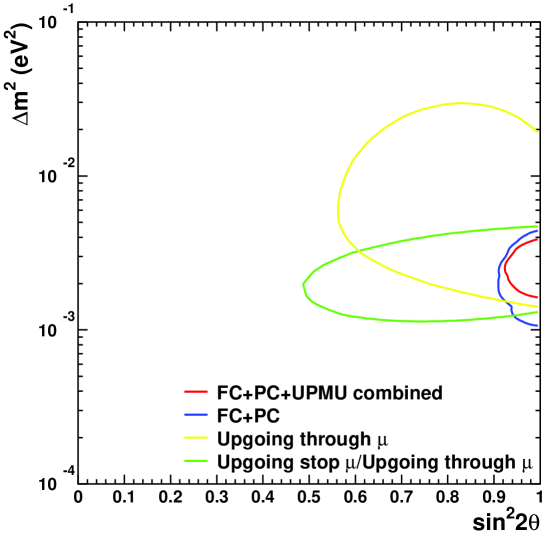
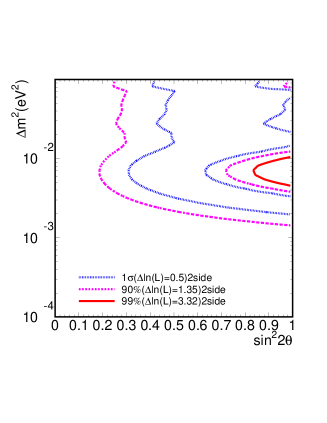
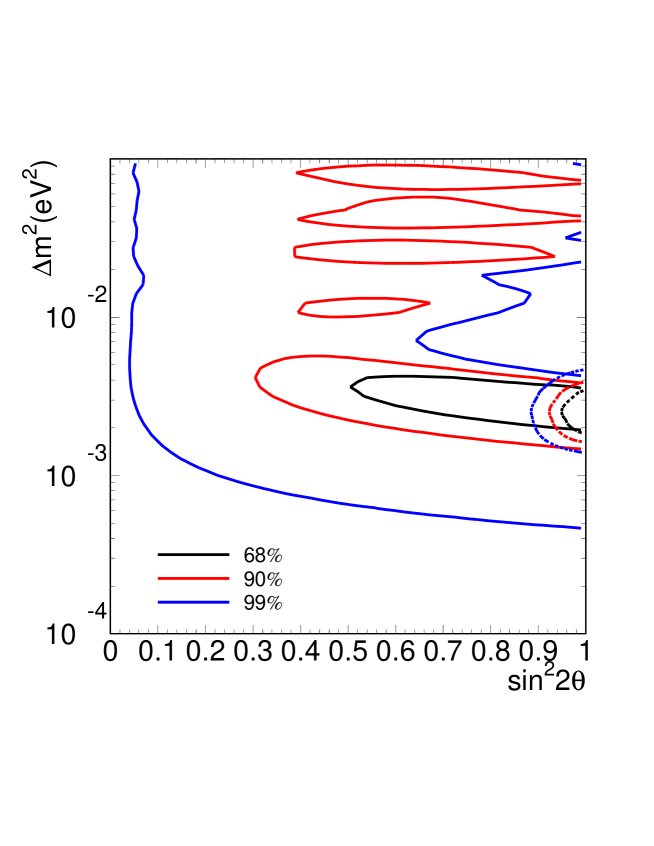
The zenith angle distributions are shown in Figure 1 and 2. The distributions are well explained by neutrino oscillation. The best fit point is and with (: degree of freedom). In the case of no oscillation, the is . Null oscillation scenario is completely ruled out. The contour plot of neutrino oscillation is shown in Figure 3. At 90% C.L., the allowed region of is in the range of , and is greater than 0.92. The SK oscillation analysis is robust to the uncertainty of the atmospheric neutrino flux calculations and the neutrino interaction cross sections.
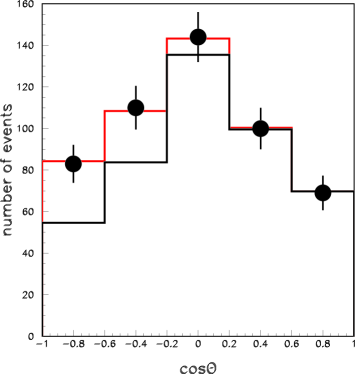
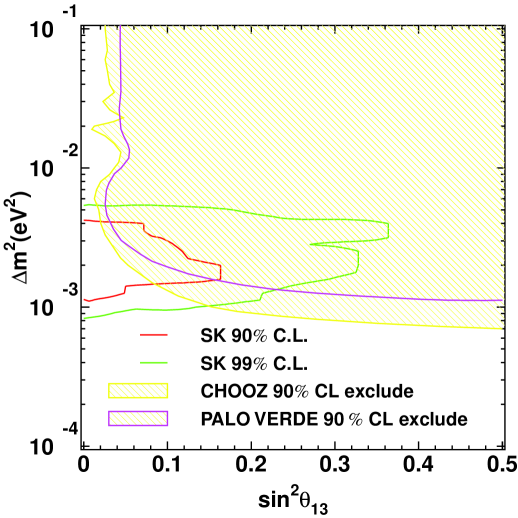
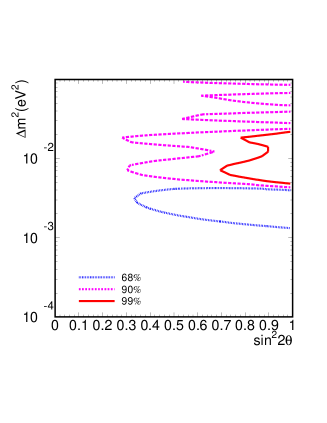
Since most favored channel of neutrino oscillation is , the analysis is performed to enhance the fraction of events in atmospheric neutrino data. The number of neutrino candidates in FC sample is with the MC expectation of 86. The zenith angle distribution of candidate is shown in Figure 4. The distribution is consistent with oscillation. The three flavor oscillation analysis is performed, and limit on from channel. The result shows no oscillation and it is consistent with CHOOZ and PALOVERDE results. The contour plot is shown in Figure 5.
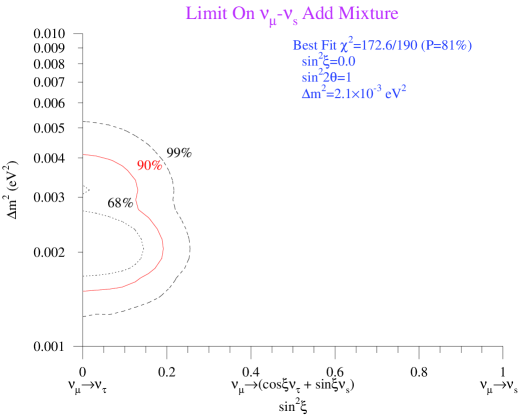
Finally, the hypothesis of oscillation
channel is tested. The fraction of probability
is defined as:
The limit on is at 90% C.L.,
and the result is shown in Figure 6.
3 Long Baseline Neutrino
The recent results from K2K, the first accelerator long-baseline neutrino oscillation experiment from KEK to Kamioka, are presented in this paper. The K2K experiment studies neutrino oscillation discovered by atmospheric neutrinos [1]. The details of K2K experiment is described in reference [2]. The neutrino oscillation probability in two flavors is expressed as . As a signal of neutrino oscillation in K2K, both the reduction and the energy distortion of muon neutrinos at SK are studied. The data set for this analysis is based on protons on the target delivered by KEK 12 GeV Proton Synchrotron.
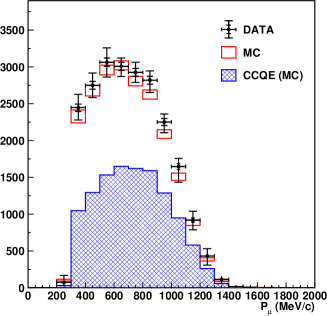
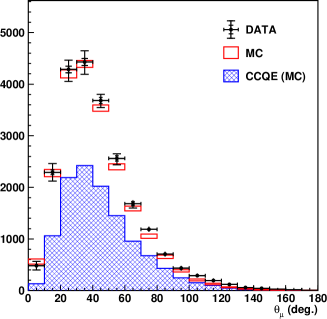
At first, the neutrino flux at KEK is measured by K2K near detectors. The K2K near detectors used for this analysis are 1kt water cherenkov detector (1kt) and the scintillating fiber and water target tracker (SciFi). The muon momentum and the angular distributions measured by 1kt are shown in Figure 7. Single ring events are selected by 1kt for this spectrum measurement.
In this analysis, the knowledge of neutrino interaction is
important since the neutrino energy is reconstructed with an
assumption of charged current quasi-elastic (QE) interaction.
The reconstructed neutrino energy is defined as:
| (1) |
where , , , and are the nucleon mass, muon energy, mass, momentum and scattering angle respectively. We define nonQE interaction as all neutrino interactions excluding the QE interaction. By K2K SciFi detector, the ratio of nonQE interaction to QE interaction is measured as follows. The direction of a proton track is predicted from a muon track with an assumption of QE interaction. We define the angle as the difference between the prediction and the direction of an observed track. The is shown in Figure 8, in which QE events have a peak at one.
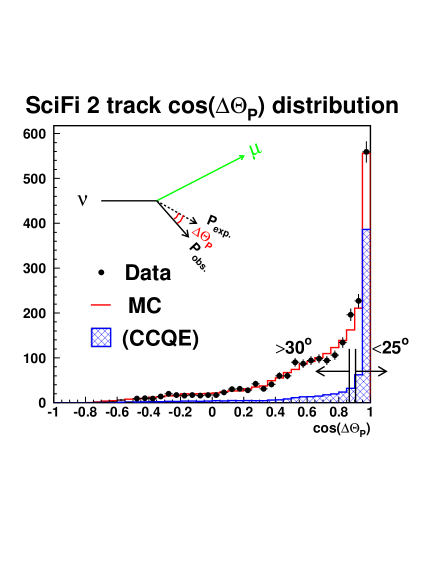
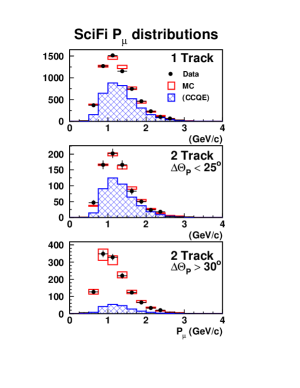
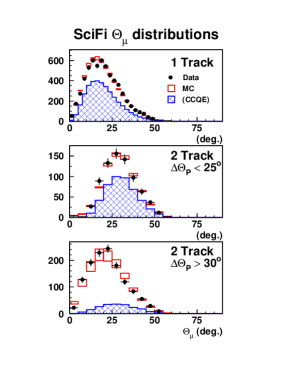
By using , the SciFi muon events are divided into three categories: one is one-track sample, the second is two-track QE-enriched sample with , and the third is two-track nonQE-enriched sample with . The muon momentum and angular distributions of each sample are shown in Figure 9.
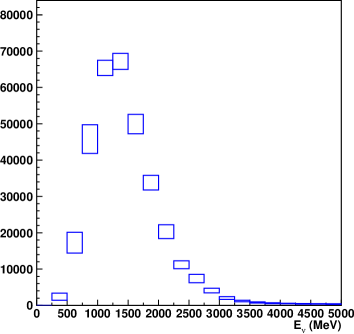
The muon momentum and angular distributions of both 1kt and SciFi are used to measure neutrino energy spectrum at KEK. The measured spectrum is shown in Figure 10. The integrated flux for normalization at SK is measured by 1kt.
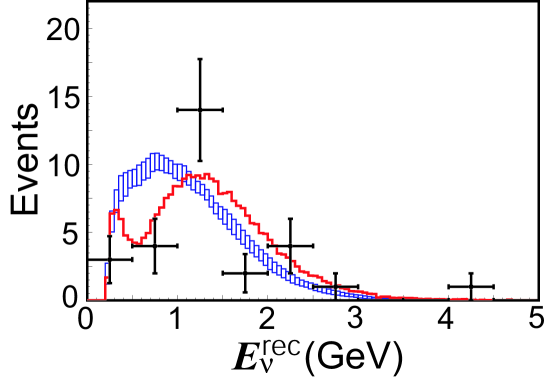
The neutrino energy spectrum at SK is estimated based on the measured spectrum at KEK multiplying the far/near spectrum ratio estimated by the beam Monte Carlo simulation. The description of the far/near ratio is found in the reference [2]. We observe 56 events at SK in the fiducial volume with an estimate of without neutrino oscillation. Twenty-nine single ring muon events in the fiducial volume is used for the spectrum shape analysis. The observed distribution is shown in Figure 11. The MC predictions of both with and without neutrino oscillation are overlaid in Figure 11. The observed distribution is better matched to the expected spectrum with neutrino oscillation. The KS rest probability is 79% for spectrum of oscillation.
The oscillation analysis is performed by the maximum-likelihood method. Both the number of observed events and the distribution is used in this analysis. The likelihood is defined as
| (2) |
The normalization term is the Poisson probability to observe when expected number of events is . The shape term is the product of the probabilities of each one ring (1R) event to be observed at ;
| (3) |
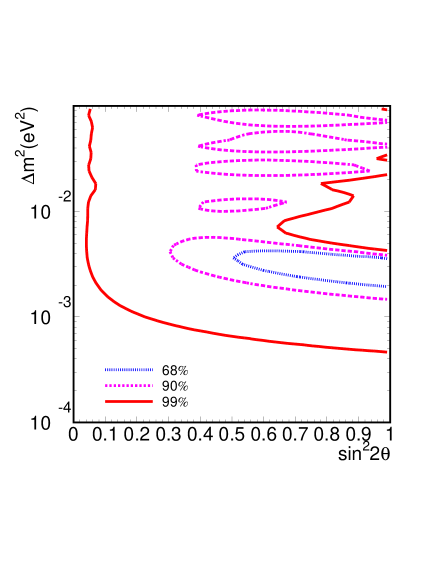
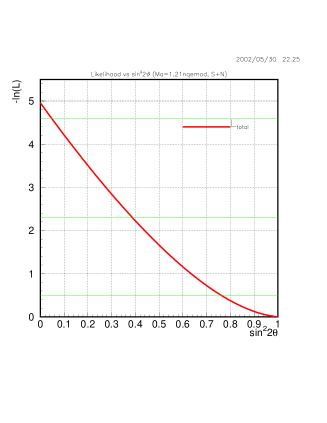
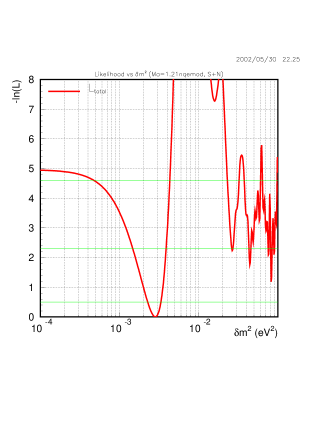
where is the normalized distribution estimated by MC simulation and is the number of 1R events. The is the constraint term by systematic uncertainties. The maximum likelihood fit is used in the analysis of two-flavor oscillation. The allowed region in and plane is shown in Figure 12 for normalization term and shape term separately. Both the reduction and the energy distortion of muon neutrinos indicate the neutrino oscillation with the same oscillation parameters. The best fit point in combined analysis is and . The result is shown in Figure 13. The probability that the measurements at SK were explained by statistical fluctuation without neutrino oscillation is less than 1%. In Figure 13, the allowed region of is between and at 90% C.L. at . The delta log likelihood as a function of and is shown in Figure 14 which indicates the size of errors in this analysis.
4 Summary
Both SK atmospheric neutrino results and K2K accelerator neutrino results provide new information of neutrino oscillation. The two results are shown in Figure 15, and agree well each other with of at 90% C.L.. The neutrino oscillation is firmly established by SK, and confirmed by K2K at level. The SK plans to resume the observation of atmospheric neutrinos around the end of 2002. The K2K plans to collect twice as many data as this by 2004. Both experiments will provide more precise information of neutrino oscillation.
References
- [1] Y. Fukuda et al. (Super-Kamiokande Collaboration), Phys. Rev. Lett. 81, 1562 (1998).
- [2] S.H. Ahn et al. (K2K Collaboration), Phys. Lett. B511, 178 (2001).
- [3] NEUTRINO 2002 Conference in Munich, May 2002, http://neutrino2002.ph.tum.de.