The CDFII Time-Of-Flight Detector and
Impact on Beauty Flavor Tagging
C.Grozisa, R.Kepharta, R.Staneka, D.H.Kimb, M.S.Kimb, Y.Ohb, Y.K.Kimc, G.Vermendic, K.Anikeevd, G.Bauerd, I.K.Furicd, A.Kornd, I.Kravchenkod, M.Mulhearnd, Ch.Pausd, S.Pavlond, K.Sumorokd, C.Chene, M.Jonese, W.Kononenkoe, J.Krolle, G.M.Mayerse, M.Newcomere, R.G.C.Oldemane, D.Usynine, R.Van Berge, G.Bellettinif, C.Cerrif, A.Menzionef, E.Vatagaf, S.Dececcog, D.Depedisg, C.Dionisig, S.Giagug,a, A.DiGirolamog, M.Rescignog, L.Zanellog, S.Cabrerah, J.Fernandezh, G.Gomezh, J.Piedrah, T.Rodrigoh, A.Ruizh, I.Vilah, R.Vilarh, M.Ahni, B.J.Kimi, S.B.Kimi, I.Choj, J.Leej, I.Yuj, H.Kanekok, A.Kazamak, S.Kimk, K.Satok, K.Satok, F.Ukegawak
aFermi National Accelerator Laboratory, USA
bKyungpook NAtional University, Korea
cLawrence Berkeley National Laboratory, USA
dMassachusetts Institute of Technology, USA
eUniversity of Pennsylvania, USA
fINFN, University of Pisa, Italy
gINFN, University of Roma ”La Sapienza”, Italy
hInstituto de Física de Cantabria, Spain
iSeoul National University, Korea
jSungKyunKwan University, Korea
kUniversity of Tsukuba, Japan
The new CDFII detector incorporates a Time-of-Flight detector (TOF), employing plastic scintillator bars and fine-mesh photomultipliers. Since August 2001 the TOF system has been fully instrumented and integrated into the CDFII data acquisition system. With a design goal of resolution the TOF system will provide at least two standard deviations separation between and for momenta , complementing low momentum particle identification by means of the specific ionization energy loss measured in the drift chamber. We describe the design of the TOF detector and discuss the current status of its calibration and initial performances. Finally we review the expected impact of the TOF detector in the flavor tagging of neutral meson.
1 Introduction
Following the successful RunI from 1992 to 1996, the CDF detector has undergone a major upgrade [1] for the RunII which begun in March 2001. The approval for the addition of a Time-of-Flight detector was granted in January 1999. The installation of the TOF detector was completed in August 2001 and its data has been included in the CDFII readout since then.
The primary physics motivation for TOF is to complement and enhance the particle identification capability provided by the central drift chamber (COT) since it distinguishes and in the momentum region of their cross-over in . With an expected time-of-flight resolution of , the TOF system will be capable of identifying charged kaons from pions by their flight time difference with at least two standard deviation separation up to kaon momenta of . Such an addition results in an enhancement of the flavor identification power, crucial to improve the statistical precision in CP violation and mixing measurements.
Particle identification with TOF is performed by measuring the time of arrival of a particle at the scintillator with respect to the collision time . The particle mass can then be determined from the momentum , the path-length , measured by the tracking system, and the time-of-flight measured by the TOF:
| (1) |
Figure 2 shows the time-of-flight difference between , and and the separation power assuming a resolution of . The TOF improves the separation in the momentum region of by or better.
2 The CDFII TOF system
The CDFII TOF detector [2],[3],[4] consists of 216 bars ( long and with a cross section of about ) of Bicron BC-408 scintillator. The bars are installed at a radius of from the beam line in the of radial space available between the cylindrical outer wall of the central drift chamber (COT) and the inner wall of the cryostat of the super-conducting solenoid, covering a pseudo-rapidity region of roughly .
A nineteen-stage fine mesh photomultiplier tube (PMT), Hamamatsu R7761, with a diameter of inches is attached to each bar end, for a total of PMTs in the system. These operate in the solenoidal magnetic field with an average gain reduction of from the nominal gain of . The optical connection between the PMT and the scintillator is provided by a compound parabolic concentrator. The PMT in turn is directly attached to a custom designed HV divider base which also connects to a preamplifier card for the readout.
Differential signal from the anode and the last dynode of the PMT is fed to the preamplifier, and drives, over of shielded twisted pair cable, front-end electronics that reside in a VME crate mounted outside the detector. The front-end signal is split into two: one for timing measurement and the other for pulse height measurement.
The timing path enters a leading edge discriminator with an adjustable threshold, whose output serves as the start signal for the Time-to-Amplitude Conversion (TAC) circuit [5]. The TAC ramp is terminated by a common stop clock edge, that is synchronized with the bunch crossing, and fanned out to all electronics channels with a design jitter less than . The voltage output from the TAC is sampled by a 12-bit ADC, characterized by a least count of roughly over a dynamic range of about . TAC response has shown an excellent stability since the commissioning of the electronics, with a residual variation, after the calibrations, of less than .
The primary purpose for measuring the charge of PMT signals is to perform a correction for the dependence of the discriminator on signal amplitude. The charge measurement is done by a charge sensitive ADC [5]. The current driver is switched on by a gate of adjustable width, and is initiated by the discriminator output, so that only the charge due to the pulse that fired the discriminator is integrated.
3 TOF Calibrations and Initial Performances
The time at which a PMT pulse is registered, measured with respect to the nominal bunch crossing time, can be modeled by the following expression:
| (2) |
where is a constant offset describing the propagation delays in the cables, represents the time at which the interaction occurred, is the time-of-flight of the particle impinging on the bar of scintillator of length , is the effective speed of light in the scintillator, and the last term describes the time-walk effect introduced by the leading edge discriminator. The coordinate is measured along the length of the bar by the tracking chamber, the positive and negative sign of the term proportional to corresponds to a PMT in the west or east end of the detector, respectively. The measurement of the parameters in eq. 2 for each channel is an essential step toward reaching the goal of resolution, and it is performed regularly during periods of data taking.
When a single charged particle enters a bar, the time difference between signals reaching the east and west ends is essentially a linear function of the track entrance point along the bar, . A typical distribution of the time difference plotted as a function of is shown in Figure 2. The effective speed of light in the bar can be derived from the fitted slope. From the distribution of the residuals of this fit a first indication of the timing resolution of each PMT, can be obtained. The resolution averaged over all bars is typically or better. This is larger by approximately a factor two than the resolution of a mean time measurement, indicating that the TOF resolution is not far from our design goals. It is worth notice here that as systematics effects can cancel in the time difference measurement, this estimate represents only an indication of the capabilities of the detector.
Tracks which hit the scintillator at the same position are found to have an ADC response that is well described by a Landau distribution. The width of the Landau peak divided by the peak position is typically for all channels. The dependence of the pulse height on the measured time and the parameterization of the time slewing effect have been studied using a sample where each track passes through two adjacent bars of scintillator. Depending on the path length in each bar, a range of ADC responses is obtained on the two channels at the same end of the bar. At the same time because the track entrance point in each bar is similar, the time difference between the two channels depends mainly on time walk effects. Due to finite attenuation length in the bars () the pulse height depends on the entrance point of the track, . For this reason the slewing correction introduces a linear dependence in the time difference versus , resulting in a biased effective speed of light determination. After the time slewing correction the width of the speed of light distribution for all the PMTs is significantly reduced and observed low-side tail in the distribution disappeared.
3.1 Preliminary Time Resolution Estimate and Particle ID Performances
After all calibrations and corrections were applied, the timing resolution of a given channel can be estimated by comparing the measured TOF for a track with the expected TOF under the pion mass hypothesis. Figure 4 shows the distribution of the resolution obtained with this procedure. It shows a mean value of with an RMS of , which is close to the design goals.
In Figure 4 is shown the mass-momentum scatter plot computed using eq. 1 for low momentum tracks. Three clear clouds corresponding to pions, kaons and protons can be seen.
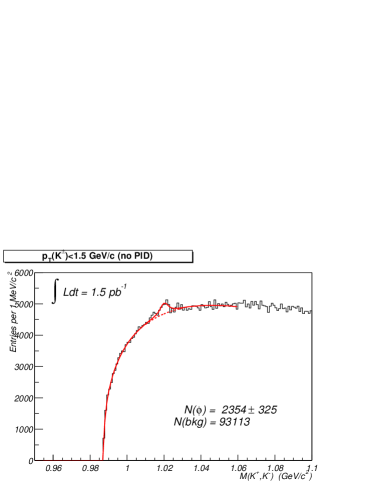
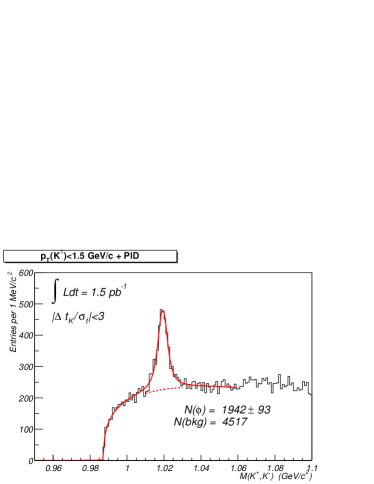
Actual realistic performance of the entire TOF system can be obtained by analyzing the signal in a sample of events recorded by CDFII. The candidates are selected from all pairs of oppositely charged tracks by assuming the kaon mass, with the only constraint that the two tracks originated from the same vertex. Both tracks are required to have a transverse momentum less than and valid reconstructed TOF informations. Figure 5 shows the invariant mass distributions obtained before and after applying TOF kaons particle identification. A clear signal peak in the distribution appears in the latter case, corresponding to a factor background reduction and signal efficiency.
4 Flavor Tagging with TOF in CDFII
The primary purpose of the TOF detector is to identify charged
pions, kaons and protons. In the context of physics, particle
identification is useful both for reconstructing decays and for
flavor tagging.
In particular the CDF TOF detector was designed to substantially improve
the statistical precision in the measurement of CP violation, as well
as the sensitivity in measuring oscillations.
By the term ” flavor tagging” we mean the ensemble of procedures
and algorithms which act to determine the flavor of the meson when
it was produced.
The figure of merit for a flavor tagging method is its ”total tagging
effectiveness”, . The efficiency accounts for
the fact that we can apply
a flavor tag only to a fraction of the candidates.
The dilution is related to the fact that sometime
the obtained tag is wrong. If we call the probability that the tag is
correct, the dilution is then defined as , so for a
perfect tag we will have , and for a random tag .
The total tagging effectiveness determines the effective statistical power
of the sample,
so that, for example, the statistical error on the determination of a CP asymmetry
with total candidates is proportional to
. An
additional flavor tagging method that would increases by a factor of two
would lead to a reduced statistical error on by .
The methods of flavor tagging can be divided in two categories: ”opposite-side” tagging (OST) [6] and the ”same-side” tagging (SST) [7]. The former relays on the fact that the dominant production mechanism of quarks in hadron collisions generates pairs. To identify the flavor of a reconstructed meson of interest, we identify the flavor of the second hadron in the event and infer the flavor at production of the primary one. The same-side flavor tag exploits instead the correlation between flavor and the charge of the particles accompanying the reconstructed . In particular, a is expected to be produced in association with a meson, and a with a .
The CDFII TOF can be used to enhance both opposite-side and same-side flavor tagging. The decays of hadrons will contain more likely a than a in the final state due to week decays. Therefore identifying a charged kaon from the -decay can be used as an opposite-side flavor tag. In Figure 7 the Montecarlo momentum spectrum of kaons from the opposite-side decay to the signal is shown. More than of the available kaons are in a momentum range where the CDFII TOF can give a separation power from charged pions. The CDFII potential for the opposite-side flavor kaon tag using the TOF has been estimated with a Montecarlo simulation, assuming the design resolution of . This gave , which is more than a factor two higher than the typical values obtained in RunI [6], [7].
The TOF can be used for same-side tagging as well. In the hadronization process when a meson is produced an pair must be popped from the vacuum during fragmentation. The remaining or quark can join a or quark to form a charged kaon. The charge of the kaon thus depends on the flavor of the meson at production. A factor four increase on has been obtained, using Montecarlo simulations, for same-side tagging of using TOF informations (from to ).
Combining all the flavor tag methods available in RunII, CDFII has estimated a total of for mesons using TOF for particle identification [8]. This large effectiveness will greatly increase the sensitivity for the measurement of the mixing parameter , one of the unique measurement of Tevatron during the RunII. In Figure 7 the luminosity required to achieve a five standard deviation observation of mixing as a function of the mixing parameter is shown. The projection [8] is based on Montecarlo simulation of fully hadronic decays of the hadrons, and assumes a fully operational CDF detector and trigger system, work is in progress to determine the sensitivity using RunII data. Within the Standard Model various experimental results indicate that at the confidence level [9]. Therefore, if mixing occurs as expected in the Standard Model, it should be observed even with a few hundreds of of total integrated luminosity.
5 Conclusion
The new CDFII Time-of-Flight detector become operational in August 2001. Since then, it has working reliably without any significant problem. The first round of calibrations is available and preliminary studies show that the time resolution goal seems reachable. We expect substantial improvements using the TOF in the ”B” physics program of CDF in coming years.
References
- [1] R.Blair et al., ”The CDFII Detector: Technical Design Report”, FERMILAB-PUB-96-390-E.
- [2] C.Paus et al., ”Design and Performances Test of the CDF Time-of-Flight system”, NIM, vol. A461 (2001) 579-581.
- [3] C.Grozis et al., ”The Time-of-Flight Detector at CDF”, Nucl.Phys.Proc.Suppl., vol. 47 (2001) 344-347.
- [4] C.Grozis et al., ”A Time-of-Flight Detector for CDF”, Int.J.Mod.Phys. A16S1C (2001) 1119-1121.
- [5] C.Chen et al., ”Front End Electronics for the CDFII Time-of-Flight System”, in the proceedings of 2001 IEEE NSS/MIC Symposium.
- [6] CDF Collaboration, F.Abe et al., Phys.Rev. D60 (1999) 072003.
- [7] CDF Collaboration, F.Abe et al., Phys.Rev.Lett. 80 (1988) 2057 and Phys.Rev. D59 (1999) 032001.
- [8] K.Anikeev et al., ”B Physics at Tevatron: RunII and Beyond”, FERMILAB Pub-01/197, hep-ph/0201071.
- [9] F.Parodi, P.Rodeau, A.Stocchi, Nuovo Cim. A112 (1999) 833.
![[Uncaptioned image]](/html/hep-ex/0209027/assets/x1.png)
|
![[Uncaptioned image]](/html/hep-ex/0209027/assets/x2.png)
|
![[Uncaptioned image]](/html/hep-ex/0209027/assets/x3.png)
|
![[Uncaptioned image]](/html/hep-ex/0209027/assets/x4.png)
|
![[Uncaptioned image]](/html/hep-ex/0209027/assets/x7.png)
|
![[Uncaptioned image]](/html/hep-ex/0209027/assets/x8.png)
|