SHORT BASELINE ACCELERATOR-BASED NEUTRINO OSCILLATION SEARCHES
Abstract
We review the status of the search for neutrino oscillations in the short baseline regime with experiments at accelerators. The evidence for from the LSND experiment is compared with the negative results of the KARMEN search and with the results from NOMAD and NuTeV in the same flavor mixing channel. We describe the upcoming MiniBooNE experiment which should be sufficiently sensitive to unambiguously confirm or completely rule out the LSND signal.
1 Introduction
In the last years, tremendous progress has been achieved to firmly establish the nature of neutrino oscillations using neutrinos from the sun [1] as well as neutrinos produced in the earth’s atmosphere [2]. However, with oscillation parameters accessible to accelerator based experiments, the situation remains unsettled. There is one evidence for oscillations in the appearance mode from the LSND experiment which is ruled out in part by other experiments such as KARMEN, NOMAD and NuTeV.
In this paper, we summarize the status of the search for appearance of () from () sources indicating the flavor oscillation (). Restricting the discussion to this oscillation channel, we can simplify the 3-dimensional neutrino mass and mixing scheme to a 2-dimensional one which leads to an oscillation probability for the appearance of in a pure beam of
| (1) |
As can be seen from equ. 1, the experimental sensitivity to the oscillation parameter is given by the distance between source and detector and the neutrino energy . The ratio in the above formula is typically given in units of m/MeV (see section 2 for LSND and KARMEN or km/GeV (see section 3 for NOMAD and NuTeV).
2 Medium-energy beam stop sources
Existing medium-energy high intensity neutrino sources (LANSCE111Los Alamos Neutron Science Center, Los Alamos, USA, ISIS222ISIS at Rutherford Appleton Laboratory, Chilton, UK) are based on accelerators with a proton kinetic energy of 800 MeV and a beam stop or neutrino production target of high-Z material. Due to the massive target (e.g. Copper, Tantalum or Uranium), the resulting neutrino fluxes arise from and decays at rest (DAR) and hence are well understood. and that stop are readily captured in the high-Z material of the beam stop. The production of kaons or heavier mesons is negligible at these proton energies. The flux is calculated to be only as large as the flux, so that the observation of a event rate significantly above the calculated background would be evidence for oscillations.
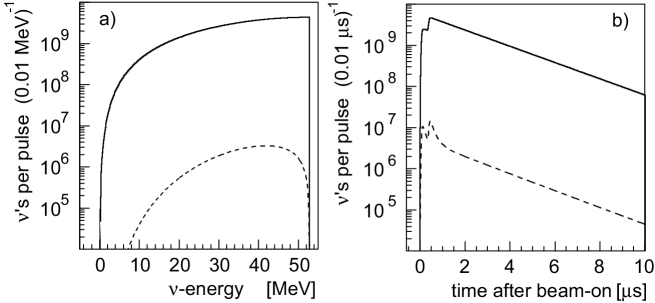
Figure 1(a) shows the spectrum from DAR (solid line) together with the contribution. The absolute flux corresponds to the neutrino production of the ISIS accelerator with 200 A proton current and a Ta–D2O target. If the time structure of the proton pulses is significantly smaller than the muon lifetime of 2.2 s, the neutrinos show the corresponding exponential decrease (as in Fig. 1(b), an important feature to suppress cosmic induced background). Otherwise, as for LANSCE with its 600 s long proton pulses, neutrinos are almost constantly produced during beam-on times.
2.1 The LSND evidence for
The LSND experiment took data over the years 1993–1998. During this period the LANSCE accelerator delivered 28 896 C of protons on the production target. The LSND detector consisted of an approximately cylindrical tank of 210 m3 volume. The center of the detector was 30 m from the beam stop neutrino source. The tank was filled with liquid scintillator of low scintillator concentration which allowed the detection of both Čerenkov and scintillation light. For all details see [3] and references therein.
A signal from oscillations consists of a spatially correlated delayed (e+,n) sequence from p ( , e+ ) n . This requires a prompt ’electron-like’ event with energy MeV followed by a low energy –event from neutron capture. The information about the delayed event is compressed into a likelihood ratio : If within one millisecond after the initial event another event is recorded at distance cm, the ratio of likelihood in energy, time and distance of being a correlated p ( n, ) over an accidental coincidence is calculated, otherwise .
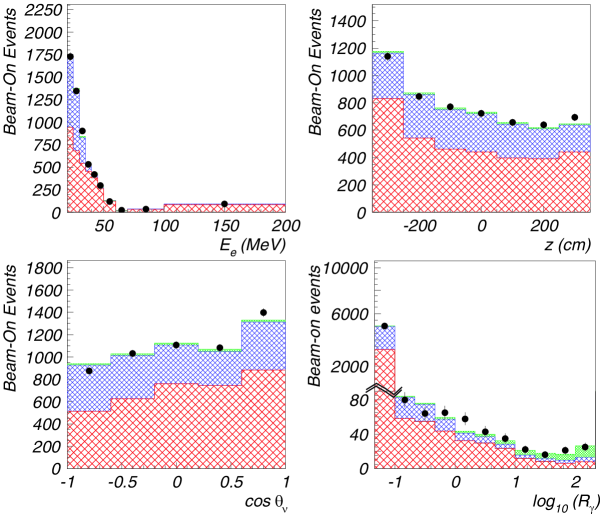
To determine the oscillation parameters and in a likelihood analysis, only loose cuts are applied. The beam-on event sample then contains 5697 candidates shown in Fig. 2 with their spectral information in visible energy , spatial distribution along detector axis , the angle between the incident neutrino direction and the visible electron-like track and the (e+,n) correlation parameter .
The event-based lhd function reaches its maximum at corresponding to an excess of 89.5 events attributed to oscillations . With a difference of , the oscillation hypothesis is strongly favored over the no–oscillation case. The contributions in Fig. 2 (from bottom to top) show the result of a likelihood analysis in all 4 parameters: 3664.6 cosmic induced events, 1936.8 events induced by known SM processes and on top (light grey) the about 90 excess events 333The sum of these 3 contributions leaves 6.1 events attributed to the appearance of from with arising from decays in flight. See [3] for details. from . We will discuss the results in terms of the oscillation parameters later in section 2.3.
2.2 The KARMEN limit for
The KARMEN experiment used the ISIS neutrino source. In contrast to the LANSCE source, the protons are extracted from the synchrotron as an intense but narrow double pulse of 525 ns total width. The unique time structure of the ISIS proton pulses allowed a clear separation of –induced events from any beam unrelated background. The KARMEN detector was a rectangular high resolution liquid scintillation calorimeter, located at a mean distance of 17.7 m from the ISIS target and shielded by a multilayer active veto system and 7000 t steel. The liquid scintillator volume (65 m3) was optically separated into 512 independent central modules. Gadolinium was implemented between the module walls for an efficient detection of thermal neutrons Gd ( n, ) with on average 3 ’s of energy MeV.
The KARMEN 2 experiment took data from February 1997 to March 2001. During this time, protons equivalent to a total charge of 9425 Coulombs have been accumulated on the ISIS target.
As for LSND, a signal from oscillations consists of a spatially correlated delayed (e+,n) sequence. The requirements for event sequences in KARMEN are described in detail in [4] and references therein. Applying all cuts to the data, 15 (e+,n) candidate sequences were finally reduced. Figure 3 shows the remaining sequences in the appropriate energy and time windows.

The background components are also given with their distributions. All components except the intrinsic contamination are measured online in different time and energy windows (see Table 1).
| Process | Expectation | Determination |
|---|---|---|
| Cosmic induced background | meas. in diff. time window | |
| Charged current coinc. | meas. in diff. energy, time wdws. | |
| –induced random coinc. | meas. in diff. time wdw. | |
| source contamination | MC–simulation | |
| Total background | ||
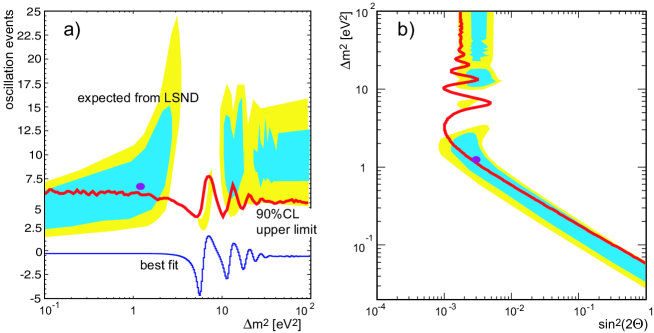
The extracted number of sequences is in excellent agreement with the background expectation, consistent with no oscillation signal. To also include the detailed spectral information of each individual event, an event-based maximum likelihood method is applied. Fig. 4(a) shows the results of this analysis in terms of oscillation events as function of . The best fit line is compatible with zero. Applying a unified frequentist approach [5] leads to the given 90% C.L. upper limit which can be compared to what one would expect as signal strength in KARMEN taken the evidence from LSND.
2.3 LSND and KARMEN: a critical review
Fig. 4 shows a comparison of the LSND and KARMEN results obtained after analysing the final data samples with an event-based maximum likelihood method. In plot 4(a), the LSND evidence with its statistical error is translated into an expected range of oscillation events among the KARMEN data. At large values of , the experimental outcomes are in clear contrast whereas at small , the expected event number is below the 90% C.L. exclusion curve. Fig. 4(b) shows the same results, the KARMEN exclusion curve (for large 90% C.L.) as well as the evidence band of LSND (, ), now as functions of the oscillation parameters and .
Since both experiments have similar sensitivity to the oscillation parameters but different central statements about oscillations leading to a partial overlap of exclusion curve and favored region, one has to solve the following problems quantitatively: What is the level of compatibility of both experiments? Assuming statistical compatibility, what are the oscillation parameters accepted by both experiments?
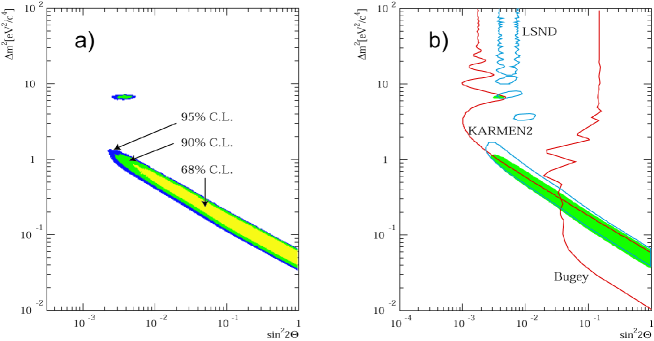
A detailed combined statistical analysis [6] has been performed to answer these questions. We summarize the main results also shown in Fig. 5. At a combined level of 60 % 60 % =36 %, the LSND and KARMEN results are incompatible. Taking the rest probability of 64 %, the favored parameter regions are shown in plot 5(a). In Fig. 5(b), the parameter region of 90 % 64 % =58 % probability of occurrence is shown together with the individual results obtained in the same analysis [6].
To summarize, LSND and KARMEN are incompatible at a level of 36 % confidence. Assuming statistical compatibility, all parameter combinations with eV2 are excluded apart from a little ’island’ at eV2.
3 Experiments with neutrino beams
In section 2, we dealt with neutrino energies of tens of MeV. Neutrinos from high energy proton beams typically have energies of tens up to hundreds of GeV. These higher energies increase the cross section for neutrino interactions with the detector material as well as decrease substantially any beam-uncorrelated background. However, the neutrino flux has to be modeled carefully and cannot –as for the beam stop neutrino source– simply calculated analytically. Detectors are typically at a distance of several hundreds of meters from the neutrino source, leading to a so-called short baseline regime: km/GeV corresponding to a very high sensitivity in for values larger than several tens of eV2 mainly limited by the intrinsic ’wrong’ flavor component within the beam, typically of the order of 1–2 %.
3.1 The NOMAD search
The NOMAD experiment took data from 1995–1998 using the CERN wide band neutrino beam from the 450 GeV PS. We summarize here only the search for and refer the reader for all details of the experiment as well as the search to reference [7]. The MOMAD detector was a high resolution detector to separate induced charged current (CC) events by kinematic criteria with a momentum resolution of 3.5 % ( GeV). It had a fine grained calorimetry leading to % and a particle identification via a TRD resulting in a pion rejection of with electron efficiency %.
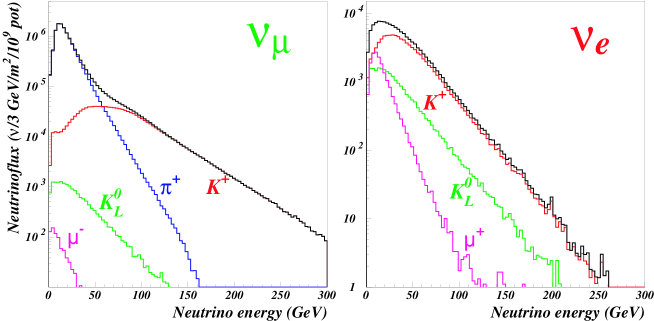
Fig. 6 shows a simulation of the and spectra within a transverse fiducial area of cm2 of the detector [8].
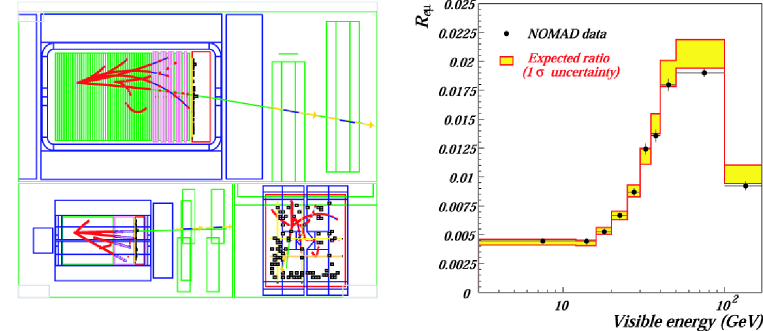
The NOMAD search was an appearance experiment based on electron identification with contamination in the beam of %. The different energy spectra and radial distributions of and within the detector were used to calculate an expected ratio of –induced events as function of and (see Fig. 7(left) for a typical –induced CC event). This ratio was then compared with the reconstructed events containing 748000 CC and 8000 CC candidates. The distribution in data and MC (Fig. 7) shows no excess of CC, therefore leading to an exclusion of oscillation parameters, i.e. for large at 90% C.L. [8] (see also Fig. 10 for the preliminary NOMAD exclusion curve). It is interesting to note that the NOMAD result underlines the KARMEN exclusion at values eV2 and that the 90% C.L. exclusion curve narrowly passes the allowed ’island’ at eV2.
3.2 The NuTeV and searches
The NuTeV experiment at Fermilab took data from 1996–1997, using the 800 GeV primary proton beam from the Tevatron. A sign selected quadrupole train lead to a very effective separation of neutrino and anti-neutrino beams, allowing separate searches of and oscillations by appearance of or , respectively. After a 320 m decay pipe followed by 915 m of shielding, the detector consisted mainly of a sandwich system of steel slabs and scintillator planes. CC events induced by or can be separated via the energy deposit in the first 3 scintillators compared to the total deposit : ’short’ tracks indicate electron like events whereas ’long’ tracks point to muons. For all details of the oscillation search see [9] and references therein for the experimental setup.
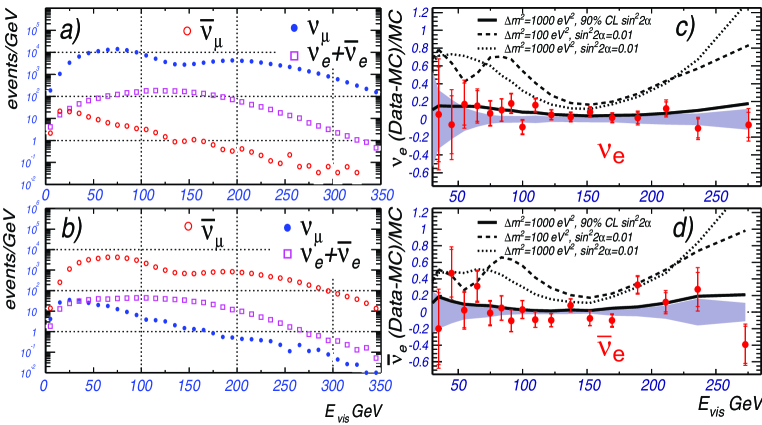
A detailed beam simulation predicts the visible energy spectra from various –induced CC events given in Fig. 8(a) and (b). Fig. 8(c) and (d) show the ratios of the detected over predicted (, ) event numbers versus visible energy minus 1. The lines correspond to the predictions of various oscillation scenarios, the solid is the 90% C.L. upper limit for eV2. The exclusion curve for as function of the oscillation parameters relevant for LSND is shown in Fig. 10 excluding the very high region thereby confirming KARMEN and NOMAD.
3.3 The MiniBooNE experiment
The MiniBooNE experiment at Fermilab is designed to cover the entire parameter range favored by LSND with a completely different experimental setup [10] by looking for disappearance and appearance from in a beam.
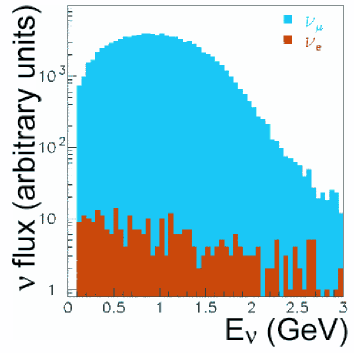
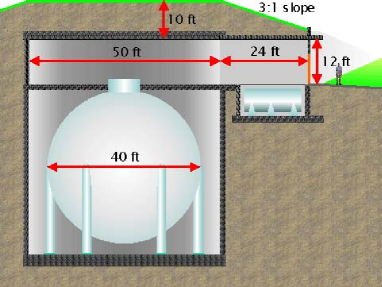
MiniBooNE will use the 8 GeV booster at Fermilab’s main injector to produce a neutrino beam with significant contributions at energies above 500 MeV. The Čerenkov detector is a spherical tank of 40 ft diameter filled with 776 tonnes of mineral oil viewed by 1275 8” PMT’s at a distance of 500 m from the neutrino production point. Again, the neutrino flux must be known precisely by MC simulations and special checks. The expected fluxes as well as a schematic view of the detector are shown in Fig. 9.
After 2 years of data taking corresponding to protons on target, MiniBooNE expects to detect about –induced CC events and 3500 electron-like events out of which about 1000 events would arise from a oscillation according to the LSND signal [11]. The expected experimental sensitivity is shown in Fig. 10 as exclusion curve in case there will be no oscillation signal. The detector is already operational, the first neutrino beam is scheduled to be delivered mid of 2002.
4 Conclusions
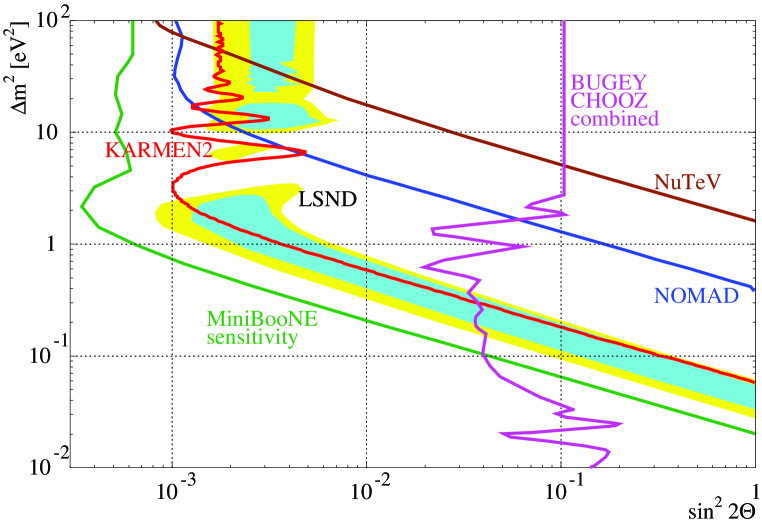
We have discussed the LSND evidence for oscillations together with the negative searches performed by KARMEN, NOMAD and NuTeV in the same flavor channel. The KARMEN result is the most limiting one confirmed by NOMAD and NuTeV at higher values of . Though there are no further hints than the LSND result for neutrino oscillations with a mass difference in the order or larger than 0.1 eV2, no existing short baseline experiment can rule it out completely. The upcoming MiniBooNE experiment should be sensitive enough to definitively confirm or refute the LSND result interpreted as appearance of due to oscillations .
References
- [1] A. McDonald, proc. Physics in Collision, Stanford, California, June 20-22, 2002.
- [2] T. Nakaya, proc. Physics in Collision, Stanford, California, June 20-22, 2002.
- [3] A. Aguilar et al., Phys. Rev. D 64, 112007 (2001).
- [4] B. Armbruster et al., Phys. Rev. D 65, 112001 (2002).
- [5] G. J. Feldman and R. D. Cousins, Phys. Rev. D 57, 3873 (1998).
- [6] E. Church et al., Phys. Rev. D 66, 013001 (2002).
- [7] P. Astier et al., Nucl. Phys. B 611, 3 (2001).
- [8] V. Valuev, proc. EPS Conf. on HEP, Budapest, Hungary, July 12-18, 2001.
- [9] S. Avvakumov et al., Phys. Rev. Lett. 89, 011804 (2002).
- [10] A. Bazarko, Nucl. Phys. B (Proc. Suppl.) 91, 210 (2001).
- [11] R. Tayloe, proceedings Neutrino 2002, Munich, Germany, May 25-30, 2002.
- [12] B. Achkar et al., Nucl. Phys. B 434, 503 (1995).
- [13] M. Apollonio et al., Phys. Lett. B 466, 415 (1999).