SLAC-PUB-9285
September 2002
Search for time-dependent oscillations
using a vertex charge dipole technique
Abstract
We report a search for oscillations using a sample of hadronic decays collected by the SLD experiment. The analysis takes advantage of the electron beam polarization as well as information from the hemisphere opposite that of the reconstructed decay to tag the production flavor. The excellent resolution provided by the pixel CCD vertex detector is exploited to cleanly reconstruct both and cascade decay vertices, and tag the decay flavor from the charge difference between them. We exclude the following values of the oscillation frequency: ps-1 and ps-1 at the 95% confidence level.
pacs:
13.20.He, 13.25.Hw, 14.40.NdI INTRODUCTION
Neutral meson mixing plays a crucial role in the determination of the Cabibbo-Kobayashi-Maskawa matrix elements and . However, the extraction of these elements from measurements of the oscillation frequency is complicated by the presence of hadronic uncertainties. Lattice QCD calculations Bernard give a 15–20% uncertainty in the determination of from the precisely measured value of the oscillation frequency, , due to the large uncertainty in the decay constant and the “B” parameter for mesons. This uncertainty can be reduced by extracting the ratio from the ratio of and oscillation frequencies, , as many theoretical uncertainties common to and mixing cancel, leading to a reduced theoretical uncertainty of 5–10% Bernard ; Kronfeld . In the framework of the Standard Model, is constrained by unitarity so the measurement of the oscillation frequency will significantly improve our knowledge of .
Measuring the oscillation frequency requires three ingredients: the or flavor at both production and decay, and the proper decay time. In the Standard Model, one expects to be an order of magnitude larger than , making it difficult to measure as the rapid oscillations have to be resolved in the detector. The SLD pixel CCD vertex detector is particularly well suited to this task thanks to its excellent three-dimensional vertex resolution. The analysis presented here determines the flavor at production by exploiting the large forward-backward asymmetry of polarized decays and uses additional information from the hemisphere opposite that of the reconstructed decay. The flavor at decay is tagged by the charge difference between the and cascade decay vertices. This novel “charge dipole” technique relies heavily on the high resolution of the vertex detector to reconstruct separate secondary and tertiary vertices originating from the decay chain. Throughout this paper, when reference is made to a specific state, the charge conjugate state is also implied.
II APPARATUS
The analysis uses a sample of hadronic decays collected by the SLD experiment at the SLC between 1996 and 1998. The detector elements most relevant to this analysis are the pixel CCD Vertex Detector (VXD) vxd3 for precise track position measurements near the SLC Interaction Point (IP), and the Central Drift Chamber (CDC) for charged particle reconstruction and momentum measurement. Charged tracks are reconstructed using hits in both VXD and CDC. The track impact parameter resolution at high momentum is measured to be 7.8 m transverse to the beam direction ( plane) and 9.7 m in the plane containing the beam direction ( plane). The centroid of the stable, micron-sized IP in the plane is reconstructed using tracks in sets of sequential hadronic decays, with a measured precision of m. The coordinate of the IP is determined event by event using the median position of the tracks at their point of closest approach to the beam line. A precision of m is achieved for events, as estimated from the Monte Carlo (MC) simulation.
For a description of the SLD detector and the MC simulation see Ref. sldpaper . Decays of mesons are modeled according to the decay modes of mesons juliathesis assuming SU(3) flavor symmetry. The simulation has been tuned to reproduce tracking efficiencies and impact parameter resolutions measured in the data.
III EVENT SELECTION
The selection of -hadron candidates proceeds in two stages. First, hadronic decays are selected. Second, events are selected with an inclusive topological reconstruction of -hadron decays. Vertex and kinematical information (mass and momentum) is used at this stage to remove background. This second stage also serves as a means to select tracks associated with the -hadron decay chain.
In the first stage, we select a sample of hadronic decays. The criteria, detailed in Ref. sldpaper , aim to remove leptonic final states, two-photon collisions and beam-induced background events. The remaining background, predominately due to events, is estimated to be %.
In the second stage, each event is divided into two hemispheres with respect to the thrust axis. In each hemisphere, a search is made for three-dimensional space points with high track overlap density which are displaced from the IP, taking the individual track resolution functions into account zvtop . At this stage, no attempt is made to separate and decay vertices and a single “seed” vertex (SV) is formed containing all tracks from the -hadron decay chain. Tracks are required to have VXD hits, momentum transverse to the beam line MeV/c, and three-dimensional impact parameter mm. Tracks consistent with originating from a conversion or from or decay are removed. Identified vertices are required to be within a radius of 2.3 cm of the center of the beam pipe to remove vertices resulting from interactions with the detector material. Two-prong vertices are required to have an invariant mass at least 0.015 GeV/c2 away from the nominal mass to remove most of the remaining decays. A set of two neural networks is used to suppress light-flavor () background and to select the charged tracks associated with the -hadron decay btom . The first neural network takes as input the distance between the IP and the SV, that distance normalized by its error, and the angle between the vertex axis and the total momentum vector of the SV. The vertex axis is defined as the line joining the IP and the SV. At least one good vertex is found in 72.7% of bottom, 28.2% of charm, and 0.41% of quark hemispheres in the MC simulation. The second neural network improves the -hadron charge and mass reconstruction by associating tracks not used in the initial vertexing to the seed vertex. For each track, five parameters are taken as input to the neural network. The first four (measured at the point of closest approach between the track and the vertex axis) are the distance of closest approach, the distance between the IP and the point of closest approach along the vertex axis, the ratio between that distance and the IP-to-SV distance, and the angle between the track and the vertex axis. The fifth parameter is the three-dimensional impact parameter normalized by its error. A 10% inefficiency in full CDC-VXD track reconstruction is partly recovered by also including tracks reconstructed in the VXD alone (“VXD-only” tracks). Including VXD-only tracks with at least one hit in each of the three VXD layers reduces the tracking inefficiency to 3% for heavy hadron decay products. These tracks are used for vertex charge reconstruction but not for vertex momentum or mass reconstruction because of their poor momentum resolution.
A sample of candidates is then selected by requiring that either hemisphere in the event contain a seed vertex with mass GeV/c2, where is partially corrected for missing neutral decay products sldpaper . The fraction of remaining light-flavor events is estimated to be 2.9% from the simulation.
IV CHARGE DIPOLE RECONSTRUCTION AND DECAY FLAVOR TAG
In the last phase of the analysis, we aim to reconstruct both and decay vertices in a given hemisphere. We can then tag the or decay flavor based on the charge difference between these vertices. The charge difference is expected to be (0) for decays with a charged (neutral) meson. This charge dipole method relies on the fact that the and cascade flight directions are very nearly co-linear and the and decay points are separated along the flight direction. The final vertex reconstruction is carried out separately for each event hemisphere and proceeds in two steps.
In the first step, the -hadron flight direction is determined using a set of tracks selected by one of two different procedures. The main track selection procedure uses the set of tracks (including VXD-only tracks) associated with a seed vertex. An alternative procedure is used if no SV is found in the hemisphere (representing 15% of the decays in the final sample). In this case, tracks are required to have either 3 VXD hits and MeV/c, or 2 VXD hits, 23 CDC hits, MeV/c, a for both CDC and CDC+VXD track fits, a first CDC hit with a radius cm, a 2D impact parameter in 1 cm, and a distance of closest approach to the IP cm. The latter procedure is useful to recover part of the inefficiency of the SV finding algorithm for hadrons decaying close to the IP, a region where the sensitivity to oscillations is highest. The tracks selected with either of the two above procedures are then used to estimate the -hadron flight direction. This is done with a “ghost” track anchored at the IP and initially given an error of 25 m. Each of the selected tracks is individually vertexed with the ghost track and the sum of the two-prong vertex fit values is computed. The direction of the ghost track is varied until this sum is minimized—with the final direction representing the best estimate of the -hadron line of flight. The ghost track error is then scaled such that the largest single two-prong vertex fit equals 1.
In the second step, the selected tracks are divided into subsets defining decay vertices along the ghost track. This is done using the following iterative procedure. Initially, the probabilities for all two-track ghost track and track IP candidate vertices are calculated. The vertex with the highest fit probability is saved and its track(s) is (are) removed from the list of available tracks. If the highest probability vertex is one of the track IP vertices, it defines a new IP vertex. The highest probability vertex then serves as a new candidate vertex for the next step, where again all combinations of the remaining tracks with the new candidate vertex, with each other and the ghost track, and with the IP are formed. This process continues until all vertex fit probabilities are lower than 1%. A single IP results from this procedure. All remaining tracks (not incorporated in the IP or a multi-prong vertex) are then combined with the ghost track to form one-prong vertices. One advantage of this technique is that it allows for the reconstruction of one-prong decay vertices, which are fairly common in both and decays. Details about the ability of this technique to reconstruct the correct number of vertices can be found in Ref. achou .
Hemispheres with exactly two vertices (in addition to the IP) are selected. The (secondary) vertex that is closer to the IP is labeled “” and the (tertiary) vertex farther away is labeled “”. If the vertex contains two or more tracks, the vertex is further refined by adding a virtual “track” to those tracks already attached to the vertex and a new vertex fit is performed. The track is formed using the vertex position and the net momentum direction of the vertex tracks. The error matrix of the track is scaled as a function of the vertex mass to partially account for the fact that the meson is not fully reconstructed.
The vertices must satisfy a series of criteria to guarantee that the and vertices are well separated and well reconstructed: the vertex is downstream from the IP and has a radius cm, the distance between the and vertices () satisfies m cm, the vertex mass is smaller than 2.0 GeV/c2 (assuming all tracks are pions), the ghost track error is smaller than 300 m, and the cosine of the angle between the nearest jet axis direction and the straight line connecting the IP and the vertex is greater than 0.9. For purposes of flavor tagging (see below), the and vertex charges are required to be different. Several cuts are applied to enhance the purity and further improve the quality of the reconstruction for candidates: the net charge of all tracks associated with the decay chain is required to be zero and neither vertex may contain a VXD-only track with GeV/c to make sure that the charge is reliably reconstructed. Finally, decays are suppressed by vetoing decays including candidates. To this end, a veto is applied if slow pion candidates in either or vertices have a mass difference less than 0.16 GeV/c2. This veto reduces the () selection efficiency by 5% (13%) and results in a purity increase of 5%. For all data and MC events, we remove hemispheres already containing a vertex selected in two complementary analyses, one with fully reconstructed Dstracks and the other with a lepton + vertex. Such a removal is necessary to avoid statistical correlations and facilitate the combination of results from different analyses.
After applying all the above cuts, a sample of decays remains. The sample composition is 15.7% , 57.2% , 15.9% , 10.1% baryon, and 1.1% , as determined from the simulation. The decay flavor is determined by the sign of a vertex charge dipole defined as , where () is the charge of the () vertex. Positive (negative) values of tag () decays. Figure 1 shows the charge dipole distribution for the data sample and also indicates the separation between hadrons containing or quarks in the simulation.

The mistag probability for selected () decays is 22% (24%), as determined from the simulation. The mistag probability depends on the charm content of the decay products. For example, the mistag probability is only 10% for decays ( represents any state without charm) but 46% for decays proceeding through a transition, where the latter category accounts for 24% of the selected decays. Detailed studies of and vertex charge, multiplicity and separation show that the simulation reproduces the data well (see Ref. juliathesis ).
The proper time is computed using the measured decay length and momentum of the candidate, . The decay length is defined as the distance between the IP and the vertex. In the particular case of and vertices both containing just one track (representing 17% of the final sample), the decay length is reconstructed by averaging those decay lengths obtained from the ghost track + track vertex and the track + track vertex. The decay length residuals for correctly (incorrectly) tagged decays containing three or more tracks can be described by the sum of a core Gaussian with a width of m (m) and a tail Gaussian with a width of m (m), where the fraction of events in the core Gaussian is 60%. The momentum of the candidate is reconstructed with an optimized average of two different methods. The first method bmoore starts with tracks associated with the decay and iteratively adds high energy ( GeV) neutral clusters (from the electromagnetic calorimeter) close to the vertex line of flight, until the invariant mass of the decay products is close to the mass. The second method bdong does not use calorimeter information but relies on the associated tracks and the amount of missing transverse momentum to estimate the momentum. A parametrization with the sum of two Gaussians yields a 60% core width of and a 40% tail width of for selected decays.
V PRODUCTION FLAVOR TAG
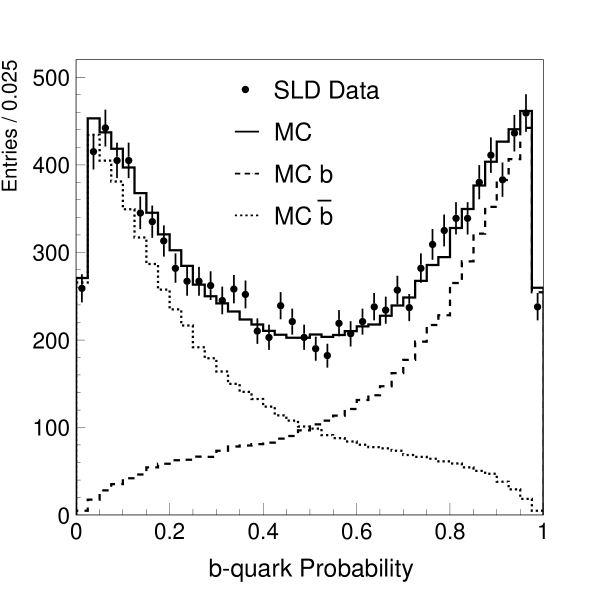
The flavor at production is determined with a combination of six tags: polarized forward-backward asymmetry, jet charge, vertex charge, charge dipole, lepton and kaon tags, where all but the first are combined in an “opposite hemisphere charge” tag using a series of neural networks. For a detailed description of the polarized forward-backward asymmetry see Ref. sldpaper . Briefly, left- (right-) polarized electrons tag () quarks in the forward hemisphere, and () quarks in the backward hemisphere. Averaged over the acceptance, this yields a mistag probability of 28% for our average electron beam polarization of . The opposite hemisphere charge tag employs tracks and topological vertices reconstructed in the hemisphere opposite that of the decay candidate. The available tags are: (i) the jet charge tag, where tracks are used to form a momentum-weighted track charge sum sldpaper , (ii) the total charge of tracks and charge dipole of a -hadron decay, (iii) the charge of a kaon identified in the Cherenkov Ring Imaging Detector and associated with a -hadron decay (if more than one kaon is found, the total kaon charge is used), and (iv) the charge of a lepton originating from a -hadron decay. These tags are combined using a series of neural networks to form an overall production flavor tag characterized by a -quark probability. The neural networks take into account correlations between the different tags as well as vertex charge, mass and decay length dependencies. The corresponding average mistag rate is 29%. Finally, the result is analytically combined with the independent -quark probability from the tag. The overall average mistag probability is 22% but the information is used on an event-by-event basis, so that a significant fraction of the events have a very high production flavor tag purity. The combined tag is 100% efficient. Figure 2 shows the -quark probability distributions for data and MC as selected in this analysis. It indicates a clear separation between and quarks and good agreement between data and simulation.
VI FIT METHOD AND RESULTS
Decays are tagged as mixed (unmixed) if the production and decay flavor tags disagree (agree). The probability for a decay to be in the mixed sample is expressed as
| (1) | |||||
where represents the fraction of each -hadron type and background (, , and correspond to , , , baryon, and background), describes the proper time distribution of the background, is the lifetime for hadrons of type , is the production flavor mistag probability, and are the decay flavor mistag probabilities for and baryons, and are the decay flavor mistag probabilities for and with the index representing five different decay final states (, , , charmed baryon , and final states resulting from a transition), and () is the fraction of () decays into each of the above final states. A similar expression for the probability to observe a decay tagged as unmixed is obtained by replacing the production flavor mistag rate by .
The quantities in Eq. (1) are determined on an event-by-event basis. The fractions depend on the angle between the event thrust axis and the beam direction to account for the decrease in the reconstruction purity at high . The mistag probability depends on , , and the opposite hemisphere charge neural network output. The mistag probabilities depend on the reconstructed decay length in order to take into account the degradation of the charge dipole tag close to the IP. This effect is rather weak for , and -baryon decays but it is significant for decays. Finally, the decay final state fractions and are parametrized as a function of .
Detector and vertex selection effects are introduced by including a time-dependent efficiency function and convolving the above probability density functions with a proper time resolution function : where is the “true” time and is the reconstructed time. A similar expression applies to the unmixed probability . Each term of the probability density function is divided by a normalization factor given by , which accounts for the limited range of reconstructed proper time considered in this analysis. The resolution function is parametrized by the sum of two Gaussian and two Novosibirsk functions Novo ,
| (2) | |||||
The proper time resolution is a function of proper time that depends on , , and ,
| (3) |
where the index () corresponds to the core (tail) component of the decay length resolution and the index () corresponds to the core (tail) component of the relative momentum resolution. Slight offsets in the decay length reconstruction are modeled by the time-dependent parameters and , whereas an asymmetric tail is modeled by the time-dependent parameter . For each decay, the decay length resolution is computed from the vertex fit and IP position measurement errors, with a scale factor determined using the MC simulation (scale factors for correctly tagged decays are typically 1.0 for the core and 2.0 for the tail components). The momentum resolution is parametrized as a function of the total track energy in each decay, with parameters extracted from the MC simulation. The efficiency is also parametrized using the MC simulation. All parametrizations are performed separately for each -hadron type and for right and wrong charge dipole tags. As a consequence, different resolution functions are used for final states containing one or two charm hadrons.
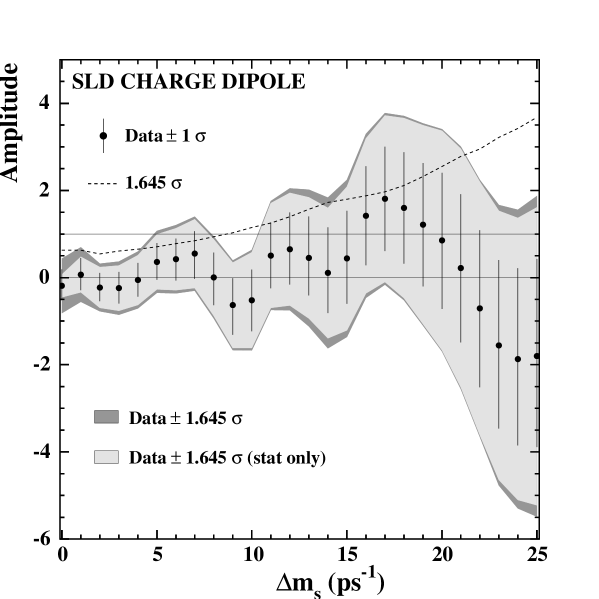
The study of the time dependence of mixing is carried out using the amplitude method Moser . A likelihood fit to the proper time distribution of mixed and unmixed events is performed to determine the oscillation amplitude at fixed values of . That is, in the expression for the mixed and unmixed probabilities, one replaces with and fits for . This method is similar to Fourier transform analysis and has been tested extensively with simulated samples generated at several different values of . The measured amplitude spectrum is shown in Fig. 3. The measured values are consistent with for the whole range of up to 25 ps-1. A signal for mixing, corresponding to an amplitude of , is ruled out for two regions of in the lower half of this range, where .
As a check of the analysis, we performed a fit for the oscillation frequency and found a value of (stat) ps-1, in agreement with the world average value of ps-1 PDG2002 . Conversely, fitting for the oscillation amplitude at a value of ps-1 yields , a value consistent with unity as expected for a signal. Furthermore, the charge dipole mistag rate is measured directly from the data for and decays and found to agree with MC values within uncertainties (see next section). To test the charge dipole tag for decays, we select semileptonic decay candidates tagged as mixed and with ps to obtain a subsample with a purity of 28%. The charge dipole tag is found to agree with the charge of the lepton in of the cases in the data, to be compared with in the simulation.
VII SYSTEMATICS
Systematic uncertainties have been computed following Ref. Moser and are summarized in Table 1 for several values. The systematic uncertainty takes into account both the change in the measured amplitude and in its error
| (4) |
where () is the nominal amplitude (error) and () is the amplitude (error) obtained for a particular variation of the parameters of the likelihood function. It should be noted that the statistical uncertainty dominates for all the values considered.
| 10 ps-1 | 15 ps-1 | 20 ps-1 | |
|---|---|---|---|
| Measured amplitude | 0.438 | 0.854 | |
| fraction | |||
| Decay length resolution | |||
| Momentum resolution | |||
| Resolution function | |||
| Production flavor tag | |||
| Decay flavor tag |
Uncertainties in the sample composition are estimated by varying the fraction of background by and the production fractions of and baryons according to and , respectively WORKG . Since the purity is one of the most important parameters in the analysis, we also varied the and branching fractions to the five decay final states (, , , charmed baryon , and ) by twice the uncertainty given in Ref. PDG2002 . The corresponding branching fractions for decays are varied by to account for possible deviations due to SU(3) flavor breaking. Furthermore, charge reconstruction uncertainties are evaluated from comparisons between data and MC simulation, especially relying on self-calibration tests detailed in Ref. btom . To account for all uncertainties described above, we vary the purity by . As a cross-check of the fraction of mesons in the selected sample, we fit for with a fit to the fraction of mixed decays as a function of proper time. A value of is obtained, consistent with the MC value of 0.159. Other physics modeling uncertainties, which are due to uncertainties in the -hadron lifetimes and WORKG , are found to be negligible.
Uncertainties in the modeling of the detector include and variations in decay length and momentum resolutions, respectively. The decay length resolution uncertainty is determined from 3-prong decay vertices in the data and the momentum resolution is confirmed to within 10% by comparing the width of the energy distribution in the data with that expected from -quark fragmentation bdong . The systematic uncertainty due to the particular choice of proper time resolution function is evaluated by varying core fractions and offset corrections.
The production flavor tag systematic error accounts for the uncertainties in the forward-backward asymmetry and opposite hemisphere charge tags. Dominant uncertainties for the forward-backward asymmetry tag are the electron beam polarization and the parity-violating parameter . The uncertainty in the opposite hemisphere charge tag is extracted from events in which both hemispheres have such a tag. These double-tagged events provide a direct measurement of the average mistag rate, which agrees very well with the MC value and has an uncertainty of . The total uncertainty in the average production flavor mistag probability is estimated to be . Furthermore, we allow for a deviation in the shape of the -quark probability distribution for the data. The corresponding uncertainty is dominated by a uncertainty in the slope of the -quark probability as a function of opposite hemisphere charge neural network output, as extracted from double-tagged events in the data.
The decay flavor mistag probability is varied by for all hadrons. This uncertainty is determined from fits to the and mistag probabilities in the measured dipole-tagged forward-backward asymmetry and the fraction of mixed decays as a function of proper time. These fits confirm that the mistag rate for and decays is correctly modeled in the simulation. To account for a possible deviation from SU(3) flavor symmetry, an additional 7% uncertainty is assigned to decays. This value is obtained assuming an additional 20% uncertainty in the branching fraction for decays proceeding via a transition (since these dominate the mistag rate).
Including the systematic uncertainties, the following ranges of oscillation frequencies are excluded at the 95% C.L.: ps-1 and ps-1. That is, the condition is satisfied for those values. The sensitivity to set a 95% C.L. lower limit, defined as the value below which , is found to be 8.7 ps-1.
VIII CONCLUSIONS
We have performed a search for oscillations using a sample of hadronic decays collected by the SLD experiment. The cascade structure of -hadron decays is reconstructed and the flavor at decay is tagged with a novel charge dipole technique that relies heavily on the excellent resolution of the CCD pixel vertex detector. The flavor at production is tagged using the polarized electron beam as well as track and vertex information from the hemisphere opposite that of the candidate. With a final sample of decays, we achieve a sensitivity of 8.7 ps-1 and exclude the following values of the oscillation frequency: ps-1 and ps-1 at the 95% C.L.
Combining these results with those obtained from a sample of fully reconstructed mesons Dstracks yields a combined SLD sensitivity of 11.1 ps-1 and excludes oscillation frequencies ps-1 at the 95% C.L. This result confirms previous studies performed by the ALEPH, CDF, DELPHI, and OPAL Collaborations BOSCWG , and is among one of the most sensitive to date.
ACKNOWLEDGMENTS
We thank the personnel of the SLAC accelerator department and the technical staffs of our collaborating institutions for their outstanding efforts. This work was supported by the Department of Energy, the National Science Foundation, the Instituto Nazionale di Fisica of Italy, the Japan-US Cooperative Research Project on High Energy Physics, and the Particle Physics and Astronomy Research Council of the United Kingdom.
References
- (1) C.W. Bernard, Nucl. Phys. B (Proc. Suppl.) 94, 159 (2001).
- (2) A.S. Kronfeld and S.M. Ryan, Phys. Lett. B 543, 59 (2002).
- (3) K. Abe et al., Nucl. Instrum. Methods Phys. Res. A 400, 287 (1997).
- (4) P. Rowson, D. Su, and S. Willocq, Annu. Rev. Nucl. Part. Sci. 51, 345 (2001).
- (5) J. Thom, Ph.D. dissertation, Hamburg University, Germany, SLAC-R-585, 2002.
- (6) D.J. Jackson, Nucl. Instrum. Methods Phys. Res. A 388, 247 (1997).
- (7) T.R. Wright, Ph.D. dissertation, University of Wisconsin, SLAC-R-602, 2002.
- (8) A. Chou, Ph.D. dissertation, Stanford University, SLAC-R-578, 2001.
- (9) SLD Collaboration, K. Abe et al., Phys. Rev. D 66, 032009 (2002).
- (10) T.B. Moore, Ph.D. dissertation, Yale University, 1999.
- (11) SLD Collaboration, K. Abe et al., Phys. Rev. D 65, 092006 (2002).
-
(12)
The Novosibirsk function is
- (13) H.G. Moser and A. Roussarie, Nucl. Instrum. Methods Phys. Res. A 384, 491 (1997).
- (14) Particle Data Group, K. Hagiwara et al., Phys. Rev. D 66, 010001 (2002).
- (15) ALEPH, DELPHI, L3, OPAL, CDF, and SLD Collaborations, Combined results on b-hadron production rates, lifetimes, oscillations and semileptonic decays, CERN-EP-2000-096, SLAC-PUB-8492.
- (16) For a complete list of available results, see the B Oscillations Working Group web site at http://www.cern.ch/LEPBOSC/.