LIGHT MESONS FROM CHARM
MESON DECAYS IN FNAL E791
An analysis of the Dalitz plots for the decays and indicates that structure with significant phase variation is required in the -wave and systems in the region below 1 GeV/c2 effective mass. A constant, non resonant “contact” term, together with a simple -wave Breit Wigner amplitude with MeV/c2 for the system and MeV/c2 for the system provide good fits to the data in this region.
1 Introduction
Decays of mesons to three pseudo scalar mesons can produce intermediate, two meson systems with natural parity. Kinematics and angular momentum barrier factors generally favour scalar () over vector or tensor systems. Analysis of these decays can therefore provide new information on the poorly understood scalar meson system.
In most instances, decays appear to proceed through quasi two body channels. In the cases of decays bbbExcept where indicated otherwise, charge conjugate systems are implied in this paper. to and to however, intermediate states found in the Particle Data Group listings (PDG) have been found to contribute only partially to the decays, with three body modes apparently dominant . We report here on analyses of these decays using the largest samples so far examined.
2 Fermilab Experiment E791
In this experiment charm enhanced interactions between 500 GeV/c mesons and thin foil targets (four , one ) are recorded . Foils are spaced so that decays of mesons produced in them occur predominantly between them. Silicon strip detectors measure decay lengths (mean 5 mm) with a typical precision of 350 m. Charged particle momenta are measured with two dipole magnets and drift chambers and two threshold gas Cherenkov detectors provide separation in the 6-60 GeV/c momentum range.
Events with one negative and two positive charged tracks making a good vertex, well separated from any foil and from the primary interaction point, are selected for further analysis. The resultant momentum is required to point back to within 40 m of the primary vertex. For the sample the is required to have momentum GeV/c GeV/c and to be identified by the Cherenkov detectors. Other cuts are also made to reduce contamination from tracks that are really associated with the primary vertex. With these selection criteria, the major sources of background are mostly misidentified (or incomplete) charm decays, with a small, “combinatorial” contribution from false secondary vertices. Yields of 15,090 (6% background) and 1,686 (28% background) remain in the signal regions.
3 Isobar Analysis of Decay to Three Pseudo-Scalars
Decays of mesons to three pseudo scalars can be described approximately as a sum of isobar amplitudes, each corresponding to a quasi two body decay . Each amplitude must satisfy Lorentz invariance and conserve total spin and has the form
where are momenta of and respectively in the rest frame and . Form factors () for () are parametrized in terms of effective radii (). A Breit Wigner propagator describes the resonance with spin , mass . Suffix denotes a quantity evaluated at .
A decay is kinematically specified by coordinates on a Dalitz plot and by the three body mass whose distribution about the mass due to resolution is , determined from the data. The signal distribution of decays is
in which three body decays (NR) are described by a constant, “contact” amplitude .
The distribution of backgrounds is modelled using events from side bands in for combinatorial, and from MC simulations for broken charm sources. The efficiency for observing decays is determined from MC simulations.
Complex coefficients and resonance parameters are determined from fits to a linear combination of and in the correct proportions. The fraction of decay to an isobar is evaluated at .
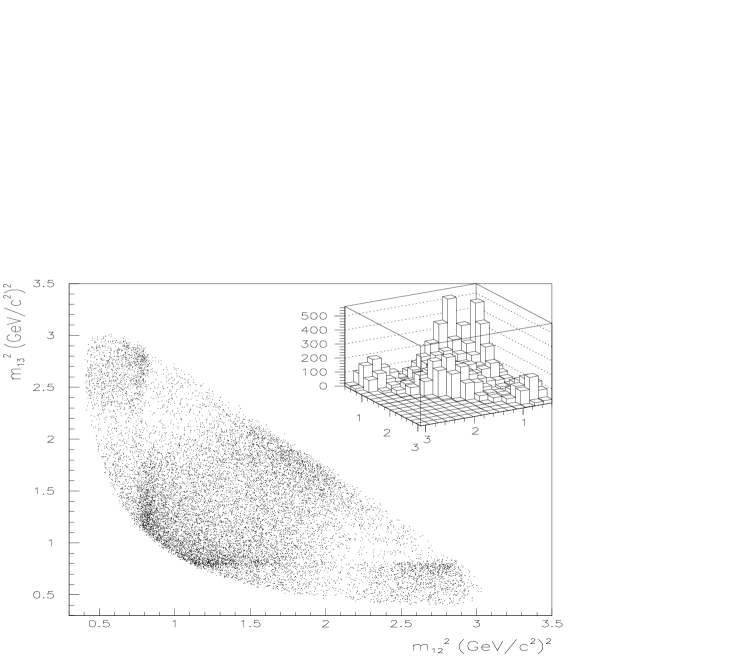
4 The Channel.
(a)

(b)
(c)
The Dalitz plot in figure 1(a) shows clear bands in the regions with an asymmetric structure indicative of interference with a significant, underlying -wave. An accumulation of events near 2 (GeV/c indicates contributions from or . A fit is made including isobar amplitudes for these resonances and the , each with mass and width fixed at their PDG values. Results are shown in table 1 (model I) and compared with the mass projections in figures 1(b) and (c). As in previous analyses using this model, a large NR component is required (%) and the sum of all contributions is % indicating much destructive interference.
| I | - | |||||
|---|---|---|---|---|---|---|
| II | ||||||
| III | - | |||||
| IV | ||||||
The fit is poor with a , found by comparing predictions of model I with data in equal square bins in the Dalitz plot, of 167 for 63 degrees of freedom . Major discrepancies are at low masses, and the corresponding high mass reflection, and can be seen in earlier data for both this channel and for . However the large E791 sample underlines their significance, and demands that a better model be found.
First, the radii , and the mass and width of are allowed to float . This produces little improvement. Next, a further scalar amplitude “ having a Breit Wigner form similar to is added (model II in Table 1). This does provide an excellent description of the data with . The mode is dominant while the NR component is consistent with zero. The sum of fractions is %. The mass and width, determined from the fit, are and MeV/c2. In this model, however, the mass and width are found to be MeV/c2 and MeV/c2 respectively, differing somewhat from the values from LASS .
The -wave BW form used for the in model II appears to be important. Variations in this, or in form factors for and NR terms, are found to affect principally the amounts of and NR, but to have relatively small effects on mass and width parameters. Replacing the complex BW in model II by its absolute magnitude (a “” mass enhancement, but no phase variation) results in unphysically large and NR fractions. A vector form for converges with mass MeV/c2 and negligible fraction. A tensor fit fails to converge.
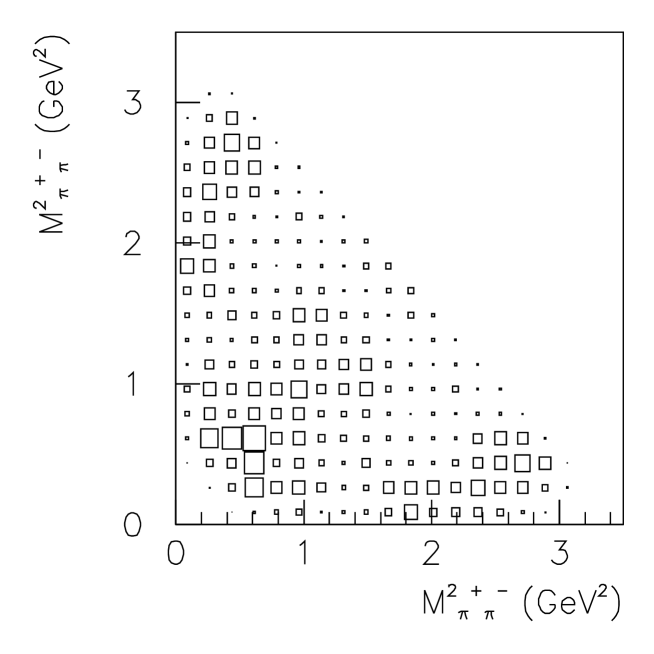
5 Decays.
Figure 2(a) is the Dalitz plot for these decays . Table 1 shows results for model III in which only resonances from the PDG are included. The fit is poor (), especially in the low mass system as seen in figure 2(b). The contribution from is larger than that from - a somewhat unlikely result. As observed in the previous analysis of this channel with a similar model, the NR mode dominates.
(a)

(b)
Adding a scalar amplitude (, similar to the in model II) results in a superior fit (). Results for this (model IV) are in table 1. Mass and width for are found to be and MeV/c2. Both NR and contributions are insignificant, and the amplitude is dominant. As for the , the -wave BW form seems to be the best model of those applied to these data.
6 Conclusions.
We conclude that the -wave system from decay of to has amplitude and phase variation consistent with a sum of NR, and scalar terms. Similarly, the -wave system from decay of has amplitude and phase variation consistent with a sum of NR, and scalar terms. Though this hints at the existence of scalar and resonances, use of Breit Wigner functions to describe such broad states near threshold may not be appropriate, and other interpretations of the data may be possible.
References
References
- [1] K. Hagiwara et al., Phys. Rev. D 66, 010001 (2002).
- [2] E691 collaboration, J. C. Anjos et al., Phys. Rev. D 48, 56 (1993).
- [3] E687 collaboration, P. L. Frabetti et al., Phys. Lett. B 331, 217 (1994).
- [4] E791 collaboration, E. M. Aitala et al., Phys. Rev. Lett. 86, 770 (2000).
- [5] E791 collaboration, E. M. Aitala et al., accepted by Phys. Rev. Letters, hep-ex/0204018.
- [6] E791 collaboration, E. M. Aitala et al., Eur. Phys. J. direct C4, 1 (1999).
- [7] S. Amato et al., Nucl. Instrum. Methods A324, 535 (1993); S. Bracker et al., hep-ex/9511009.
- [8] CLEO collaboration, S. Kopp et al., Phys. Rev. D 63, 092001 (2001).
- [9] W. M. Dunwoodie (for LASS collaboration), private communication. A recent re-fit to -wave elastic scattering data below threshold yields MeV/c2 compared to PDG values and MeV/c2 respectively.
- [10] E687 collaboration, P. L. Frabetti et al., Phys. Lett. B 407, 79 (1997).