BABAR-CONF-02/10
SLAC-PUB-9315
July 2002
Measurement of the Branching Fraction with Partially Reconstructed
The BABAR Collaboration
July 25, 2002
Abstract
The branching fraction has been measured with data collected by the BABAR experiment in 1999 and 2000 corresponding to a total integrated luminosity of . Signal events have been selected using a partial reconstruction technique, in which only the and the slow pion () from the decay are identified. A signal yield of events has been found, corresponding to a preliminary branching fraction of (stat) (syst).
Contributed to the 31st International Conference on High Energy Physics,
7/24—7/31/2002, Amsterdam, The Netherlands
Stanford Linear Accelerator Center, Stanford University, Stanford, CA 94309
Work supported in part by Department of Energy contract DE-AC03-76SF00515.
The BABAR Collaboration,
B. Aubert, D. Boutigny, J.-M. Gaillard, A. Hicheur, Y. Karyotakis, J. P. Lees, P. Robbe, V. Tisserand, A. Zghiche
Laboratoire de Physique des Particules, F-74941 Annecy-le-Vieux, France
A. Palano, A. Pompili
Università di Bari, Dipartimento di Fisica and INFN, I-70126 Bari, Italy
J. C. Chen, N. D. Qi, G. Rong, P. Wang, Y. S. Zhu
Institute of High Energy Physics, Beijing 100039, China
G. Eigen, I. Ofte, B. Stugu
University of Bergen, Inst. of Physics, N-5007 Bergen, Norway
G. S. Abrams, A. W. Borgland, A. B. Breon, D. N. Brown, J. Button-Shafer, R. N. Cahn, E. Charles, M. S. Gill, A. V. Gritsan, Y. Groysman, R. G. Jacobsen, R. W. Kadel, J. Kadyk, L. T. Kerth, Yu. G. Kolomensky, J. F. Kral, C. LeClerc, M. E. Levi, G. Lynch, L. M. Mir, P. J. Oddone, T. J. Orimoto, M. Pripstein, N. A. Roe, A. Romosan, M. T. Ronan, V. G. Shelkov, A. V. Telnov, W. A. Wenzel
Lawrence Berkeley National Laboratory and University of California, Berkeley, CA 94720, USA
T. J. Harrison, C. M. Hawkes, D. J. Knowles, S. W. O’Neale, R. C. Penny, A. T. Watson, N. K. Watson
University of Birmingham, Birmingham, B15 2TT, United Kingdom
T. Deppermann, K. Goetzen, H. Koch, B. Lewandowski, K. Peters, H. Schmuecker, M. Steinke
Ruhr Universität Bochum, Institut für Experimentalphysik 1, D-44780 Bochum, Germany
N. R. Barlow, W. Bhimji, J. T. Boyd, N. Chevalier, P. J. Clark, W. N. Cottingham, C. Mackay, F. F. Wilson
University of Bristol, Bristol BS8 1TL, United Kingdom
K. Abe, C. Hearty, T. S. Mattison, J. A. McKenna, D. Thiessen
University of British Columbia, Vancouver, BC, Canada V6T 1Z1
S. Jolly, A. K. McKemey
Brunel University, Uxbridge, Middlesex UB8 3PH, United Kingdom
V. E. Blinov, A. D. Bukin, A. R. Buzykaev, V. B. Golubev, V. N. Ivanchenko, A. A. Korol, E. A. Kravchenko, A. P. Onuchin, S. I. Serednyakov, Yu. I. Skovpen, A. N. Yushkov
Budker Institute of Nuclear Physics, Novosibirsk 630090, Russia
D. Best, M. Chao, D. Kirkby, A. J. Lankford, M. Mandelkern, S. McMahon, D. P. Stoker
University of California at Irvine, Irvine, CA 92697, USA
C. Buchanan, S. Chun
University of California at Los Angeles, Los Angeles, CA 90024, USA
H. K. Hadavand, E. J. Hill, D. B. MacFarlane, H. Paar, S. Prell, Sh. Rahatlou, G. Raven, U. Schwanke, V. Sharma
University of California at San Diego, La Jolla, CA 92093, USA
J. W. Berryhill, C. Campagnari, B. Dahmes, P. A. Hart, N. Kuznetsova, S. L. Levy, O. Long, A. Lu, M. A. Mazur, J. D. Richman, W. Verkerke
University of California at Santa Barbara, Santa Barbara, CA 93106, USA
J. Beringer, A. M. Eisner, M. Grothe, C. A. Heusch, W. S. Lockman, T. Pulliam, T. Schalk, R. E. Schmitz, B. A. Schumm, A. Seiden, M. Turri, W. Walkowiak, D. C. Williams, M. G. Wilson
University of California at Santa Cruz, Institute for Particle Physics, Santa Cruz, CA 95064, USA
E. Chen, G. P. Dubois-Felsmann, A. Dvoretskii, D. G. Hitlin, F. C. Porter, A. Ryd, A. Samuel, S. Yang
California Institute of Technology, Pasadena, CA 91125, USA
S. Jayatilleke, G. Mancinelli, B. T. Meadows, M. D. Sokoloff
University of Cincinnati, Cincinnati, OH 45221, USA
T. Barillari, P. Bloom, W. T. Ford, U. Nauenberg, A. Olivas, P. Rankin, J. Roy, J. G. Smith, W. C. van Hoek, L. Zhang
University of Colorado, Boulder, CO 80309, USA
J. L. Harton, T. Hu, M. Krishnamurthy, A. Soffer, W. H. Toki, R. J. Wilson, J. Zhang
Colorado State University, Fort Collins, CO 80523, USA
D. Altenburg, T. Brandt, J. Brose, T. Colberg, M. Dickopp, R. S. Dubitzky, A. Hauke, E. Maly, R. Müller-Pfefferkorn, S. Otto, K. R. Schubert, R. Schwierz, B. Spaan, L. Wilden
Technische Universität Dresden, Institut für Kern- und Teilchenphysik, D-01062 Dresden, Germany
D. Bernard, G. R. Bonneaud, F. Brochard, J. Cohen-Tanugi, S. Ferrag, S. T’Jampens, Ch. Thiebaux, G. Vasileiadis, M. Verderi
Ecole Polytechnique, LLR, F-91128 Palaiseau, France
A. Anjomshoaa, R. Bernet, A. Khan, D. Lavin, F. Muheim, S. Playfer, J. E. Swain, J. Tinslay
University of Edinburgh, Edinburgh EH9 3JZ, United Kingdom
M. Falbo
Elon University, Elon University, NC 27244-2010, USA
C. Borean, C. Bozzi, L. Piemontese, A. Sarti
Università di Ferrara, Dipartimento di Fisica and INFN, I-44100 Ferrara, Italy
E. Treadwell
Florida A&M University, Tallahassee, FL 32307, USA
F. Anulli,111 Also with Università di Perugia, I-06100 Perugia, Italy R. Baldini-Ferroli, A. Calcaterra, R. de Sangro, D. Falciai, G. Finocchiaro, P. Patteri, I. M. Peruzzi,11footnotemark: 1 M. Piccolo, A. Zallo
Laboratori Nazionali di Frascati dell’INFN, I-00044 Frascati, Italy
S. Bagnasco, A. Buzzo, R. Contri, G. Crosetti, M. Lo Vetere, M. Macri, M. R. Monge, S. Passaggio, F. C. Pastore, C. Patrignani, E. Robutti, A. Santroni, S. Tosi
Università di Genova, Dipartimento di Fisica and INFN, I-16146 Genova, Italy
S. Bailey, M. Morii
Harvard University, Cambridge, MA 02138, USA
R. Bartoldus, G. J. Grenier, U. Mallik
University of Iowa, Iowa City, IA 52242, USA
J. Cochran, H. B. Crawley, J. Lamsa, W. T. Meyer, E. I. Rosenberg, J. Yi
Iowa State University, Ames, IA 50011-3160, USA
M. Davier, G. Grosdidier, A. Höcker, H. M. Lacker, S. Laplace, F. Le Diberder, V. Lepeltier, A. M. Lutz, T. C. Petersen, S. Plaszczynski, M. H. Schune, L. Tantot, S. Trincaz-Duvoid, G. Wormser
Laboratoire de l’Accélérateur Linéaire, F-91898 Orsay, France
R. M. Bionta, V. Brigljević , D. J. Lange, K. van Bibber, D. M. Wright
Lawrence Livermore National Laboratory, Livermore, CA 94550, USA
A. J. Bevan, J. R. Fry, E. Gabathuler, R. Gamet, M. George, M. Kay, D. J. Payne, R. J. Sloane, C. Touramanis
University of Liverpool, Liverpool L69 3BX, United Kingdom
M. L. Aspinwall, D. A. Bowerman, P. D. Dauncey, U. Egede, I. Eschrich, G. W. Morton, J. A. Nash, P. Sanders, D. Smith, G. P. Taylor
University of London, Imperial College, London, SW7 2BW, United Kingdom
J. J. Back, G. Bellodi, P. Dixon, P. F. Harrison, R. J. L. Potter, H. W. Shorthouse, P. Strother, P. B. Vidal
Queen Mary, University of London, E1 4NS, United Kingdom
G. Cowan, H. U. Flaecher, S. George, M. G. Green, A. Kurup, C. E. Marker, T. R. McMahon, S. Ricciardi, F. Salvatore, G. Vaitsas, M. A. Winter
University of London, Royal Holloway and Bedford New College, Egham, Surrey TW20 0EX, United Kingdom
D. Brown, C. L. Davis
University of Louisville, Louisville, KY 40292, USA
J. Allison, R. J. Barlow, A. C. Forti, F. Jackson, G. D. Lafferty, A. J. Lyon, N. Savvas, J. H. Weatherall, J. C. Williams
University of Manchester, Manchester M13 9PL, United Kingdom
A. Farbin, A. Jawahery, V. Lillard, D. A. Roberts, J. R. Schieck
University of Maryland, College Park, MD 20742, USA
G. Blaylock, C. Dallapiccola, K. T. Flood, S. S. Hertzbach, R. Kofler, V. B. Koptchev, T. B. Moore, H. Staengle, S. Willocq
University of Massachusetts, Amherst, MA 01003, USA
B. Brau, R. Cowan, G. Sciolla, F. Taylor, R. K. Yamamoto
Massachusetts Institute of Technology, Laboratory for Nuclear Science, Cambridge, MA 02139, USA
M. Milek, P. M. Patel
McGill University, Montréal, QC, Canada H3A 2T8
F. Palombo
Università di Milano, Dipartimento di Fisica and INFN, I-20133 Milano, Italy
J. M. Bauer, L. Cremaldi, V. Eschenburg, R. Kroeger, J. Reidy, D. A. Sanders, D. J. Summers
University of Mississippi, University, MS 38677, USA
C. Hast, P. Taras
Université de Montréal, Laboratoire René J. A. Lévesque, Montréal, QC, Canada H3C 3J7
H. Nicholson
Mount Holyoke College, South Hadley, MA 01075, USA
C. Cartaro, N. Cavallo, G. De Nardo, F. Fabozzi, C. Gatto, L. Lista, P. Paolucci, D. Piccolo, C. Sciacca
Università di Napoli Federico II, Dipartimento di Scienze Fisiche and INFN, I-80126, Napoli, Italy
J. M. LoSecco
University of Notre Dame, Notre Dame, IN 46556, USA
J. R. G. Alsmiller, T. A. Gabriel
Oak Ridge National Laboratory, Oak Ridge, TN 37831, USA
J. Brau, R. Frey, M. Iwasaki, C. T. Potter, N. B. Sinev, D. Strom, E. Torrence
University of Oregon, Eugene, OR 97403, USA
F. Colecchia, A. Dorigo, F. Galeazzi, M. Margoni, M. Morandin, M. Posocco, M. Rotondo, F. Simonetto, R. Stroili, C. Voci
Università di Padova, Dipartimento di Fisica and INFN, I-35131 Padova, Italy
M. Benayoun, H. Briand, J. Chauveau, P. David, Ch. de la Vaissière, L. Del Buono, O. Hamon, Ph. Leruste, J. Ocariz, M. Pivk, L. Roos, J. Stark
Universités Paris VI et VII, Lab de Physique Nucléaire H. E., F-75252 Paris, France
P. F. Manfredi, V. Re, V. Speziali
Università di Pavia, Dipartimento di Elettronica and INFN, I-27100 Pavia, Italy
L. Gladney, Q. H. Guo, J. Panetta
University of Pennsylvania, Philadelphia, PA 19104, USA
C. Angelini, G. Batignani, S. Bettarini, M. Bondioli, F. Bucci, G. Calderini, E. Campagna, M. Carpinelli, F. Forti, M. A. Giorgi, A. Lusiani, G. Marchiori, F. Martinez-Vidal, M. Morganti, N. Neri, E. Paoloni, M. Rama, G. Rizzo, F. Sandrelli, G. Triggiani, J. Walsh
Università di Pisa, Scuola Normale Superiore and INFN, I-56010 Pisa, Italy
M. Haire, D. Judd, K. Paick, L. Turnbull, D. E. Wagoner
Prairie View A&M University, Prairie View, TX 77446, USA
J. Albert, G. Cavoto,222 Also with Università di Roma La Sapienza, Roma, Italy N. Danielson, P. Elmer, C. Lu, V. Miftakov, J. Olsen, S. F. Schaffner, A. J. S. Smith, A. Tumanov, E. W. Varnes
Princeton University, Princeton, NJ 08544, USA
F. Bellini, D. del Re, R. Faccini,333 Also with University of California at San Diego, La Jolla, CA 92093, USA F. Ferrarotto, F. Ferroni, E. Leonardi, M. A. Mazzoni, S. Morganti, G. Piredda, F. Safai Tehrani, M. Serra, C. Voena
Università di Roma La Sapienza, Dipartimento di Fisica and INFN, I-00185 Roma, Italy
S. Christ, G. Wagner, R. Waldi
Universität Rostock, D-18051 Rostock, Germany
T. Adye, N. De Groot, B. Franek, N. I. Geddes, G. P. Gopal, S. M. Xella
Rutherford Appleton Laboratory, Chilton, Didcot, Oxon, OX11 0QX, United Kingdom
R. Aleksan, S. Emery, A. Gaidot, P.-F. Giraud, G. Hamel de Monchenault, W. Kozanecki, M. Langer, G. W. London, B. Mayer, G. Schott, B. Serfass, G. Vasseur, Ch. Yeche, M. Zito
DAPNIA, Commissariat à l’Energie Atomique/Saclay, F-91191 Gif-sur-Yvette, France
M. V. Purohit, A. W. Weidemann, F. X. Yumiceva
University of South Carolina, Columbia, SC 29208, USA
I. Adam, D. Aston, N. Berger, A. M. Boyarski, M. R. Convery, D. P. Coupal, D. Dong, J. Dorfan, W. Dunwoodie, R. C. Field, T. Glanzman, S. J. Gowdy, E. Grauges , T. Haas, T. Hadig, V. Halyo, T. Himel, T. Hryn’ova, M. E. Huffer, W. R. Innes, C. P. Jessop, M. H. Kelsey, P. Kim, M. L. Kocian, U. Langenegger, D. W. G. S. Leith, S. Luitz, V. Luth, H. L. Lynch, H. Marsiske, S. Menke, R. Messner, D. R. Muller, C. P. O’Grady, V. E. Ozcan, A. Perazzo, M. Perl, S. Petrak, H. Quinn, B. N. Ratcliff, S. H. Robertson, A. Roodman, A. A. Salnikov, T. Schietinger, R. H. Schindler, J. Schwiening, G. Simi, A. Snyder, A. Soha, S. M. Spanier, J. Stelzer, D. Su, M. K. Sullivan, H. A. Tanaka, J. Va’vra, S. R. Wagner, M. Weaver, A. J. R. Weinstein, W. J. Wisniewski, D. H. Wright, C. C. Young
Stanford Linear Accelerator Center, Stanford, CA 94309, USA
P. R. Burchat, C. H. Cheng, T. I. Meyer, C. Roat
Stanford University, Stanford, CA 94305-4060, USA
R. Henderson
TRIUMF, Vancouver, BC, Canada V6T 2A3
W. Bugg, H. Cohn
University of Tennessee, Knoxville, TN 37996, USA
J. M. Izen, I. Kitayama, X. C. Lou
University of Texas at Dallas, Richardson, TX 75083, USA
F. Bianchi, M. Bona, D. Gamba
Università di Torino, Dipartimento di Fisica Sperimentale and INFN, I-10125 Torino, Italy
L. Bosisio, G. Della Ricca, S. Dittongo, L. Lanceri, P. Poropat, L. Vitale, G. Vuagnin
Università di Trieste, Dipartimento di Fisica and INFN, I-34127 Trieste, Italy
R. S. Panvini
Vanderbilt University, Nashville, TN 37235, USA
S. W. Banerjee, C. M. Brown, D. Fortin, P. D. Jackson, R. Kowalewski, J. M. Roney
University of Victoria, Victoria, BC, Canada V8W 3P6
H. R. Band, S. Dasu, M. Datta, A. M. Eichenbaum, H. Hu, J. R. Johnson, R. Liu, F. Di Lodovico, A. Mohapatra, Y. Pan, R. Prepost, I. J. Scott, S. J. Sekula, J. H. von Wimmersperg-Toeller, J. Wu, S. L. Wu, Z. Yu
University of Wisconsin, Madison, WI 53706, USA
H. Neal
Yale University, New Haven, CT 06511, USA
1 Introduction
A partial reconstruction technique has been used in the past to select large samples of reconstructed mesons with a in the final state [1] and to measure properties of the meson. In this method the is not reconstructed, but its four-momentum is inferred from the kinematics of the , the slow pion () from decay and the decay constraints. The measurement of the branching fraction for is performed as a first step in demonstrating that the partial reconstruction method may offer a means of determining the combination of Cabibbo-Kobayashi-Maskawa[2] unitarity triangle angles using this channel111Since the selection of and are identical, the charge conjugate state is implied throughout the paper..
2 The BABAR detector
The BABAR experiment is located at the PEP-II storage ring at the Stanford Linear Accelerator Center. A detailed description of the detector and of the algorithms used for the track reconstruction and selection of events can be found in Ref. [3]. For the partial reconstruction analysis of only charged tracks are used: particles with transverse momentum MeV/c are reconstructed by matching hits in the Silicon Vertex Tracker (SVT) with track segments in the Drift Chamber (DCH). Tracks with lower do not penetrate a significant distance in the DCH and are reconstructed using only the information from the SVT.
Electron, muon and kaon identification is used in the analysis as a veto in the selection of pions forming the candidates. Electron candidates are identified by the ratio of the energy deposited in the electromagnetic calorimeter (EMC) to the track momentum () and by the energy loss in the DCH (). Muons are primarily identified by the measured number of hadronic interaction lengths traversed from the outside radius of the DCH through the iron of the instrumented flux return (IFR). Kaons are distinguished from pions and protons on the basis of in the SVT and DCH, and the number of Cherenkov photons and the Cherenkov angle in the Detector for Internally Reflected Cherenkov radiation (DIRC).
3 Data sample
The data used in this analysis were collected with the BABAR detector in 1999 and 2000. These data correspond to an integrated luminosity of recorded at the resonance and, for background studies, collected at 40 MeV below the resonance (“off-resonance” sample). Monte Carlo samples of and continuum events were reconstructed and analyzed using the same procedure as the data. The equivalent luminosity of the generic simulated data is approximately one fourth of the on-resonance data, while the number of signal Monte Carlo (MC) events is approximately ten times the number expected in the on-resonance data.
4 The partial reconstruction technique
In the partial reconstruction of the decay chain , followed by , only the and the from decay are required. For this analysis the is reconstructed via the decay chain . The angle between the momentum vectors of the and the in the center-of-mass frame (CM) is then computed:
| (1) |
where is the mass of particle x, and are the measured CM energy and momentum of the , is the total CM energy of the beams and . Given and the measured four-momenta of the and the , the four-momentum can be calculated up to an unknown azimuthal angle around . For every value of , the expected four-momentum, , is determined from four-momentum conservation and the -dependent “missing mass” is calculated, . Defining and to be the minimum and maximum values of obtained by varying over the allowed range, the missing mass is calculated as . For signal events, this variable peaks at the mass, while for background events it has a broader distribution. For this reason, can be used to determine the fractions of signal and background events in the data sample.
5 Event selection
Data and Monte Carlo events are first selected with the following loose requirements:
-
, the ratio of the 2nd to the 0th Fox Wolfram moments [4], less than 0.35;
-
at least one candidate222By we refer to the final state. such that:
-
-
the invariant mass is between and GeV/c2;
-
-
the momentum , computed in the CM frame, is between and GeV/c;
-
-
the vertex probability obtained from a vertex fit of the 3 pions is greater than 1%;
-
-
the invariant mass of at least one of the two possible combinations () is in the range [0.278, 1.122] GeV/c2;
-
-
-
at least one additional track (the ) with CM momentum between and MeV/c;
-
for each selected candidate, there must be at least 2 additional particles (charged or neutral).
The fraction of events selected by applying these cuts is summarized in Table 1 for signal and background MC samples and for off-resonance data.
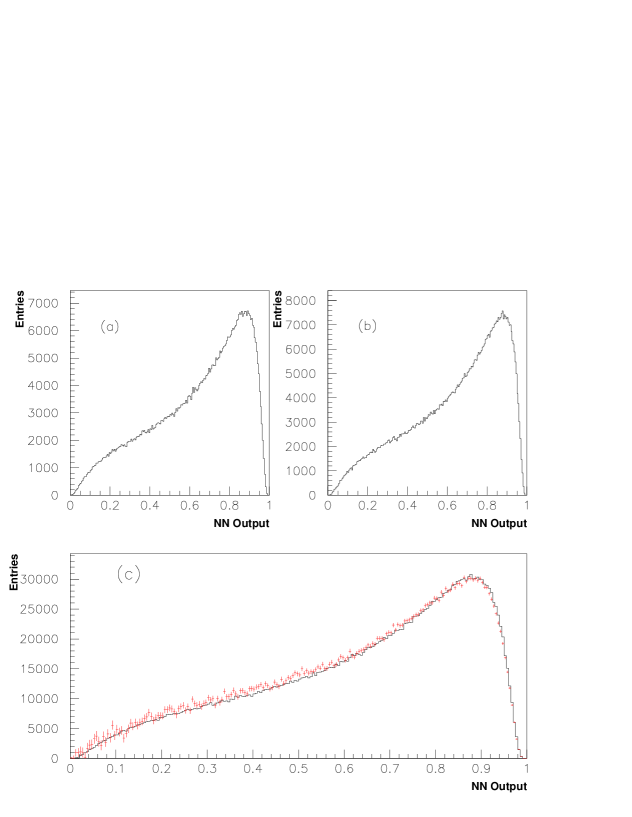
The main source of background in this analysis is continuum events, where . A neural network is used to optimize the separation of events from the continuum background, independent of any particular decay channel. The NN has three layers, with 11 input nodes, 15 hidden nodes and one output. Its definition relies on the different topologies of signal and background at the : while events are more “spherical”, events are more “jet-like”. The variables used to discriminate jet-like from isotropic events are ; the thrust of the event [4]; the two invariant masses squared, obtained by adding the four momenta of all particles going into each of the hemispheres divided by the plane perpendicular to the thrust axis; and the angle of the thrust axis with respect to the direction.
The signal to background separation becomes more complicated when one or more gluons are emitted, which is more likely to happen when light quarks are produced. In this case there are multiple preferred axes, so that the event shape more closely resembles that of the signal. To discriminate further between signal and background in this case, the tracks are clustered into 3 or 4 jets using the so called “Durham” algorithm [5, 6].
The event is first clustered into four jets and the following discriminating variables are added to those previously defined in order to build up the network: , the jet metric [5, 6] obtained when the event is clustered in 4 jets; the QCD matrix element [7]; the cosine of the maximum angle between each pair of jets; the angle between the plane defined by the two most energetic jets and that defined by the other two jets; and the angle between the lowest and second lowest energy jet. The event is then further clustered into 3 jets and the jet metric is also added to the list of network input variables.
The distributions of MC events and on-resonance data that pass the event selection criteria are shown in Fig. 1. The on-resonance distribution is shown after the subtraction of the off-resonance distribution, scaled by the ratio of the on-resonance to off-resonance luminosities and the CM energy squared. By selecting events for which the NN output () is greater than 0.25, 66% of the continuum events are rejected. The fractions of events selected by this requirement in the various analyzed samples are shown in Table 1.
After the NN cut, further selection requirements are applied. There must be at least one combination with net charge equal 0; the three pion invariant mass must be in the range [1.0, 1.45] GeV/c2; the three pion momentum in the CM frame must be in the range [1.9, 2.25] GeV/c; at least one combination from the three daughters of the must have invariant mass in the range [0.65, 0.9] GeV/c2; and the vertex probability of the 3 plus the must be greater than 3%.
The fractions of events selected by these requirements are summarized in Table 1.
| Cuts applied | ||||
|---|---|---|---|---|
| (no signal) | MC | |||
| Reconstruction Efficiency | 38.3% | 14.6% | 13.9% | 6.4% |
| 85.4% | 91.9% | 92.1% | 45.2% | |
| 94.2% | 86.7% | 85.2% | 83.5% | |
| GeV/ | 81.7% | 71.8% | 71.7% | 73.6% |
| GeV/c | 94.8% | 92.4% | 92.5% | 93.3% |
| GeV/ | 76.4% | 59.1% | 60.5% | 64.3% |
| Vertex Prob | 80.0% | 74.2% | 73.9% | 76.9% |
| Total Efficiency | 14.6% | 3.4% | 3.2% | 0.82% |
6 Results
Applying all of the selection criteria, the distribution of on-resonance and off-resonance data is obtained for “right-sign”events, which are events where the and candidates have opposite electrical charges. The off-resonance distribution is then scaled to take into account the difference in luminosities and CM energies between the two samples and subtracted bin-by-bin from the on-resonance distribution. The resulting plot is fitted, using a minimum technique, to a linear combination of the distributions of:
-
1.
Monte Carlo events, excluding correctly reconstructed signal events; and
-
2.
correctly reconstructed signal Monte Carlo events.
In Fig. 2(a) the distribution of “right-sign” on-resonance data, off-resonance subtracted, is shown, together with the distributions of background MC and signal MC events. The signal yield that is obtained is events. The contribution to the fit is of the value expected, given the total number of events in the data and in the Monte Carlo simulation.
Given this yield, the branching fraction333In this analysis it is assumed that , based on isospin considerations and phase space corrections., the total signal efficiency of Table 1 and the fraction of events with multiple signal candidates, the following preliminary result for the branching fraction is obtained:
| (2) |
where the error is statistical only. The result is in very good agreement with the current best measurement of ()% [8, 9, 10, 11].
Several tests were conducted to verify that the background shapes in data and MC agree and do not give rise to a spurious signal. Charged candidates were combined with tracks of the same charge into “wrong-sign” combinations, and were analyzed in the same way as “right-sign” combinations. The distribution of these candidates, shown in Fig. 2(b), shows a good agreement between data and MC in the signal region ( GeV/c2). The contribution to the fit is of the value expected from MC simulation.
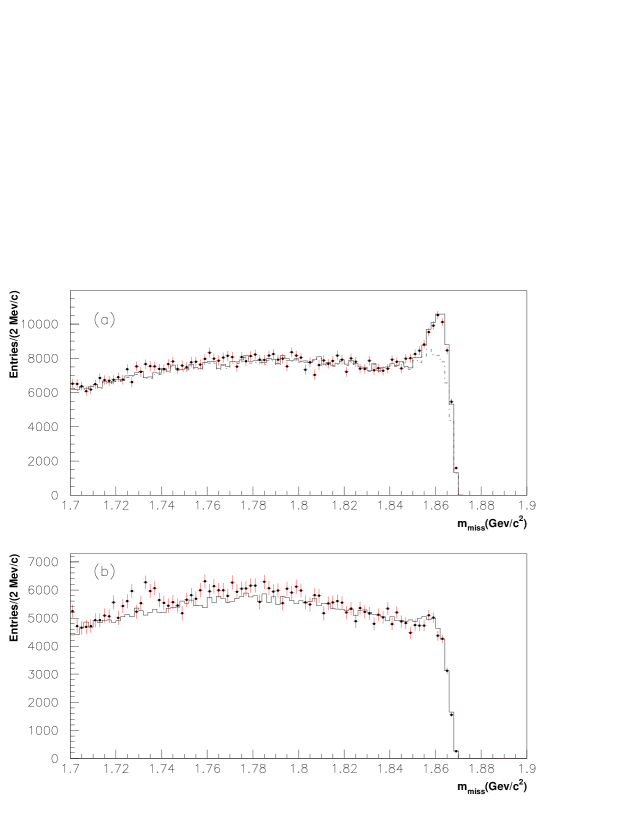
Among events collected on-resonance, the fraction containing more than one combination that passes all the analysis requirements in the signal region, defined by GeV/c2, is %. This agrees with the fraction % obtained from a weighted mix of off-resonance, and signal MC events. It was verified that the reconstruction efficiency in MC and off-resonance data are in good agreement.
7 Systematic errors
The selection criteria applied in the analysis are varied within a reasonable range around their chosen values. The branching fraction and its error are recalculated for each value, obtaining different measurements for different choices of the requirement [12]. The variation of the results with respect to their average, taking into account statistical correlations between them [13], is taken as a systematic error. The method of Ref. [14] is used in order to disentangle the statistical fluctuations from the systematic ones.
The final contributions to the error on the branching ratio due to the variation of the selection requirements are shown in Table 2. It has been verified that the systematic error obtained for each requirement does not depend on the variation studied.
| Cut applied | Range Studied | N | Error (%) | |
|---|---|---|---|---|
| 0.15 to 0.35 | 1.37 | 5 | 4.2 | |
| 1.0 GeV/ | ||||
| 1.4 to 1.5 GeV/ | 0.99 | 5 | negl. | |
| 1.85 to 1.95 GeV/ | ||||
| 2.15 to 2.25 GeV/ | 1.96 | 5 | 6.6 | |
| Vertex Prob | 0.01 to 0.15 | 1.15 | 5 | 2.4 |
| Vertex Prob | 0.01 to 0.1 | 1.10 | 5 | 2.2 |
| 0.65 to 0.75 GeV/ | ||||
| 0.8 to 0.9GeV/ | 1.45 | 5 | 4.6 | |
| Total error | 9.6 |
A conservative systematic error of 0.35% is determined from MC due to the dependence of the reconstruction efficiency on the momentum. The systematic error due to track reconstruction efficiency is 4.2% and the uncertainty in the total number of mesons in the data sample is 1.6%.
The background has a component that peaks slightly under the signal region (Fig. 2). This is due mostly to signal events in which one or more of the selected tracks did not originate from the signal . The contribution of this background is varied in the MC by , i.e., by the relative statistical error in the central value of the branching fraction plus the total relative systematic error calculated up to this point, added in quadrature. This results in a 4.5% variation of the signal yield, which is added to the total systematic error. The total systematic error is 11.5%.
Other possible sources of systematic error have been investigated. The non-resonant decay channel could contribute to the quoted branching fraction. The measured branching fraction for this mode is [8, 10]. Since the central value is inconsistent with the total , this channel is ignored in our fit. As a result, there is a potential contribution from this channel that is included in the quoted branching fraction for . The central value will shift according to the branching fraction for at a rate of .
Likewise, the decay could affect the signal yield444 denotes the sum of , and states.. To study its effect, MC events are added to the generic sample at the level of [15], and the fit to the missing mass distribution is repeated. This results in a reduction of the signal yield of 4.3%. Since the has not yet been measured, based on this result the branching fraction obtained in this analysis will be shifted by contributions from at a rate of .
8 Conclusions
With a partial reconstruction technique, events have been found in the BABAR data set of on-resonance events. This corresponds to the branching fraction
| (3) |
where the first error is statistical and the second is systematic. Due to the uncertainty in the contribution of events in the signal sample, the central value of the quoted branching fraction will shift according to the branching fraction for at a rate of . Likewise, due to the unknown value of the central value of the branching fraction will be shifted by contributions from events at a rate of . The result is in good agreement with the current world average value of ()% [8, 9, 10, 11] but reduces the uncertainty by a factor of two.
9 Acknowledgments
We are grateful for the extraordinary contributions of our PEP-II colleagues in achieving the excellent luminosity and machine conditions that have made this work possible. The success of this project also relies critically on the expertise and dedication of the computing organizations that support BABAR. The collaborating institutions wish to thank SLAC for its support and the kind hospitality extended to them. This work is supported by the US Department of Energy and National Science Foundation, the Natural Sciences and Engineering Research Council (Canada), Institute of High Energy Physics (China), the Commissariat à l’Energie Atomique and Institut National de Physique Nucléaire et de Physique des Particules (France), the Bundesministerium für Bildung und Forschung and Deutsche Forschungsgemeinschaft (Germany), the Istituto Nazionale di Fisica Nucleare (Italy), the Research Council of Norway, the Ministry of Science and Technology of the Russian Federation, and the Particle Physics and Astronomy Research Council (United Kingdom). Individuals have received support from the A. P. Sloan Foundation, the Research Corporation, and the Alexander von Humboldt Foundation.
References
- [1] The CLEO Collaboration, G. Brandenburg et al., Phys. Rev. Lett. 80, 2762 (1998); The BABAR Collaboration, B. Aubert et al., hep-ex/0202005 (2002) (to be published in Phys. Rev. Lett.); The BABAR Collaboration, B. Aubert et al., hep-ex/0203036 (2002); The BABAR Collaboration, B. Aubert et al., hep-ex/0203038 (2002).
- [2] N. Cabibbo, Phys. Rev. Lett. 10, 531 (1963); M. Kobayashi and T. Maskawa, Prog. Theoret. Phys. 49, 652 (1973).
- [3] The BABAR Collaboration, B. Aubert et al., Nucl. Instrum. and Methods A479, 1 (2002).
- [4] P.F. Harrison and H.R. Quinn (ed.), The BABAR Physics Book, 1998, Chap. 7.6, and references therein.
- [5] S. Catani et al., Phys. Lett. B269, 432 (1991); N. Brown and W.J. Stirling, Zeit. fur Phys. C53, 629 (1992); S. Bethke et al., Nucl. Phys. B370, 310 (1992).
- [6] F. Salvatore and G. Cowan, J. Phys. G; Nucl. Part. Phys., 27, 1356 (2001).
- [7] The ALEPH Collaboration, Physics Reports 294, 1 (1998).
- [8] Particle Data Group, K. Hagiwara et al., Phys. Rev. D66, 010001 (2002).
- [9] The ARGUS Collaboration, Zeit. fur Phys. C48, 543 (1990).
- [10] The CLEO Collaboration, M.S. Alam et al., Phys. Rev. D45, 21 (1992).
- [11] The CLEO Collaboration, M.S. Alam et al., Phys. Rev. D50, 43 (1994).
- [12] M. Schmelling, Private Comunication.
- [13] G. Cowan, Statistical Data Analysis, Oxford Science Publications (1998), Chap. 7.
- [14] Particle Data Group, K. Hagiwara et al., Phys. Rev. D66, 010001 (2002), Section 4.2.
- [15] The CLEO Collaboration, S. Ahmed et al., hep-ex/0008015 (2000).