with 45 Million Pairs at Belle***Talk presented at Flavor Physics and Violation (FPCP), Philadelphia, U.S.A., May 16-18, 2002.
Masashi Hazumi
Institute of Particle and Nuclear Studies
High Energy Accelerator Research Organization (KEK)
1-1 Oho, Tsukuba-shi, Ibaraki-kun 305-0801, Japan
Abstract
We present an improved measurement of the standard model violation parameter (also known as ) based on a sample of pairs collected at the resonance with the Belle detector at the KEKB asymmetric-energy collider. One neutral meson is reconstructed in a , , , , , or -eigenstate decay channel and the flavor of accompanying meson is identified from its decay products. From the asymmetry in the distribution of the time intervals between the two meson decay points, we obtain .
In the Standard Model (SM), violation arises from an irreducible complex phase in the weak interaction quark-mixing matrix (CKM matrix) [1]. In particular, the SM predicts a -violating asymmetry in the time-dependent rates for and decays to a common eigenstate, , with negligible corrections from strong interactions[2]:
| (1) |
where is the decay rate for a or to dominated by a transition at a proper time after production, is the eigenvalue of , is the mass difference between the two mass eigenstates, and is one of the three interior angles of the CKM unitarity triangle, defined as . Non-zero values for were reported by the Belle and BaBar groups[3, 4].
Belle’s published measurement of is based on a 29.1 fb-1 data sample containing pairs produced at the resonance. In this paper, we report an improved measurement that uses pairs (42 fb-1). The data were collected with the Belle detector [5] at the KEKB asymmetric collider [6], which collides 8.0 GeV on 3.5 GeV at a small ( mrad) crossing angle. We use events where one of the mesons decays to at time , and the other decays to a self-tagging state, , i.e., a final state that distinguishes and , at time . The violation manifests itself as an asymmetry , where is the proper time interval between the two decays: . At KEKB, the resonance is produced with a boost of nearly along the electron beam direction ( direction), and can be determined as , where is the distance between the and decay vertices, . The average value is approximately 200 m.
The Belle detector [5] is a large-solid-angle spectrometer that consists of a silicon vertex detector (SVD), a central drift chamber (CDC), an array of aerogel threshold Čerenkov counters (ACC), time-of-flight scintillation counters (TOF), and an electromagnetic calorimeter comprised of CsI(Tl) crystals (ECL) located inside a superconducting solenoid coil that provides a 1.5 T magnetic field. An iron flux-return located outside of the coil is instrumented to detect mesons and to identify muons (KLM).
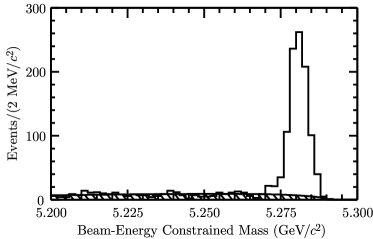
We reconstruct decays to the following eigenstates †††Throughout this paper, when a decay mode is quoted, the inclusion of the charge conjugation mode is implied. , , , for and for = +1. We also use decays where . Here the final state is a mixture of even and odd , depending on the relative orbital angular momentum of the and . We find that the final state is primarily ; the fraction is [7]. For reconstructed candidates other than , we identify decays using the energy difference and the beam-energy constrained mass , where is the beam energy in the center-of-mass system (cms), and and are the cms energy and momentum of the reconstructed candidate, respectively. Figure 1 (left) shows the distributions for all candidates except for that have values in the signal region.
| Mode | ||
|---|---|---|
| 636 | 31.2 | |
| 102 | 20.8 | |
| 49 | 2.4 | |
| 57 | 4.3 | |
| 34 | 2.3 | |
| 39 | 11.1 | |
| 33 | 8.9 | |
| 55 | 6.0 | |
| 767 | 307 |
Table 1 lists the numbers of observed candidates ().
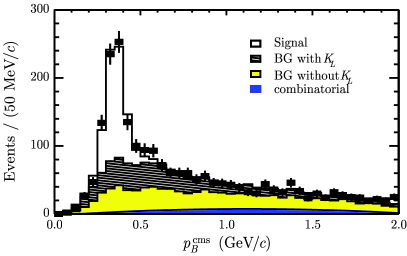
Candidate decays are selected by requiring ECL and/or KLM hit patterns that are consistent with the presence of a shower induced by a neutral hadron. The centroid of the shower is required to be in a cone centered on the direction that is inferred from two-body decay kinematics and the measured four-momentum of the . Figure 1 (right) shows the distribution, calculated with the two-body decay hypothesis. The histograms are the results of a fit to the signal and background distributions. There are 767 entries in total in the GeV/ signal region ‡‡‡When the is identified with the ECL only, the signal region is defined to be GeV/.; the fit indicates a signal purity of 60%. The reconstruction and selection criteria for all of channels used in the measurement are described in more detail elsewhere [3].
Leptons, charged pions, kaons, and baryons that are not associated with a reconstructed eigenstate decay are used to identify the -flavor of the accompanying meson: high momentum leptons from ; lower momentum leptons from ; charged kaons and baryons from ; fast pions from (, etc.); and slow pions from . Based on the measured properties of these tracks, two parameters, and , are assigned to an event. The first, , has the discrete values that is when is likely to be a (), and the parameter is an event-by-event Monte-Carlo-determined flavor-tagging dilution factor that ranges from for no flavor discrimination to for an unambiguous flavor assignment. It is used only to sort data into six intervals of , according to flavor purity; the wrong-tag probabilities, , that are used in the final fit are determined directly from data. Samples of decays to exclusively reconstructed self-tagged channels are utilized to obtain using time-dependent - mixing oscillation: , where and are the numbers of opposite and same flavor events. The total effective tagging efficiency is determined to be , where is the event fraction for each interval.
The vertex position for the decay is reconstructed using leptons from decays or kaons and pions from and that for is obtained with well reconstructed tracks that are not assigned to . Tracks that are consistent with coming from a decay are not used. Each vertex position is required to be consistent with a run-by-run-determined interaction region profile that is smeared in the - plane by the meson decay length. With these requirements, we are able to determine a vertex even with a single track; the fraction of single-track vertices is about 10% for and 30% for . The proper-time interval resolution function, , is formed by convolving four components: the detector resolutions for and , the shift in the vertex position due to secondary tracks originating from charmed particle decays, and smearing due to the kinematic approximation used to convert to . A small component of broad outliers in the distribution, caused by mis-reconstruction, is represented by a Gaussian function. We determine ten resolution parameters from the data from fits to the neutral and charged meson lifetimes [8] and obtain an average resolution of ps (rms). The width of the outlier component is determined to be ps; the fractional areas are and for the multiple- and single-track cases, respectively.
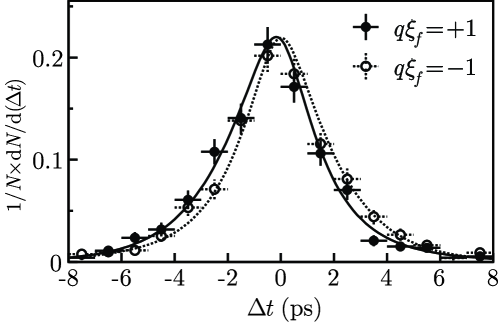
After flavor tagging and vertexing, we find 766 events with flavor tags and 784 events with . Figure 2 shows the observed distributions for the (solid points) and (open points) event samples. The asymmetry between the two distributions demonstrates the violation of symmetry.
We determine from an unbinned maximum-likelihood fit to the observed distributions. The probability density function (pdf) expected for the signal distribution is given by
| (2) |
where we fix the lifetime () and mass difference at their world average values[9]. Each pdf is convolved with the appropriate to determine the likelihood value for each event as a function of :
| (3) | |||||
where is the signal probability calculated as a function of for and of and for other modes. is the pdf for combinatorial background events, which is modeled as a sum of exponential and prompt components. It is convolved with a sum of two Gaussians, , which is regarded as a resolution function for the background. To account for a small number of events that give large in both the signal and background, we introduce the pdf, , and the fractional area, , of the outlier component. The only free parameter in the final fit is , which is determined by maximizing the likelihood function , where the product is over all events. The result of the fit is
The sources of the systematic error are listed in Table 2. The systematic error is dominated by uncertainties in the vertex reconstruction. Other significant contributions come from uncertainties in the wrong tag fractions, the resolution function parameters and the background fraction.
| source | error | error |
|---|---|---|
| vertex reconstruction | +0.030 | 0.030 |
| wrong tag fraction | +0.024 | 0.026 |
| resolution function | +0.022 | 0.019 |
| background fraction () | +0.014 | 0.015 |
| background fraction (except for ) | +0.007 | 0.006 |
| and | +0.007 | 0.006 |
| total | +0.048 | 0.048 |
A number of checks on the measurement are performed. Table 3 lists the results obtained by applying the same analysis to various subsamples.
| Sample | |
|---|---|
| except | |
| All |
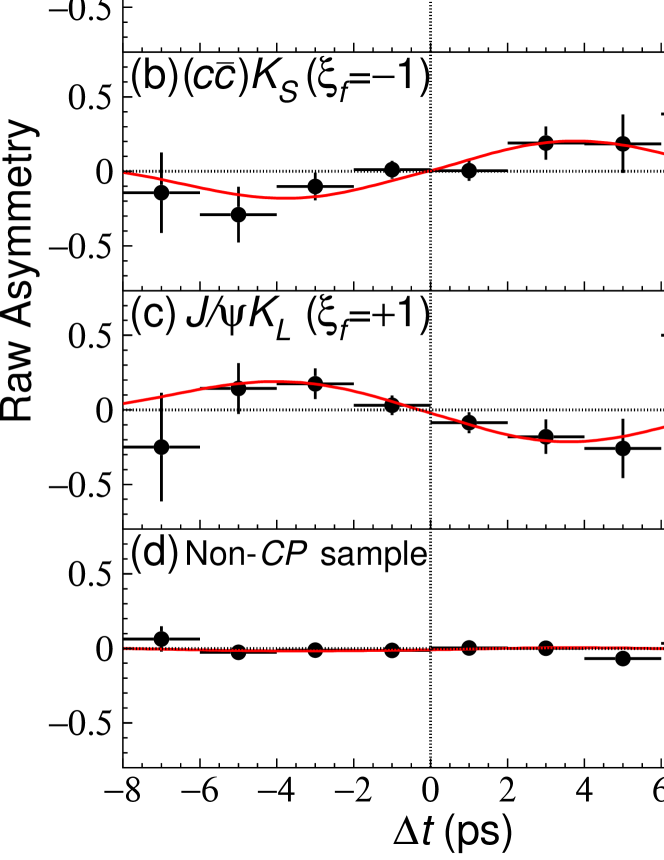
All values are statistically consistent with each other. Figure 3(a), (b), and (c) show the raw asymmetries and the fit results for all modes combined, , and , respectively. A fit to the non- eigenstate self-tagged modes , and , where no asymmetry is expected, yields (stat). Figure 3(d) shows the raw asymmetry for these non- control samples.
Finally we comment on the possibility of direct violation. The signal pdf for a neutral meson decaying into a eigenstate (Eq. (2)) can be expressed in a more general form as
| (4) |
where is a complex parameter that depends on both - mixing and on the amplitudes for and decay to a eigenstate. The parameter in the coefficient of is given by and is equal to in the SM. The presence of the cosine term () would indicate direct violation; the value for reported above is determined with the assumption , as expected in the SM. In order to test this assumption, we also performed a fit using the above expression with and as free parameters, keeping everything else the same. We obtain and for all modes combined. This result confirms the assumption used in our analysis.
We wish to thank the KEKB accelerator group for the excellent operation of the KEKB accelerator. We acknowledge support from the Ministry of Education, Culture, Sports, Science, and Technology of Japan and the Japan Society for the Promotion of Science; the Australian Research Council and the Australian Department of Industry, Science and Resources; the National Science Foundation of China under contract No. 10175071; the Department of Science and Technology of India; the BK21 program of the Ministry of Education of Korea and the CHEP SRC program of the Korea Science and Engineering Foundation; the Polish State Committee for Scientific Research under contract No. 2P03B 17017; the Ministry of Science and Technology of the Russian Federation; the Ministry of Education, Science and Sport of the Republic of Slovenia; the National Science Council and the Ministry of Education of Taiwan; and the U.S. Department of Energy.
References
- [1] M. Kobayashi and T. Maskawa, Prog. Theor. Phys. 49, 652 (1973).
- [2] A. B. Carter and A. I. Sanda, Phys. Rev. D 23, 1567 (1981); I. I. Bigi and A. I. Sanda, Nucl. Phys. B193, 85 (1981).
- [3] K. Abe et al. (Belle Collab.), Phys. Rev. Lett. 87, 091802 (2001); K. Abe et al. (Belle Collab.), hep-ex/0202027, accepted for publication in Phys. Rev. D.
- [4] B. Aubert et al. (BaBar Collab.), Phys. Rev. Lett. 87, 091801 (2001); B. Aubert et al. (BaBar Collab.), hep-ex/0201020, submitted to Phys. Rev. D.
- [5] A. Abashian et al. (Belle Collab.), Nucl. Instr. and Meth. A 479, 117 (2002).
- [6] E. Kikutani ed., KEK Preprint 2001-157 (2001), to appear in Nucl. Instr. and Meth. A.
- [7] K. Abe et al. (Belle Collab.), Phys. Lett. B 538, 11 (2002).
- [8] K. Abe et al. (Belle Collab.), Phys. Rev. Lett. 88, 171801 (2002).
- [9] K. Hagiwara et al., Particle Data Group, Phys. Rev. D 66, 010001 (2002).