B A B AR-CONF-02/033
SLAC-PUB-9303
July 2002
Search for CP Violation in / Decays to and
in Regions Dominated
by the Resonance
The B A
B AR Collaboration
July 24, 2002
Abstract
We present preliminary measurements of direct and indirect -violating asymmetries in the decays of neutral mesons to and final states dominated by the resonance, using a time-dependent maximum likelihood analysis. The data sample comprises decays () collected with the B A B AR detector at the PEP-II asymmetric-energy Factory at SLAC. For the violation parameters, we measure
For the other parameters in the description of the decay-time dependence, we obtain
Contributed to the 31st International Conference on High Energy Physics,
7/24—7/31/2002, Amsterdam, The Netherlands
Stanford Linear Accelerator Center, Stanford University, Stanford, CA 94309
Work supported in part by Department of Energy contract DE-AC03-76SF00515.
The B A
B AR Collaboration,
B. Aubert, D. Boutigny, J.-M. Gaillard, A. Hicheur, Y. Karyotakis, J. P. Lees, P. Robbe, V. Tisserand, A. Zghiche
Laboratoire de Physique des Particules, F-74941 Annecy-le-Vieux, France
A. Palano, A. Pompili
Università di Bari, Dipartimento di Fisica and INFN, I-70126 Bari, Italy
J. C. Chen, N. D. Qi, G. Rong, P. Wang, Y. S. Zhu
Institute of High Energy Physics, Beijing 100039, China
G. Eigen, I. Ofte, B. Stugu
University of Bergen, Inst. of Physics, N-5007 Bergen, Norway
G. S. Abrams, A. W. Borgland, A. B. Breon, D. N. Brown, J. Button-Shafer, R. N. Cahn, E. Charles, M. S. Gill, A. V. Gritsan, Y. Groysman, R. G. Jacobsen, R. W. Kadel, J. Kadyk, L. T. Kerth, Yu. G. Kolomensky, J. F. Kral, C. LeClerc, M. E. Levi, G. Lynch, L. M. Mir, P. J. Oddone, T. J. Orimoto, M. Pripstein, N. A. Roe, A. Romosan, M. T. Ronan, V. G. Shelkov, A. V. Telnov, W. A. Wenzel
Lawrence Berkeley National Laboratory and University of California, Berkeley, CA 94720, USA
T. J. Harrison, C. M. Hawkes, D. J. Knowles, S. W. O’Neale, R. C. Penny, A. T. Watson, N. K. Watson
University of Birmingham, Birmingham, B15 2TT, United Kingdom
T. Deppermann, K. Goetzen, H. Koch, B. Lewandowski, K. Peters, H. Schmuecker, M. Steinke
Ruhr Universität Bochum, Institut für Experimentalphysik 1, D-44780 Bochum, Germany
N. R. Barlow, W. Bhimji, J. T. Boyd, N. Chevalier, P. J. Clark, W. N. Cottingham, C. Mackay, F. F. Wilson
University of Bristol, Bristol BS8 1TL, United Kingdom
K. Abe, C. Hearty, T. S. Mattison, J. A. McKenna, D. Thiessen
University of British Columbia, Vancouver, BC, Canada V6T 1Z1
S. Jolly, A. K. McKemey
Brunel University, Uxbridge, Middlesex UB8 3PH, United Kingdom
V. E. Blinov, A. D. Bukin, A. R. Buzykaev, V. B. Golubev, V. N. Ivanchenko, A. A. Korol, E. A. Kravchenko, A. P. Onuchin, S. I. Serednyakov, Yu. I. Skovpen, A. N. Yushkov
Budker Institute of Nuclear Physics, Novosibirsk 630090, Russia
D. Best, M. Chao, D. Kirkby, A. J. Lankford, M. Mandelkern, S. McMahon, D. P. Stoker
University of California at Irvine, Irvine, CA 92697, USA
C. Buchanan, S. Chun
University of California at Los Angeles, Los Angeles, CA 90024, USA
H. K. Hadavand, E. J. Hill, D. B. MacFarlane, H. Paar, S. Prell, Sh. Rahatlou, G. Raven, U. Schwanke, V. Sharma
University of California at San Diego, La Jolla, CA 92093, USA
J. W. Berryhill, C. Campagnari, B. Dahmes, P. A. Hart, N. Kuznetsova, S. L. Levy, O. Long, A. Lu, M. A. Mazur, J. D. Richman, W. Verkerke
University of California at Santa Barbara, Santa Barbara, CA 93106, USA
J. Beringer, A. M. Eisner, M. Grothe, C. A. Heusch, W. S. Lockman, T. Pulliam, T. Schalk, R. E. Schmitz, B. A. Schumm, A. Seiden, M. Turri, W. Walkowiak, D. C. Williams, M. G. Wilson
University of California at Santa Cruz, Institute for Particle Physics, Santa Cruz, CA 95064, USA
E. Chen, G. P. Dubois-Felsmann, A. Dvoretskii, D. G. Hitlin, F. C. Porter, A. Ryd, A. Samuel, S. Yang
California Institute of Technology, Pasadena, CA 91125, USA
S. Jayatilleke, G. Mancinelli, B. T. Meadows, M. D. Sokoloff
University of Cincinnati, Cincinnati, OH 45221, USA
T. Barillari, P. Bloom, W. T. Ford, U. Nauenberg, A. Olivas, P. Rankin, J. Roy, J. G. Smith, W. C. van Hoek, L. Zhang
University of Colorado, Boulder, CO 80309, USA
J. L. Harton, T. Hu, M. Krishnamurthy, A. Soffer, W. H. Toki, R. J. Wilson, J. Zhang
Colorado State University, Fort Collins, CO 80523, USA
D. Altenburg, T. Brandt, J. Brose, T. Colberg, M. Dickopp, R. S. Dubitzky, A. Hauke, E. Maly, R. Müller-Pfefferkorn, S. Otto, K. R. Schubert, R. Schwierz, B. Spaan, L. Wilden
Technische Universität Dresden, Institut für Kern- und Teilchenphysik, D-01062 Dresden, Germany
D. Bernard, G. R. Bonneaud, F. Brochard, J. Cohen-Tanugi, S. Ferrag, S. T’Jampens, Ch. Thiebaux, G. Vasileiadis, M. Verderi
Ecole Polytechnique, LLR, F-91128 Palaiseau, France
A. Anjomshoaa, R. Bernet, A. Khan, D. Lavin, F. Muheim, S. Playfer, J. E. Swain, J. Tinslay
University of Edinburgh, Edinburgh EH9 3JZ, United Kingdom
M. Falbo
Elon University, Elon University, NC 27244-2010, USA
C. Borean, C. Bozzi, L. Piemontese, A. Sarti
Università di Ferrara, Dipartimento di Fisica and INFN, I-44100 Ferrara, Italy
E. Treadwell
Florida A&M University, Tallahassee, FL 32307, USA
F. Anulli,111 Also with Università di Perugia, I-06100 Perugia, Italy R. Baldini-Ferroli, A. Calcaterra, R. de Sangro, D. Falciai, G. Finocchiaro, P. Patteri, I. M. Peruzzi,11footnotemark: 1 M. Piccolo, A. Zallo
Laboratori Nazionali di Frascati dell’INFN, I-00044 Frascati, Italy
S. Bagnasco, A. Buzzo, R. Contri, G. Crosetti, M. Lo Vetere, M. Macri, M. R. Monge, S. Passaggio, F. C. Pastore, C. Patrignani, E. Robutti, A. Santroni, S. Tosi
Università di Genova, Dipartimento di Fisica and INFN, I-16146 Genova, Italy
S. Bailey, M. Morii
Harvard University, Cambridge, MA 02138, USA
R. Bartoldus, G. J. Grenier, U. Mallik
University of Iowa, Iowa City, IA 52242, USA
J. Cochran, H. B. Crawley, J. Lamsa, W. T. Meyer, E. I. Rosenberg, J. Yi
Iowa State University, Ames, IA 50011-3160, USA
M. Davier, G. Grosdidier, A. Höcker, H. M. Lacker, S. Laplace, F. Le Diberder, V. Lepeltier, A. M. Lutz, T. C. Petersen, S. Plaszczynski, M. H. Schune, L. Tantot, S. Trincaz-Duvoid, G. Wormser
Laboratoire de l’Accélérateur Linéaire, F-91898 Orsay, France
R. M. Bionta, V. Brigljević , D. J. Lange, K. van Bibber, D. M. Wright
Lawrence Livermore National Laboratory, Livermore, CA 94550, USA
A. J. Bevan, J. R. Fry, E. Gabathuler, R. Gamet, M. George, M. Kay, D. J. Payne, R. J. Sloane, C. Touramanis
University of Liverpool, Liverpool L69 3BX, United Kingdom
M. L. Aspinwall, D. A. Bowerman, P. D. Dauncey, U. Egede, I. Eschrich, G. W. Morton, J. A. Nash, P. Sanders, D. Smith, G. P. Taylor
University of London, Imperial College, London, SW7 2BW, United Kingdom
J. J. Back, G. Bellodi, P. Dixon, P. F. Harrison, R. J. L. Potter, H. W. Shorthouse, P. Strother, P. B. Vidal
Queen Mary, University of London, E1 4NS, United Kingdom
G. Cowan, H. U. Flaecher, S. George, M. G. Green, A. Kurup, C. E. Marker, T. R. McMahon, S. Ricciardi, F. Salvatore, G. Vaitsas, M. A. Winter
University of London, Royal Holloway and Bedford New College, Egham, Surrey TW20 0EX, United Kingdom
D. Brown, C. L. Davis
University of Louisville, Louisville, KY 40292, USA
J. Allison, R. J. Barlow, A. C. Forti, F. Jackson, G. D. Lafferty, A. J. Lyon, N. Savvas, J. H. Weatherall, J. C. Williams
University of Manchester, Manchester M13 9PL, United Kingdom
A. Farbin, A. Jawahery, V. Lillard, D. A. Roberts, J. R. Schieck
University of Maryland, College Park, MD 20742, USA
G. Blaylock, C. Dallapiccola, K. T. Flood, S. S. Hertzbach, R. Kofler, V. B. Koptchev, T. B. Moore, H. Staengle, S. Willocq
University of Massachusetts, Amherst, MA 01003, USA
B. Brau, R. Cowan, G. Sciolla, F. Taylor, R. K. Yamamoto
Massachusetts Institute of Technology, Laboratory for Nuclear Science, Cambridge, MA 02139, USA
M. Milek, P. M. Patel
McGill University, Montréal, QC, Canada H3A 2T8
F. Palombo
Università di Milano, Dipartimento di Fisica and INFN, I-20133 Milano, Italy
J. M. Bauer, L. Cremaldi, V. Eschenburg, R. Kroeger, J. Reidy, D. A. Sanders, D. J. Summers
University of Mississippi, University, MS 38677, USA
C. Hast, P. Taras
Université de Montréal, Laboratoire René J. A. Lévesque, Montréal, QC, Canada H3C 3J7
H. Nicholson
Mount Holyoke College, South Hadley, MA 01075, USA
C. Cartaro, N. Cavallo, G. De Nardo, F. Fabozzi, C. Gatto, L. Lista, P. Paolucci, D. Piccolo, C. Sciacca
Università di Napoli Federico II, Dipartimento di Scienze Fisiche and INFN, I-80126, Napoli, Italy
J. M. LoSecco
University of Notre Dame, Notre Dame, IN 46556, USA
J. R. G. Alsmiller, T. A. Gabriel
Oak Ridge National Laboratory, Oak Ridge, TN 37831, USA
J. Brau, R. Frey, M. Iwasaki, C. T. Potter, N. B. Sinev, D. Strom, E. Torrence
University of Oregon, Eugene, OR 97403, USA
F. Colecchia, A. Dorigo, F. Galeazzi, M. Margoni, M. Morandin, M. Posocco, M. Rotondo, F. Simonetto, R. Stroili, C. Voci
Università di Padova, Dipartimento di Fisica and INFN, I-35131 Padova, Italy
M. Benayoun, H. Briand, J. Chauveau, P. David, Ch. de la Vaissière, L. Del Buono, O. Hamon, Ph. Leruste, J. Ocariz, M. Pivk, L. Roos, J. Stark
Universités Paris VI et VII, Lab de Physique Nucléaire H. E., F-75252 Paris, France
P. F. Manfredi, V. Re, V. Speziali
Università di Pavia, Dipartimento di Elettronica and INFN, I-27100 Pavia, Italy
L. Gladney, Q. H. Guo, J. Panetta
University of Pennsylvania, Philadelphia, PA 19104, USA
C. Angelini, G. Batignani, S. Bettarini, M. Bondioli, F. Bucci, G. Calderini, E. Campagna, M. Carpinelli, F. Forti, M. A. Giorgi, A. Lusiani, G. Marchiori, F. Martinez-Vidal, M. Morganti, N. Neri, E. Paoloni, M. Rama, G. Rizzo, F. Sandrelli, G. Triggiani, J. Walsh
Università di Pisa, Scuola Normale Superiore and INFN, I-56010 Pisa, Italy
M. Haire, D. Judd, K. Paick, L. Turnbull, D. E. Wagoner
Prairie View A&M University, Prairie View, TX 77446, USA
J. Albert, G. Cavoto,222 Also with Università di Roma La Sapienza, Roma, Italy N. Danielson, P. Elmer, C. Lu, V. Miftakov, J. Olsen, S. F. Schaffner, A. J. S. Smith, A. Tumanov, E. W. Varnes
Princeton University, Princeton, NJ 08544, USA
F. Bellini, D. del Re, R. Faccini,333 Also with University of California at San Diego, La Jolla, CA 92093, USA F. Ferrarotto, F. Ferroni, E. Leonardi, M. A. Mazzoni, S. Morganti, G. Piredda, F. Safai Tehrani, M. Serra, C. Voena
Università di Roma La Sapienza, Dipartimento di Fisica and INFN, I-00185 Roma, Italy
S. Christ, G. Wagner, R. Waldi
Universität Rostock, D-18051 Rostock, Germany
T. Adye, N. De Groot, B. Franek, N. I. Geddes, G. P. Gopal, S. M. Xella
Rutherford Appleton Laboratory, Chilton, Didcot, Oxon, OX11 0QX, United Kingdom
R. Aleksan, S. Emery, A. Gaidot, P.-F. Giraud, G. Hamel de Monchenault, W. Kozanecki, M. Langer, G. W. London, B. Mayer, G. Schott, B. Serfass, G. Vasseur, Ch. Yeche, M. Zito
DAPNIA, Commissariat à l’Energie Atomique/Saclay, F-91191 Gif-sur-Yvette, France
M. V. Purohit, A. W. Weidemann, F. X. Yumiceva
University of South Carolina, Columbia, SC 29208, USA
I. Adam, D. Aston, N. Berger, A. M. Boyarski, M. R. Convery, D. P. Coupal, D. Dong, J. Dorfan, W. Dunwoodie, R. C. Field, T. Glanzman, S. J. Gowdy, E. Grauges , T. Haas, T. Hadig, V. Halyo, T. Himel, T. Hryn’ova, M. E. Huffer, W. R. Innes, C. P. Jessop, M. H. Kelsey, P. Kim, M. L. Kocian, U. Langenegger, D. W. G. S. Leith, S. Luitz, V. Luth, H. L. Lynch, H. Marsiske, S. Menke, R. Messner, D. R. Muller, C. P. O’Grady, V. E. Ozcan, A. Perazzo, M. Perl, S. Petrak, H. Quinn, B. N. Ratcliff, S. H. Robertson, A. Roodman, A. A. Salnikov, T. Schietinger, R. H. Schindler, J. Schwiening, G. Simi, A. Snyder, A. Soha, S. M. Spanier, J. Stelzer, D. Su, M. K. Sullivan, H. A. Tanaka, J. Va’vra, S. R. Wagner, M. Weaver, A. J. R. Weinstein, W. J. Wisniewski, D. H. Wright, C. C. Young
Stanford Linear Accelerator Center, Stanford, CA 94309, USA
P. R. Burchat, C. H. Cheng, T. I. Meyer, C. Roat
Stanford University, Stanford, CA 94305-4060, USA
R. Henderson
TRIUMF, Vancouver, BC, Canada V6T 2A3
W. Bugg, H. Cohn
University of Tennessee, Knoxville, TN 37996, USA
J. M. Izen, I. Kitayama, X. C. Lou
University of Texas at Dallas, Richardson, TX 75083, USA
F. Bianchi, M. Bona, D. Gamba
Università di Torino, Dipartimento di Fisica Sperimentale and INFN, I-10125 Torino, Italy
L. Bosisio, G. Della Ricca, S. Dittongo, L. Lanceri, P. Poropat, L. Vitale, G. Vuagnin
Università di Trieste, Dipartimento di Fisica and INFN, I-34127 Trieste, Italy
R. S. Panvini
Vanderbilt University, Nashville, TN 37235, USA
S. W. Banerjee, C. M. Brown, D. Fortin, P. D. Jackson, R. Kowalewski, J. M. Roney
University of Victoria, Victoria, BC, Canada V8W 3P6
H. R. Band, S. Dasu, M. Datta, A. M. Eichenbaum, H. Hu, J. R. Johnson, R. Liu, F. Di Lodovico, A. Mohapatra, Y. Pan, R. Prepost, I. J. Scott, S. J. Sekula, J. H. von Wimmersperg-Toeller, J. Wu, S. L. Wu, Z. Yu
University of Wisconsin, Madison, WI 53706, USA
H. Neal
Yale University, New Haven, CT 06511, USA
1 Introduction
In the Standard Model, -violating effects arise from a single complex phase in the three-generation CKM quark-mixing matrix [1]. One of the central questions in particle physics is whether this mechanism is sufficient to explain the pattern of violation observed in nature. Recent measurements of the parameter by the B A B AR [2, 3] and Belle [4, 5] Collaborations establish that symmetry is violated in the neutral -meson system. In addition, these two experiments have studied -violating asymmetries in decays to the charmless two-body final states and [6, 7]. The time-dependent asymmetry in is related to the angle of the unitarity triangle.
In this paper, we investigate violation using charmless / decays to and dominated by the intermediate state, where or . As in the case of , the mode provides a probe of both direct violation and violation in the interference between mixing and decay amplitudes. The latter type of violation is related to the angle . In contrast to , is not a eigenstate and four configurations have to be considered. Although this leads to a more complex analysis [8], it benefits from a higher branching fraction [9, 10].
The resonance is broad () and the state may receive contributions at the amplitude level from other decay channels (e.g., ). For this analysis, we restrict ourselves to the two regions of the Dalitz plot dominated by and assign a label, or , to each event depending on the kinematics of the final state. In the following, we will use the or labels with the above meaning.
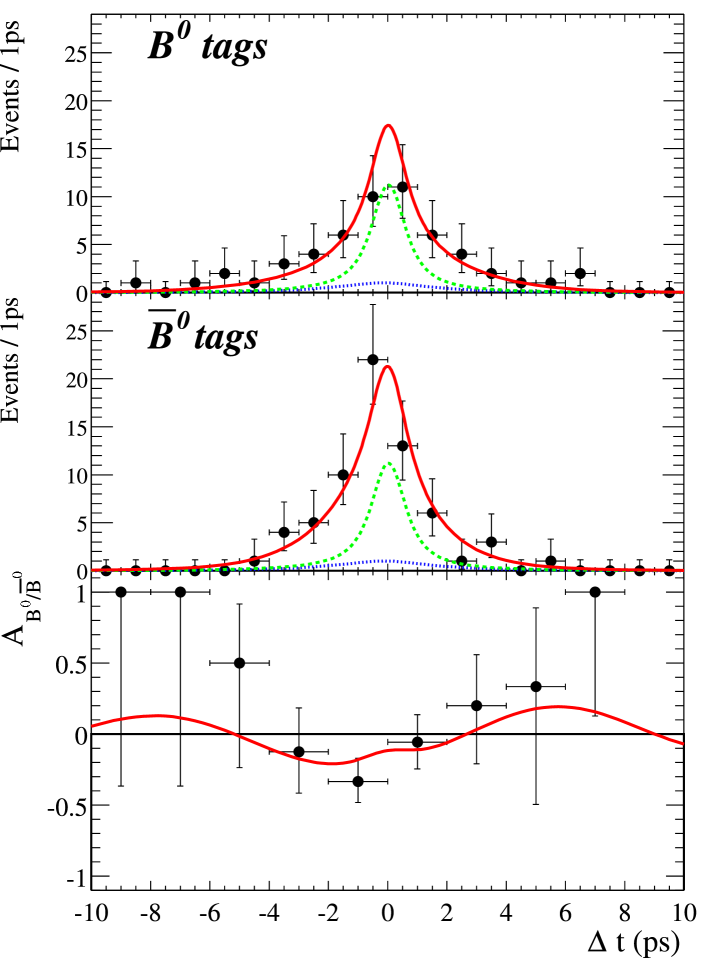
Defining as the time interval between the decay of and that of the other meson in the event, , the decay rate distributions can be written as [11]
The time-integrated charge asymmetries and measure direct violation. The time dependence is described by four additional parameters. In the case of the self-tagging mode, the values of these four parameters are known to be , , , and . For the mode, they allow us to probe violation. Summing over the charge in Eq. 1, and neglecting the charge asymmetry , one obtains the simplified asymmetry between the number of and tags, given by
| (2) |
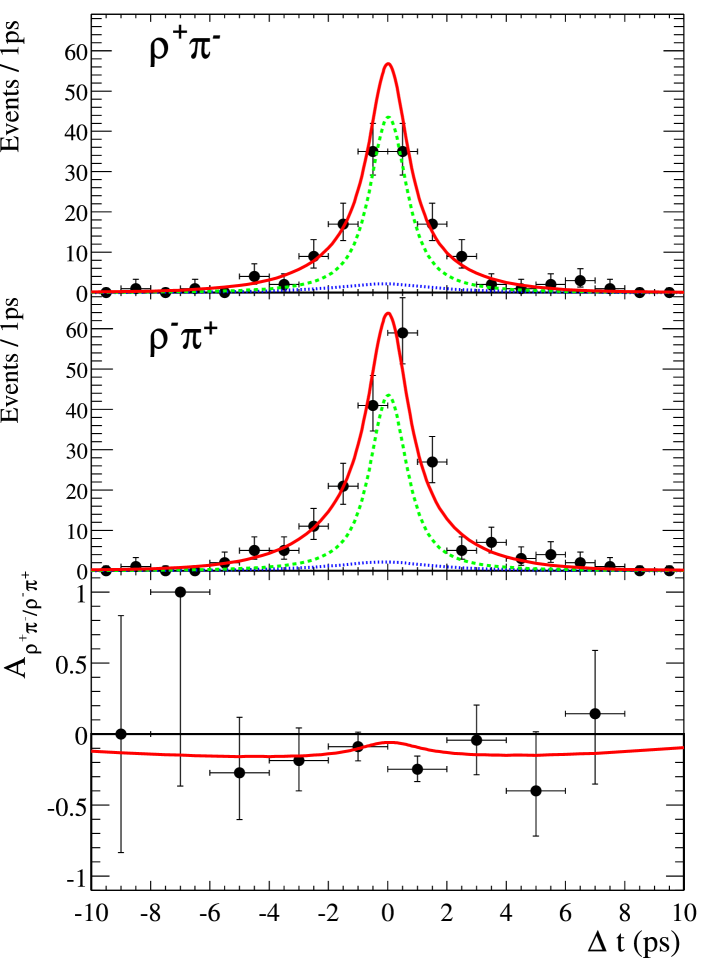
The parameter describes the time-dependent direct violation and measures violation in the interference between mixing and decay related to the angle .
The parameters and are insensitive to violation. The asymmetry between and is described by , while is sensitive to the strong phase difference between the amplitudes contributing to decays. The naive factorization model [8] predicts while there is no prediction for .
The measurements of the six parameters , , , , , and reported here are performed using events collected by the B A B AR detector at the PEP-II asymmetric-energy Factory between January 2000 and June 2002. This sample corresponds to an integrated luminosity of 80.8 taken at the resonance (“on-resonance”), which represents 88 million pairs, and 9.6 taken around 40 below the resonance (“off-resonance”).
We extract the yields and parameters using a time-dependent maximum likelihood analysis based on Eq. 1. This paper is organized as follows: the B A B AR detector is described briefly in Sec. 2. The event reconstruction and selection procedure is given in Sec. 3. -related backgrounds and their treatment in the likelihood analysis are described in Sec. 4. The full maximum likelihood fit is discussed in Sec. 5. Finally, the results and the evaluation of systematic uncertainties are given in Secs. 6 and 7.
2 The B A B AR Detector
A detailed description of the B A B AR detector can be found in Ref. [12]. Charged particle momenta are measured in a tracking system consisting of a -layer double-sided silicon vertex tracker (SVT) and a -layer drift chamber (DCH) filled with a gas mixture based on helium and isobutane. The SVT and DCH operate within a -T superconducting solenoidal magnet. The typical decay vertex resolution is around along the beam direction for the fully reconstructed , and around to for the partially reconstructed tagging . Photons are detected in an electromagnetic calorimeter (EMC) consisting of CsI(Tl) crystals arranged in barrel and forward end-cap sub-detectors. The mass resolution is on average . The flux return for the solenoid is composed of multiple layers of iron and resistive plate chambers for the identification of muons and long-lived neutral hadrons. Tracks from the signal decay are identified as pions or kaons by the Cherenkov angle measured with a detector of internally reflected Cherenkov light (DIRC). The typical separation between pions and kaons varies from at to at , where is the average resolution. Lower momentum kaons are identified with a combination of (for momenta down to ) and measurements of ionization energy loss, , in the DCH and SVT.
3 The Event Selection and Reconstruction
Signal candidates are reconstructed from combinations of two charged tracks and a candidate. The charged tracks are required to be inconsistent with being an electron based on measurements, shower shape criteria in the EMC, and the ratio of shower energy and track momentum. The photons from the must have an energy greater than , and a lateral shower profile variable [13] between and . The invariant mass of the photons must satisfy . Similarly, to form a candidate, the invariant mass of the charged track and must satisfy . If both the and pairs satisfy this requirement, the candidate is rejected, as the might result from interfering ’s, and cannot be associated with a definite charge. The track used for the candidate must be inconsistent with being a kaon based on and DIRC information. Finally, we require , where is the angle between the charged pion in the rest frame of the and the flight direction in the rest frame of the . We refer to the track in as the bachelor track. To reject two-body -background, the invariant mass of the two charged tracks, and the invariant mass of the bachelor track and the must be less than .
Two kinematic variables, used in the maximum likelihood fit, allow discrimination of signal candidates from fake candidates due to random combinations of tracks and candidates. The first variable is the beam-energy substituted mass defined as
| (3) |
where is the square of the center-of-mass (CM) energy, and are the total energy and three-momentum of the state in the laboratory frame, and is the three-momentum of the candidate in the same frame. Signal events populate the region around the mass with a peak resolution of around . Candidates are required to satisfy . The second variable, , is the difference between the reconstructed energy of the candidate in the CM frame and the beam energy. The distribution for signal events with a pion bachelor track () peaks around zero, while the distribution for signal events with the mass hypothesis assigned to the true kaon track, is shifted by MeV on average (the exact shift depends on the momentum of the kaon). Backgrounds from other decay modes of the peak at different depending on the number of charged and neutral particles in the decay: two-body decays, three-body decays, and four-body decays peak at positive, approximately , and negative , respectively. In order to reduce background from other modes, we require .
The time difference is obtained from the measured distance between the positions (along the beam direction) of the and decay vertices, and the known boost of the system. The vertex of the is reconstructed from all tracks in the event except those from the , and an iterative procedure [2] is used to remove tracks with a large contribution to the vertex . An additional constraint is obtained from the three-momentum and vertex position of the candidate, and the average interaction point and boost. We require and , where is the error on estimated on a per-event basis.
Discrimination between and signal events is accomplished using the Cherenkov angle measurement from the DIRC. Therefore, only candidates with bachelor track inside the geometrical acceptance of the DIRC are considered. The number of photons in the DIRC associated with the bachelor track must be greater than 5. In addition, the Cherenkov angle of the bachelor track is required to be inconsistent with the proton hypothesis. Finally, we reject events where the bachelor track is inconsistent by more than with both the pion and kaon hypotheses.
Continuum (where ) events represent the dominant background source for charmless decays. To enhance discrimination between signal and continuum background, we use a neural network (NN) that combines four discriminating variables: two kinematic variables related to the reconstructed candidate, the mass and , and two event shape variables, and , where is the momentum of track belonging to the rest of the event in the CM frame and is the angle between the momentum of track and the thrust axis in the CM frame. Optimization and training of the NN is performed using off-resonance data contained in the signal region, to reduce residual correlations of the NN with the kinematic variables used in the maximum likelihood fit. In addition, the Monte Carlo signal training sample, generated with a GEANT4-based Monte Carlo simulation [14], only consists of correctly reconstructed signal events to increase the discrimination against cross-feed from other decay modes of the . The distributions of the NN output for correctly reconstructed events, events with a misreconstructed , and continuum background are shown in Fig. 1. A cut is applied on the NN output at 0.54 in order to reduce the number of continuum events entering the likelihood analysis. In addition, the NN output is used as a discriminating variable in the likelihood. Approximately 37% of the events have more than one candidate passing this selection. In this case, we choose the candidate with the reconstructed invariant mass closest to the nominal mass [15].
After all selection criteria have been applied, a total of 21172 events enter the likelihood fit. For of the neutral decays to that pass the event selection, the charge of the is unambiguously determined by the charge of the slowest track. If the lower-momentum track has a momentum below , its charge is assigned to the . This approach does not rely on the reconstruction of the , and hence provides a more robust way to assign the charge to the than criteria based on the reconstructed mass of candidates. For the remaining events, the sign of the is that of the combination with invariant mass closest to the mass [15]. With this procedure, only 5% of the events are assigned an incorrect charge.
To determine the flavor of the meson we use the same -tagging algorithm used in the B A B AR analysis [2]. The algorithm relies on the correlation between the flavor of the quark and the charge of the remaining tracks in the event after removal of the tracks from the candidate. We define five mutually exclusive tagging categories: Lepton, Kaon, NT1, NT2, and Untagged. Lepton tags rely on primary electrons and muons from semileptonic decays, while Kaon tags exploit the correlation in the process between the net kaon charge and the charge of the quark. The NT1 (more certain tags) and NT2 (less certain tags) categories are derived from a neural network that is sensitive to charge correlations between the parent and unidentified leptons and kaons, soft pions, or the charge and momentum of the track with the highest CM momentum. The addition of Untagged events provides a larger sample for measuring the charge asymmetries and .
The quality of tagging is expressed in terms of the effective efficiency , where is the fraction of events tagged in category and the dilution is related to the average mistag fraction . The mistag fraction , the efficiency , and the mistag difference , where , are the mistag probabilities for and , are measured for each tagging category with a large data sample of fully reconstructed neutral decays to and flavor eigenstates [2]. The tagging quality factor is found to be (see Table 1). We use these measurements of the tagging efficiencies and dilutions for and signal, and we float separate continuum background event yields for each category in the maximum likelihood fit.
| Category | ||||
|---|---|---|---|---|
| Lepton | ||||
| Kaon | ||||
| NT1 | ||||
| NT2 | ||||
| Untagged | – | – | – | |
| Total |
4 -related Backgrounds
We use a Monte Carlo simulation to study the potential cross-feed from other charm and charmless decays starting from a list of more than charmless decay modes to two-body, three-body and four-body final states, and an inclusive Monte Carlo simulation of decays. We estimate the number of events passing the event selection criteria using the selection efficiency from Monte Carlo and either measured branching ratios [16] or upper limits where available, or estimates based on related measured decay modes. We identify the charmless modes that have more than one event entering the final sample.
These modes are grouped into seven classes for which the discriminating variables have similar distributions. For each of the seven classes, a correction term is introduced in the likelihood, with a fixed number of events. Two additional classes for and decays are also included in the -background model, which is summarized in Table 2.
Like the selection efficiencies, the shapes of the distributions of the discriminating variables are obtained from Monte Carlo simulations. Figure 2 shows the - planes for three main -related backgrounds: , , and . The charmless -background NN output and distributions are signal-like, and the variable discriminates between two-body (), three-body ( peaking around 0) and four-body () modes. The and distributions for background have shapes similar to the continuum distributions.
For charged -backgrounds, the distribution is modeled as
| (4) |
where is the asymmetry between the number of and candidates for a given flavor tag and is extracted from Monte Carlo, and is the mistag fraction for tagging category , measured in data using a sample of fully reconstructed charged decays to for which we assume direct conservation.
For neutral -backgrounds, the distribution is parametrized as for signal, where , and is computed from Monte Carlo to take into account possible correlations between the reconstructed charge and the flavor tag. We do not model violation for the -background in the nominal fit. The corresponding systematic uncertainties in our measurements are discussed in Sec. 7.
| Charged Mode | (Br error) | ||||
|---|---|---|---|---|---|
| 0.41 | 2.16 | 1 | -1 | ||
| 0.06 | 7.23 | 1 | -1 | ||
| 15.17 | 0 | 0.22 | – | ||
| 0.19 | 7.78 | 1 | -1 | 22.1 2.1 | |
| 1.53 | 0 | -1 | – | ||
| 23.22 | 0 | -1 | – | ||
| 2.05 | 21.20 | 0.80 | -1 | 8.4 4.0 | |
| 36.51 | 0 | -0.46 | – | 9.7 3.2 | |
| 8.24 | 0 | -0.76 | – | 8.7 1.3 | |
| 1.69 | 15.46 | 1 | -1 | 11.7 4.0 | |
| 0.17 | 13.50 | 0 | -1 | 11.6 1.5 | |
| 5.09 | 0 | -1 | 0 | 5.9 1.4 | |
| 195.0 | 31.8 | 0 | -0.46 | ||
| Neutral Mode | (Br error) | ||||
| 3.38 | 0 | 1 | – | 8.7 3.0 | |
| 0.72 | 5.57 | 1 | -1 | ||
| 87.64 | 0 | 0 | – | ||
| 1.03 | 0 | 0 | – | ||
| 9.43 | 0 | 0 | – | ||
| 0 | 6.62 | – | -1 | ||
| 20.92 | 12.97 | 0.85 | -1 | 8.7 3.0 | |
| 1.87 | 2.17 | 1 | -1 | 18.5 1.0 | |
| 121.7 | 13.7 | 0 | 0 |
5 The Maximum Likelihood Fit
5.1 The Likelihood
The yields and the other and non- observables are determined by minimizing the quantity , where is the total extended likelihood defined over all tagging categories as
| (5) |
with , the number of events expected in category and is the likelihood computed for event .
The sample is assumed to consist of signal, continuum background and -background components where the bachelor track can be a pion or a kaon. The variables , and NN output discriminate signal from background, while the Cherenkov angle and, to a lesser extent, constrain the relative amount of and . The variable allows the measurement of the parameters in the description of the decay-time dependence and provides additional background rejection. The likelihood for event in tagging category is the sum of the probability density functions (PDF) over all components, weighted by the expected yields for each component,
| (6) |
where
-
•
is the number of signal events of type in the entire sample ().
-
•
is the fraction of signal events that are tagged in category (given in Table 1).
-
•
is the number of continuum background events with bachelor track of type that are tagged in category .
-
•
is the PDF for signal events. contains the measured physics quantities defined in Eq. 1 diluted by the effects of mistagging and the resolution.
-
•
is the PDF for continuum background events with bachelor track of type .
-
•
and are the -background contributions where the bachelor track is a true pion and a true kaon, respectively (see Sec. 4).
Due to the relatively large number of low-energy photon candidates in reconstruction, the decay can be misreconstructed. These misreconstructed events have different shapes than correctly reconstructed signal for the distributions of the variables , and NN output. Additionally, in some cases the assignment of the charge may be wrong. These effects are taken into account by splitting the signal PDFs into three parts: true signal events that are correctly reconstructed, misreconstructed true signal events with right-sign charge, and misreconstructed true signal events with wrong-sign charge. The fractions of the three species of signal events are extracted from the Monte Carlo.
5.2 The Probability Density Functions
-
•
The distribution for correctly reconstructed signal is parametrized using a Gaussian with a power law tail on the low side, where the mean is free to vary in the likelihood fit. The continuum background is parametrized using an ARGUS function [17] with a floating shape parameter. -
•
The distribution for correctly reconstructed signal is parametrized using the sum of two Gaussians, while the distributions for misreconstructed signal (both for right-sign and wrong-sign charges) are modeled with simple Gaussians. The mean of the core Gaussian for the correctly reconstructed signal is floated in the maximum likelihood fit, in order to be less sensitive to the energy calibration for . Continuum background is modeled by a linear function. -
•
output
The NN output PDFs for correctly reconstructed and for misreconstructed signal events are determined with the Monte Carlo. A small discrepancy is observed between the NN output distributions from Monte Carlo and from a data control sample of fully reconstructed decays, and is propagated to the systematic error. The continuum PDF for the NN output is determined with the off-resonance data.
For the above three variables, the PDFs for correctly reconstructed decays and for misreconstructed decays are obtained from Monte Carlo after applying all selection cuts. The parameters for the continuum PDFs are either determined from off-resonance data, or left free to vary in the final fit to the on-resonance data sample.
-
•
The resolution function for correctly reconstructed and misreconstructed signal events is a sum of three Gaussians, identical to the one described in Ref. [2], with parameters determined from a fit to a large data sample of fully reconstructed neutral decays to and . The continuum distribution is parametrized using a triple Gaussian with a common mean and three distinct widths that scale the per-event error. The six parameters describing the shape of the the continuum PDF are free to vary in the maximum likelihood fit. For each tagging category and bachelor hypothesis ( or ), a parameter similar to for -related backgrounds (see Sec. 4) is introduced to take into account the correlations between the charge of the candidate and the flavor tag. The values of these parameters are determined using on-peak data. -
•
Particle identification
The identification of the bachelor track as a pion or a kaon is accomplished with the Cherenkov angle measurement from the DIRC. We construct two Gaussian PDFs from the difference between measured and expected values of for the pion or kaon hypothesis, normalized by the resolution. The DIRC performance is parametrized using a data sample of , decays. Within the statistical precision of the control sample, we find a similar response for positive and negative tracks and use a single parametrization for both.
6 Results
We find (stat) and (stat) events in our data sample and we measure the parameters
| (7) |
The two other observables in the decay rates (Eq. 1) are measured to be
| (8) |
The correlations between these parameters are summarized in
Table 3.
Alternatively, the results on direct violation can be expressed using the asymmetries
| (9) | |||||
| (10) |
In the decays and the spectator quark is involved in the formation of the meson. These two decay modes are related to the direct asymmetry according to Eq. 9. Similarly in Eq. 10, we probe direct violation through the asymmetry using the decays and . In this case the meson is formed from the spectator quark. From the above fitted values (Eq. 6 and Eq. 8) and their correlation matrix (Table 3) we obtain
Figure 3 shows the distributions of and for data samples that are enhanced in signal using cuts on the signal-to-continuum likelihood ratio of the other discriminating variables. Figures 4 and 5 show respectively the time-dependent asymmetry (see Eq. 2) between and events in the Lepton and Kaon categories, and the time-dependent asymmetry between and for all the tagging categories, after a cut on the signal-to-continuum likelihood ratio of all discriminating variables except .
| Global | |||||||
|---|---|---|---|---|---|---|---|
| correlation | |||||||
| 15.6 | 100 | 3.4 | 0.6 | 0.5 | |||
| 6.3 | 3.4 | 100 | |||||
| 28.8 | 100 | 23.9 | 9.2 | ||||
| 28.3 | 23.9 | 100 | 6.9 | ||||
| 24.9 | 0.6 | 9.2 | 6.9 | 100 | |||
| 25.1 | 0.5 | 100 |
As a validation of the parametrization in data, we allow and to vary in the fit. We find and , and the remaining free parameters are stable with respect to the nominal fit with fixed and . When allowing to vary, we find , which is consistent with the expected value of used in the nominal fit.
7 Systematic Uncertainties
Several sources contribute to the systematic error on the measured observables.
-
•
and lifetime
This systematic error is estimated by varying the values of and the lifetime with respect to their world average [15] by one standard deviation. -
•
resolution function
Since the parameters of the time distribution for the continuum background are fitted in the data, the only contribution to the systematic uncertainty is due to the resolution for signal. We propagate the errors on each parameter (scale factors, biases, fraction of tails) of the signal resolution function to the fit results. -
•
Tagging
We propagate the uncertainties on the tagging dilutions and the tagging efficiencies to the fit results. -
•
Fraction of misreconstructed signal events and misreconstruction of charge
Both the the fraction of misreconstructed signal events and the fraction of events with misreconstructed charge and are determined with the Monte Carlo. We assign a conservative 25% uncertainty to these parameters and propagate this error to the fit results. -
•
Fitting procedure
We perform fits on large Monte Carlo samples of a weighted mixture of signal, as well as fits to a large number of toy Monte Carlo samples of the same size as our data sample that contain realistic amounts of both continuum and -related backgrounds. The small biases observed in these two tests are added in quadrature and assigned as a systematic uncertainty. -
•
, and NN output PDFs
The continuum PDFs for and are fitted to the data in the likelihood analysis. The continuum PDF for the NN output is determined with the off-resonance data and we propagate the statistical uncertainty due to the limited size of this sample to the fit results. We evaluate the systematic uncertainties due to the signal PDFs with a large data control sample. The small differences observed between the distribution shapes for Monte Carlo events and the distribution shapes obtained from the data control sample are used as an estimate of the systematic uncertainty on the signal PDFs. These uncertainties are propagated to the fit results. -
•
Particle identification
We assume that the average position of the Cherenkov angle is known with a precision of 0.5 mrad and that there is an uncertainty of 10% on . We propagate these conservative errors to our fit results. -
•
-related backgrounds
The number of events in the various modes entering our description of the background are varied according to the error on their branching ratio, if measured, or in the range indicated in Table 2.
The parameters ( and ) describing the correlation between the tagging and the charge assignment are varied within a conservative range. For some of the major contaminations (, , and ) conservative ranges are extracted from various Monte Carlo studies. For other major contaminations (, ) a conservative error equal to the correction itself is used. For the other modes, the full range is used for the systematic study.
All -background modes can potentially exhibit direct violation, and a few of them can potentially exhibit violation in the interference between decay and mixing. Finally, for the neutral modes, various physical phases may lead to a non-zero value of the phenomenological parameter . For the major contaminations listed previously, a Monte Carlo study yields the maximum possible range for the corresponding effective parameters. This range is then used for the systematic study. For the other modes, the full range is used.
Table 4 summarizes the various sources contributing to the systematic error on the measurements of the six parameters , , , , , and . The main source of systematic error arises from the uncertainty on the background components. Finally, the systematic errors for the direct asymmetries and (see definitions in Eq. 9 and Eq. 10) are and respectively.
| Type of systematic error | ||||||
|---|---|---|---|---|---|---|
| 0.000 | 0.000 | 0.005 | 0.005 | 0.001 | 0.001 | |
| 0.001 | 0.000 | 0.002 | 0.002 | 0.002 | 0.002 | |
| Time resolution | 0.001 | 0.001 | 0.003 | 0.002 | 0.005 | 0.006 |
| Tagging | 0.001 | 0.001 | 0.021 | 0.012 | 0.012 | 0.012 |
| Fraction of misrec. signal events | 0.002 | 0.002 | 0.017 | 0.004 | 0.002 | 0.004 |
| Fraction of events with misrec. charge | 0.000 | 0.002 | 0.001 | 0.004 | 0.000 | 0.000 |
| Fitting procedure (bias) | 0.012 | 0.001 | 0.038 | 0.033 | 0.020 | 0.015 |
| NN output signal () | 0.002 | 0.002 | 0.006 | 0.006 | 0.009 | 0.013 |
| NN output continuum (off-resonance data) | 0.002 | 0.002 | 0.001 | 0.001 | 0.001 | 0.001 |
| PDF for and | 0.006 | 0.003 | 0.009 | 0.003 | 0.005 | 0.017 |
| Particle identification | 0.010 | 0.010 | 0.008 | 0.014 | 0.013 | 0.001 |
| -backgrounds | 0.109 | 0.065 | 0.077 | 0.107 | 0.063 | 0.035 |
| Total | 0.110 | 0.065 | 0.091 | 0.114 | 0.069 | 0.046 |
8 Summary
With a data sample of 88 million pairs, collected between January 2000 and June 2002 by the B A B AR detector at the PEP-II asymmetric-energy Factory at SLAC, we find (stat) and (stat) events and we obtain the following preliminary measurements of the violation parameters:
and of the other parameters in the description of the decay-time dependence:
For the asymmetries and , which probe direct violation, we measure
9 Acknowledgments
We are grateful for the extraordinary contributions of our PEP-II colleagues in achieving the excellent luminosity and machine conditions that have made this work possible. The success of this project also relies critically on the expertise and dedication of the computing organizations that support B A B AR. The collaborating institutions wish to thank SLAC for its support and the kind hospitality extended to them. This work is supported by the US Department of Energy and National Science Foundation, the Natural Sciences and Engineering Research Council (Canada), Institute of High Energy Physics (China), the Commissariat à l’Energie Atomique and Institut National de Physique Nucléaire et de Physique des Particules (France), the Bundesministerium für Bildung und Forschung and Deutsche Forschungsgemeinschaft (Germany), the Istituto Nazionale di Fisica Nucleare (Italy), the Research Council of Norway, the Ministry of Science and Technology of the Russian Federation, and the Particle Physics and Astronomy Research Council (United Kingdom). Individuals have received support from the A. P. Sloan Foundation, the Research Corporation, and the Alexander von Humboldt Foundation.
References
-
[1]
N. Cabibbo, Phys. Rev. Lett. 10, 531 (1963);
M. Kobayashi and T. Maskawa, Prog. Th. Phys. 49, 652 (1973). -
[2]
B A
B AR Collaboration, B. Aubert et al., Phys. Rev. Lett. 87, 091801 (2001);
B A B AR Collaboration, B. Aubert et al., hep-ex/0201020, to appear in Phys. Rev. D. - [3] B A B AR Collaboration, B. Aubert et al., hep-ex/0207042, submitted to Phys. Rev. Lett.
- [4] Belle Collaboration, K. Abe et al., Phys. Rev. Lett. 87, 091802 (2001).
- [5] Belle Collaboration, K. Abe et al., hep-ex/0207033, submitted to Phys. Lett. B.
-
[6]
B A
B AR Collaboration, B. Aubert et al., Phys. Rev. D65, 051502 (2002);
B A B AR Collaboration, B. Aubert et al., hep-ex/0207055, submitted to Phys. Rev. Lett. - [7] Belle Collaboration, K. Abe et al., hep-ex/0204002, to appear in Phys. Rev. Lett.
- [8] R. Aleksan, I. Dunietz, B. Kayser and F. Le Diberder, Nuclear Physics B361, 141 (1991).
- [9] B A B AR Collaboration, B. Aubert et al., hep-ex/0107058, contribution to the 20th International Symposium on Lepton and Photon Interactions at High Energies, Rome, Italy (2001).
- [10] Belle Collaboration, A. Gordon et al., hep-ex/0207007, submitted to Phys. Lett. B.
- [11] The B A B AR Physics Book, Editors P.F. Harrison and H.R. Quinn, SLAC-R-504 (1998).
- [12] B A B AR Collaboration, A. Palano et al., Nucl. Instrum. Methods A479, 1 (2002).
- [13] A. Drescher et al., Nucl. Instrum. Methods A237, 464 (1985).
- [14] GEANT4 Collaboration, CERN-IT-2002-003, submitted to Nucl. Instrum. Methods.
- [15] Particle Data Group, K. Hagiwara et al., Phys. Rev D66, 010001 (2002).
-
[16]
Belle Collaboration, K. Abe et al., BELLE-CONF-0115 (2001);
Belle Collaboration, K. Abe et al., Phys. Rev. D65, 092005 (2002);
CLEO Collaboration, C. P. Jessop et al., Phys. Rev. Lett. 85, 2881 (2000);
B A B AR Collaboration, B. Aubert et al., hep-ex/0008058, contribution to ICHEP 2000, Osaka, Japan. - [17] ARGUS Collaboration, H. Albrecht et al., Z. Phys. C48, 543 (1990).