Rare Decays Recent Results from FOCUS (+Theory)
Will E. Johns (for the FOCUS collaboration)
Department of Physics and Astronomy
Vanderbilt University
Nashville, TN USA
1 Introduction
The search for rare decays of charm particles is reaching a point where long range effects should be observable in the next few years. In order to perform the analysis of such small data sets, several techniques have become de facto standards in the last decade. In this talk, we will show new rare charm decay results from the FOCUS experiment. The analysis has been performed utilizing a bootstrap technique which we will describe below.
2 Technique
The FOCUS analysis technique has emphasized a careful approach to the treatment of backgrounds in a limited statistics analysis. The usual approach is to select cuts to optimize signal efficiency relative to background sidebands. This “blind” technique, where the signal region is masked off, can still lead to a downward fluctuation of the sidebands relative to the masked off “signal” region and a more conservative limit on average.
Further, authors frequently use the technique outlined in reference [1] to calculate the confidence levels used in the calculation of their limits. The approach in [1] does not explicitly include fluctuations in the background. Indeed, the PDG [3] suggests presenting a measure of the experimental sensitivity in addition to the reported limit whenever experiments quote a result since none of the methods suggested [3], including [2], properly deal with fluctuations in the background and bias in selecting the data.
For our analysis, we chose a method [4] which includes the background fluctuations directly into the calculation of the likelihood. The probability of finding a signal rate and a background rate given events in a signal region and events in background sidebands is described by:
Where is the ratio of the number of background events in the sideband regions to the signal region. The is determined via Monte Carlo. Rolke and Lopez [4] have shown that this method for determining an upper limit provides better coverage than [1].
Methods presented by Rolke and Lopez have also been shown to reduce bias in the selection of optimal cuts [5]. Briefly, one uses the computed sensitivity on an ensemble of bootstrapped (sample with replacement) events from the data. The cuts chosen by each selected set in this manner are applied to a second, independent, bootstrapped sample. A sensitivity as well as an upper limit are computed from the second sample. The sensitivity and branching ratio quoted are the median values of the ensemble of results from the second bootstrap.
The data for the analyses presented in this talk were collected using the Wideband photoproduction experiment FOCUS during the 1996–1997 fixed–target run at Fermilab. The FOCUS detector is a large aperture, fixed–target spectrometer with excellent vertexing and particle identification used to measure the interactions of high energy photons on a segmented BeO target. The FOCUS beamline [6] and detector [7, 8] have been described elsewhere.
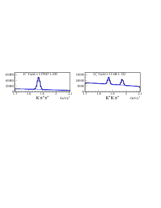
To provide a clean sample of ’s and ’s, we look for ’s through the 3-body decay chain where the represents a pion or a kaon. We use a cut grid based on kinematic variables and particle ID algorithm results that have been shown to be effective for other charm decays. The grid includes cuts on the significance of separation between the interaction and decay vertices (), the confidence level of the vertex fit of the decay vertex, the confidence level that a particle is identified as a muon, the momentum of muon candidates, and Čerenkov likelihoods based on different particle hypotheses used to separate pions and kaons [8]. The normalizing modes used to compute the branching ratios for and are shown in Figure 1 for the loosest cuts in the grid.
3 Results and Systematic Checks
The dominant systematic effects in this analysis have been estimated to occur from the absolute branching ratios [9] used to calibrate the normalization modes. The systematic errors, which averaged about 7.6% for the modes and 27.6% for the modes, were added to the result using the technique outlined in [2]. As a check on the dual bootstrap, another technique was used that selected a unique cut set based on the results of the cut grid. The cuts used to determine the best sensitivities in the first bootstrap are examined for all modes and a best set is determined based on the most likely cut combination. This cut set is then applied to all modes once in the spirit of a more traditional “blind” analysis.
The results of the analysis are presented in Table 1 below. There is good agreement between the dual bootstrap, the sensitivity and the single cut systematic check. Note that the only mode where the result and the sensitivity show a marked difference is in which might indicate more contamination from than anticipated.
| Decay Mode | Result | Sensitivity | Single Cut |
|---|---|---|---|
4 Comparisons to Experiment and Theory
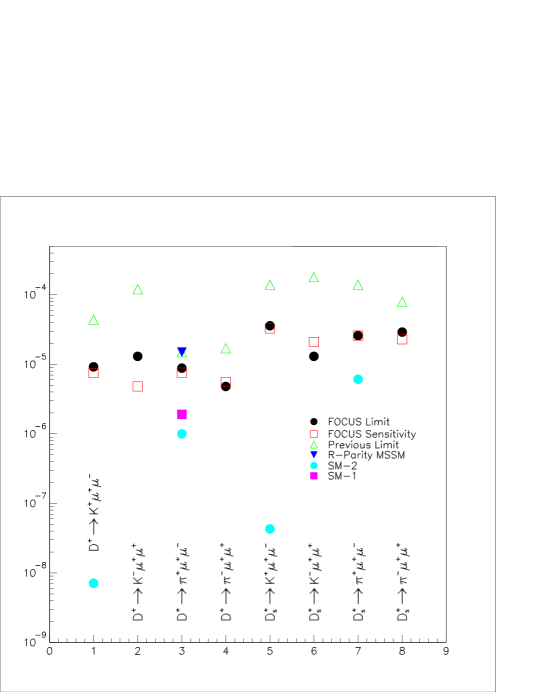
In Figure 2 below, we show the FOCUS branching ratio limits for the dual bootstrap technique described in the text. Our results are a substantial improvement over previous results [12, 10] and FOCUS sets a new limit for the MSSM R-Parity violating prediction [13] for the branching ratio of 90% C.L..
I am grateful to Daniel Engh for supplying all the FOCUS results presented in this note. I am also grateful to Gustavo Burdman and Paul Singer for their patience during several very useful conversations.
References
- [1] G. J. Feldman and R. D. Cousins, Phys. Rev. D 57, 3873 (1998) [arXiv:physics/9711021].
- [2] R. D. Cousins and V. L. Highland, Nucl. Instrum. Meth. A 320, 331 (1992).
- [3] F. James and R. Cousins, Eur. Phys. J. C 15, 195 (2000).
- [4] W. A. Rolke and A. M. Lopez, Nucl. Instrum. Meth. A 458, 745 (2001) [arXiv:hep-ph/0005187].
- [5] W. A. Rolke and A. M. Lopez, arXiv:hep-ph/0206139.
- [6] P. L. Frabetti et al., Nucl. Instrum. Meth. A 329, 62 (1993).
- [7] P. L. Frabetti et al. [E-687 Collaboration], Nucl. Instrum. Meth. A 320, 519 (1992).
- [8] J. M. Link et al. [FOCUS Collaboration], Nucl. Instrum. Meth. A 484, 270 (2002) [arXiv:hep-ex/0108011].
- [9] D. E. Groom et al. [Particle Data Group Collaboration], Eur. Phys. J. C 15, 1 (2000).
- [10] E. M. Aitala et al. [E791 Collaboration], Phys. Lett. B 462, 401 (1999) [arXiv:hep-ex/9906045].
- [11] E. M. Aitala et al. [E791 Collaboration], Phys. Rev. Lett. 86, 3969 (2001) [arXiv:hep-ex/0011077].
- [12] P. L. Frabetti et al. [The E687 Collaboration], Phys. Lett. B 398, 239 (1997).
- [13] G. Burdman, E. Golowich, J. Hewett and S. Pakvasa, arXiv:hep-ph/0112235.
- [14] S. Fajfer, S. Prelovsek and P. Singer, Phys. Rev. D 64, 114009 (2001) [arXiv:hep-ph/0106333].
- [15] P. Singer and D. X. Zhang, Phys. Rev. D 55, 1127 (1997) [arXiv:hep-ph/9612495].