BABAR-PROC-02/048
Measurements of branching fractions and -violating asymmetries in decays
Paul D. Dauncey (representing the BABAR Collaboration)
Blackett Laboratory
Imperial College
Prince Consort Road
London SW7 2BW, UK
Presented at “Flavor Physics and Violation” (FPCP),
16-18 May 2002, University of Pennsylvania, Philadelphia, USA.
1 Introduction
Recent measurements of the -violating asymmetry parameter by the BABAR [1] and BELLE [2] collaborations established violation in the system. These measurements, as well as updated preliminary results [3, 4], are consistent with the Standard Model expectation based on measurements and theoretical estimates of the elements of the Cabibbo-Kobayashi-Maskawa [5] (CKM) quark-mixing matrix.
The study of decays to charmless hadronic two-body final states will yield important information about the remaining angles ( and ) of the Unitarity Triangle. In the Standard Model, the time-dependent -violating asymmetry in the decay is related to the angle , and ratios of branching fractions for various and decay modes are sensitive to the angle . We previously reported measurements of branching fractions [6] and -violating asymmetries [7] in , , and decays. (Unless explicitly stated, charge conjugate decay modes are assumed throughout this paper.) In this paper, we present a preliminary update of these results using a sample of million pairs.
We reconstruct a sample of mesons () decaying to the final state, where and refer to or , and examine the remaining charged particles in each event to “tag” the flavor of the other meson (). The decay rate distribution when and is given by
| (1) |
where is the mean lifetime, is the eigenstate mass difference, and is the time between the and decays. The -violating parameters and are defined in terms of a complex parameter as
| (2) |
If the decay proceeds purely through the tree process, then is given in terms of the CKM elements by
| (3) |
In this case, and , where . In general, the penguin amplitude modifies both the magnitude and phase of , so that and , where depends on the magnitudes and relative strong and weak phases of the tree and penguin amplitudes. Several approaches have been proposed to obtain information on in the presence of penguins [8].
2 The BABAR detector and dataset
The data sample used in this analysis consists of , corresponding to million pairs, collected on the resonance with the BABAR detector at the SLAC PEP-II storage ring between October 1999 and December 2001. Equal branching fractions for and are assumed.
A detailed description of the BABAR detector is presented in [9]. Charged particle (track) momenta are measured in a tracking system consisting of a 5-layer double-sided silicon vertex tracker (SVT) and a 40-layer drift chamber (DCH) filled with a gas mixture of helium and isobutane. The SVT and DCH operate within a superconducting solenoidal magnet. Photons are detected in an electromagnetic calorimeter (EMC) consisting of 6580 CsI(Tl) crystals arranged in barrel and forward endcap subdetectors. The flux return for the solenoid is composed of multiple layers of iron and resistive plate chambers for the identification of muons and long-lived neutral hadrons. Tracks from the decay are identified as pions or kaons by the Cherenkov angle measured with a detector of internally reflected Cherenkov light (DIRC).
3 Analysis method
Event selection is identical to that described in [7]. Candidate decays are reconstructed from pairs of oppositely-charged tracks forming a good quality vertex, where the four-vector is calculated assuming the pion mass for both tracks. We require each track to have an associated measurement with a minimum of six Cherenkov photons above background, where the average is approximately 30 for both pions and kaons. Protons are rejected based on and electrons are rejected based on measurements in the tracking system, shower shape in the EMC, and the ratio of shower energy and track momentum. Background from the reaction is suppressed by removing jet-like events from the sample: we define the center-of-mass (CM) angle between the sphericity axes of the candidate and the remaining tracks and photons in the event, and require , which removes of the background. The total efficiency for signal events of the above selection is approximately .
Signal decays are identified kinematically using two variables. We define a beam-energy substituted mass , where the candidate energy is defined as , and are the total energies of the system in the CM and laboratory frames, respectively, and and are the momentum vectors in the laboratory frame of the system and the candidate, respectively. Signal events are Gaussian distributed in with a mean near the mass and a resolution of , dominated by the beam energy spread. The background shape is parameterized by a threshold function [10] with a fixed endpoint given by the average beam energy.
We define a second kinematic variable as the difference between the energy of the candidate in the CM frame and . Signal decays are Gaussian distributed with a mean value near zero. For decays with one (two) kaons, the distribution is shifted relative to on average by (), respectively, where the exact separation depends on the laboratory momentum of the kaon(s). The resolution on is approximately and is validated in large samples of fully reconstructed decays. The background is parameterized by a quadratic function.
Candidate pairs selected in the region and are used to extract yields and -violating asymmetries with an unbinned maximum likelihood fit. The total number of events in the fit region satisfying all of the above criteria is .
To determine the flavor of the meson we use the same -tagging algorithm used in the BABAR analysis [11]. The algorithm relies on the correlation between the flavor of the quark and the charge of the remaining tracks in the event after removal of the candidate. We define five mutually exclusive tagging categories: Lepton, Kaon, NT1, NT2, and Untagged. Lepton tags rely on primary electrons and muons from semileptonic decays, while Kaon tags exploit the correlation in the process between the net kaon charge and the charge of the quark. The NT1 (more certain tags) and NT2 (less certain tags) categories are derived from a neural network that is sensitive to charge correlations between the parent and unidentified leptons and kaons, soft pions, or the charge and momentum of the track with the highest CM momentum. The addition of Untagged events improves the signal yield estimates and provides a larger sample for determining background shape parameters directly in the maximum likelihood fit.
The quality of tagging is expressed in terms of the effective efficiency , where is the fraction of events tagged in category and the dilution is related to the mistag fraction . Table 1 summarizes the tagging performance in a data sample of fully reconstructed neutral decays into and flavor eigenstates. We use the same tagging efficiencies and dilutions for signal , , and decays. Separate background efficiencies for each species are determined simultaneously with and in the maximum likelihood fit.
| Category | ||||
|---|---|---|---|---|
| Lepton | ||||
| Kaon | ||||
| NT1 | ||||
| NT2 | ||||
| Untagged | – | – | – | |
| Total |
The time difference is obtained from the measured distance between the positions of the and decay vertices and the known boost of the system. The position of the vertex is determined with an iterative procedure that removes tracks with a large contribution to the total . An additional constraint is constructed from the three-momentum and vertex position of the candidate, and the average interaction point and boost. For of candidates with a reconstructed vertex, the rms resolution is . We require and , where is the error on . The resolution function for signal candidates is a sum of three Gaussians, identical to the one described in [3], with parameters determined from a fit to the sample (including events in all five tagging categories). The background distribution is parameterized as the sum of an exponential convolved with a Gaussian, and two additional Gaussians to account for tails. A common parameterization is used for all tagging categories, and the parameters are determined simultaneously with the parameters in the maximum likelihood fit. We find that of background events are described by an effective lifetime of about , while tails are described by of events with a resolution of approximately .
Discrimination of signal from light-quark background is enhanced by the use of a Fisher discriminant [6]. The discriminating variables are constructed from the scalar sum of the CM momenta of all tracks and photons (excluding tracks from the candidate) entering nine two-sided -degree concentric cones centered on the thrust axis of the candidate. The distribution of for signal events is parameterized as a single Gaussian, with parameters determined from Monte Carlo simulated decays and validated with decays reconstructed in data. The background shape is parameterized as the sum of two Gaussians, with parameters determined directly in the maximum likelihood fit.
Identification of tracks as pions or kaons is accomplished with the Cherenkov angle measurement from the DIRC. We construct Gaussian probability density functions (PDFs) from the difference between measured and expected values of for the pion or kaon hypothesis, normalized by the resolution. The DIRC performance is parameterized using a sample of , decays, reconstructed in data. Figure 1 shows the typical separation between pions and kaons, which varies from at momenta of to at , where is the average resolution of .

4 Results
We use unbinned extended maximum likelihood fits to extract yields and parameters from the sample. The likelihood for candidate tagged in category is obtained by summing the product of event yield , tagging efficiency , and probability over the eight possible signal and background hypotheses (referring to , , , and decays),
| (4) |
For the components, the yield is parameterized as , where and . The probabilities are evaluated as the product of PDFs for each of the independent variables , where and are the Cherenkov angles for the positively and negatively charged tracks. We use identical PDFs for and . The total likelihood is the product of likelihoods for each tagging category and the free parameters are determined by minimizing the quantity .
4.1 Time-independent fit
In order to minimize the systematic error on the branching fraction measurements, we perform an initial fit without tagging or information. A total of parameters are varied in the fit, including signal and background yields (6 parameters) and asymmetries (2), and parameters for the background shapes in (1), (2), and (5).
Table 2 summarizes results for total efficiencies, signal yields and branching fractions. The upper limit on the signal yield for is given by the value of for which , where is the likelihood as a function of , maximized with respect to the remaining fit parameters. The branching fraction upper limit is calculated by increasing the signal yield upper limit and reducing the efficiency by their respective systematic errors.
| Mode | (%) | (Events) | () |
|---|---|---|---|
| ( C.L.) | ( C.L.) |
The fit result for the charge asymmetry is
| (5) |
The statistical and systematic errors on are added in quadrature when calculating the confidence level (C.L.).
The dominant systematic error on the branching fraction measurements is due to uncertainty in the shape of the PDF, while the dominant error on is due to possible charge bias in track and reconstruction. All measurements are consistent with our previous results reported in [6].
Figure 2 shows distributions of and after a cut on likelihood ratios.


We define and , where indicates a sum over signal (all) hypotheses, and indicates the probability for signal hypothesis . The probabilities include the PDFs for , , and when plotting . The selection is defined by optimizing the signal significance with respect to and . The solid curve in each plot represents the fit projection after correcting for the efficiency of the additional selection (approximately for and for ).
4.2 Time-dependent fit
The time-dependent asymmetries and are determined from a second fit including tagging and information, with the yields and fixed to the results of the first fit. The PDF for signal decays is given by Eq. (1), modified to include the dilution and dilution difference for each tagging category, and convolved with the signal resolution function. The PDF for signal events takes into account – mixing, depending on the charge of the kaon and the flavor of . We parameterize the distribution in decays as an exponential convolved with the resolution function.
A total of parameters are varied in the fit, including the values of and , separate background tagging efficiencies for , , and events , parameters for the background resolution function , and parameters for the background shapes in , , and . The signal tagging efficiencies and dilutions are fixed to the values in Table 1, while and are fixed to their PDG values [12]. For each parameter, we also calculate the C.L. interval taking into account the systematic error. The fit yields
| (6) |
and the correlation between and is .
Systematic uncertainties on and are dominated by the uncertainty on the shape of the PDF. Since we measure asymmetries near zero, multiplicative systematic errors have also been evaluated . We sum in quadrature multiplicative errors, evaluated at one standard deviation, with the additive systematic uncertainties.
To validate the analysis technique, we measure and in the sample and find and . Figure 3 shows the asymmetry in a sample of events enhanced in decays.
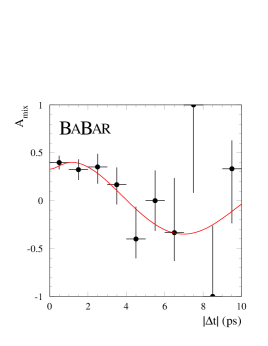
The curve shows the expected oscillation given the value of measured in the full sample.
For tagged events enhanced in signal decays, Figure 4 shows the distributions and the asymmetry . The selection procedure is the same as for Figure 2, with the likelihoods defined including the PDFs for , , , and .

5 Summary
In summary, we have presented updated preliminary measurements of branching fractions and -violating asymmetries in , , and decays. All results are consistent with our previous measurements. No evidence for violation is observed and our measurement of disfavors theoretical models that predict a large asymmetry [13, 14].
We are grateful for the extraordinary contributions of our PEP-II colleagues in achieving the excellent luminosity and machine conditions that have made this work possible.
References
- [1] BABAR Collaboration, B. Aubert et al., Phys. Rev. Lett. 87, 091801 (2001).
- [2] BELLE Collaboration, K. Abe et al., Phys. Rev. Lett. 87, 091802 (2001).
- [3] BABAR Collaboration, B. Aubert et al., hep-ex/0203007 (2002).
- [4] BELLE Collaboration, T. Higuchi, hep-ex/0205020 (2002).
- [5] N. Cabibbo, Phys. Rev. Lett. 10, 531 (1963); M. Kobayashi and T. Maskawa, Prog. Th. Phys. 49, 652 (1973).
- [6] BABAR Collaboration, B. Aubert et al., Phys. Rev. Lett. 87, 151802 (2001).
- [7] BABAR Collaboration, B. Aubert et al., Phys. Rev. D 65, 051502 (2002).
- [8] M. Gronau and D. London, Phys. Rev. Lett. 65, 3381 (1990); Y. Grossman and H.R. Quinn, Phys. Rev. D 58, 017504 (1998); J. Charles, Phys. Rev. D 59, 054007 (1999); M. Gronau, D. London, N. Sinha, and R. Sinha, Phys. Lett. B 514, 315 (2001); M. Beneke, G. Buchalla, M. Neubert, and C.T. Sachrajda, Nucl. Phys. B 606, 245 (2001).
- [9] BABAR Collaboration, B. Aubert et al., Nucl. Instr. and Methods A 479, 1 (2002).
- [10] ARGUS Collaboration, H. Albrecht et al., Z. Phys. C 48, 543 (1990).
- [11] BABAR Collaboration, B. Aubert et al., hep-ex/0201020, accepted by Phys. Rev. D.
- [12] Particle Data Group, D.E. Groom et al., Eur. Phys. Jour. C 15, 1 (2000).
- [13] Y.Y. Keum, H-n. Li, and A.I. Sanda, Phys. Rev. D 63, 054008 (2001).
- [14] M. Ciuchini et al., Phys. Lett. B 515, 33 (2001).