Latest Results from the K2K experimentaaaTalk presented at the XXXVIIth Rencontres de Moriond ”Electroweak Interactions and Unified Theories”, Les Arcs, Savoie, France, March 9-16, 2002.
The KEK to Kamioka long-baseline neutrino experiment (K2K) is the first accelerator-based experiment with hundreds of km neutrino path length. K2K focuses on the study of the existence of neutrino oscillations in disappearance that is observed in atmospheric neutrinos. With nearly pure muon neutrino beam produced with protons from 12 GeV PS on target, 56 neutrino events have been observed at Super-Kamiokande, the far detector at 250 km distance. The expectation is derived from the measurement at the near site. The experiment expects to accumulate protons on target, providing sufficient statistics to study neutrino oscillations by spectral analysis for disappearance.
1 Introduction
The existence of neutrino oscillations implies that neutrinos are massive and that flavor and mass eigenstates are mixed in the lepton sector, too. Experiments on atmospheric neutrinos have found a significant deficit in the flux of which have travelled an earth scale distance. The interpretation of these results provides not only strong evidence of (or ) oscillations but also evidence for different mixing properties in the lepton and quark sectors. For a neutrino energy and a distance from the source , the oscillation probability can be written in terms of the mixing angle and the difference of the squared masses (eV2) in two flavor approximation as .
The KEK to Kamioka long-baseline neutrino experiment (K2K) is the first accelerator-based experiment with hundreds of km neutrino path length. The intense, nearly pure neutrino beam (98.2% , 1.3% , and 0.5% ) has an average . The neutrino beam properties are measured just after production, and the kinematics of parent pions are measured in situ to extrapolate the measurements at the near detector to the expectation at the far detector. K2K focuses on the study of the existence of neutrino oscillations in disappearance that is observed in atmospheric neutrinos, and on the search for oscillation with well understood flux and neutrino composition in the region. In this paper, the results on the event rates with data taken from June 1999 to July 2001 corresponding to protons on target are described.
2 Experimental Setup and Analysis
The K2K neutrino beam is a horn-focused wide band beam. Figure 1 shows the setup at KEK site. The primary beam for K2K is 12 GeV kinetic energy protons from the KEK proton-synchrotron (KEK-PS). Every 2.2 s, approximately protons in nine bunches are fast-extracted in a single turn, making a 1.1 beam spill. These protons are focused onto a 30 mm diameter, 66 cm long aluminum target which is a current carrying element in the first of a pair of horn magnets operating at 250 kA. This design maximizes the efficiency of the toroidal magnetic field to focus positive pions produced in proton-aluminum interactions, while sweeping out negative secondary particles.
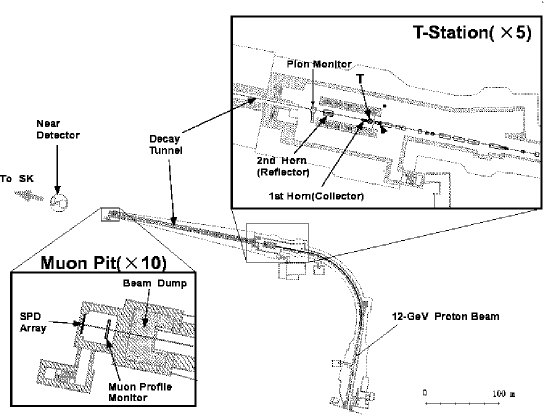
Downstream of the horn system, before the 200 m long decay volume where the pions decay to and muons, a gas-Cherenkov detector (PIMON) is occasionally put in the beam to measure the kinematics of the pions after their production and subsequent focusing. After the decay volume, an iron and concrete beam dump stops essentially all charged particles except muons with an energy greater than 5.5 GeV. Downstream of the dump there is a “muon monitor” (MUMON) consisting of a segmented ionization chamber and an array of silicon pad detectors. This monitors the residual muons spill-by-spill to check beam centering and muon yield. The ionization chamber consists of 5 cm wide strips covering roughly area with separate planes for horizontal and vertical read-out. The 26 silicon pads, each of transverse area, are distributed through a area.
Neutrino interactions near the production site are measured by a set of detectors with complementary abilities. The detectors are located approximately 300 m from the pion production target with approximately 70 m of earth eliminating virtually all prompt beam products other than neutrinos. A one kiloton water Cherenkov detector (1kt) uses the same technology and analysis algorithms as the far detector, Super–Kamiokande (SK). It has 680 20” photomultiplier tubes (PMTs) on a 70 cm grid lining a diameter, high cylinder. The PMTs themselves and their arrangement are the same as in SK, giving the same fractional coverage by photo-cathode (40%). A scintillating fiber detector (SciFi) with a 6 ton water target has tracking capability, and allows discrimination between different types of interactions such as quasi-elastic or inelastic. Downstream of the SciFi there is a lead glass array for tagging electromagnetic showers. A muon range detector (MRD), measures the energy, angle, and production point of muons from charged current (CC) interactions. It covers transverse area with four 10-cm iron plates, followed by eight 20-cm iron plates, all interleaved with drift tubes. The total mass is 915 tons. The 6632 drift tubes each has cross section, and are arranged in horizontal and vertical read-out planes.
The far detector for K2K is the SK detector located in the Kamioka Observatory, Institute for Cosmic Ray Research (ICRR), University of Tokyo, which has been taking data since 1996. Its performance and results have been documented in the literature. Event selection for this detector uses timing synchronization with the KEK-PS via the Global Positioning System (GPS).
The beam-line was aligned by GPS position survey. The precision of this survey for the line from the target to the far detector is better than 0.01 mr and the construction precision for the near site alignment is better than 0.1 mr. The predicted neutrino spectrum at 250 km is approximately the same over nearly 1 km, giving a required accuracy of for the pointing of the beam.
The steering and the monitoring of the beam are carried out based on the MUMON measurement. The and muons in the decay volume originate from the same pion decays, so the measured center position of the muon profile is correlated with the beam direction. The r.m.s. muon profile width is for both the horizontal and vertical directions. These measurements are used in tuning the beam direction at the start of every beam period, usually once per month. During beam tuning, the primary proton position at the target is adjusted so that the muon profile is centered on the SK direction within 0.1 mr. The center of the muon profile is measured to be stable spill-by-spill within in each dimension throughout the whole experimental period. The stability of the muon yield is directly related to the stability of the horn-focused beam. The yield normalized to proton intensity measured by a current transformer is stable spill-by-spill within a measurement uncertainty of .
The characteristics and stability of the beam itself are directly monitored at the near site by the MRD using interactions with iron. The large transverse area of MRD makes it possible to measure the beam direction and width (profile), and the large mass makes it possible to measure the time stability of the event rate, profile and spectrum. The location of the center of the profile gives the beam direction. For the profile measurement, the starting point of a reconstructed muon track is regarded as the vertex of the -iron interaction. The vertex distribution is corrected for geometrical acceptance to obtain the beam profile. The direction has been stable within mr throughout all data-taking periods. The measured rate of -iron events is typically 0.05 events/spill and can be monitored on a daily basis with good statistics. The event rate normalized to proton intensity is stable within the statistical error of the MRD measurement. The muon energy and angular distributions are also continuously monitored. They show no change as a function of time, implying the energy spectrum is stable throughout this period.
Comparison between expected and observed numbers of events at the far site is done with this knowledge of measured beam stability. To predict the beam characteristics at the far site, a normalization measurement at the near site and the extrapolation of the information from near to far are necessary. For the rate normalization, the 1kt is used so that any detector or analysis bias is suppressed. For the extrapolation, the beam simulation is used, which is validated by the PIMON measurement as described below. This simulation is based on GEANT with detailed description of materials and magnetic fields in the target region and decay volume. It uses as input a measurement of the primary beam profile at the target. Primary proton interactions on aluminum are modeled with a parameterization of hadron production data. Other hadronic interactions are treated by GEANT-CALOR.
Once the kinematic distribution of pions after production and focusing is known, it is possible to predict the spectrum at any distance from the source. The pion momentum and angular distribution is measured by the PIMON. Cherenkov photons generated by pions in the detector are focused by a pie-shaped spherical mirror to an array of PMTs of 8 mm effective diameter in its focal plane. Photons emitted by particles with the same velocity and incident angle with respect to the mirror arrive at the same position in the focal plane. This is independent of photon incident position with respect to the mirror. The photon distribution on the PMT array is a superposition of slices of the Cherenkov rings from particles of various velocities and angles. Measurements are made at seven indices of refraction, controlled by gas pressure, to give additional information on the velocity distribution of the particles. The indices of refraction are chosen so that the corresponding pion momentum interval is 400 MeV/c. The pion two-dimensional distribution of momentum versus angle is derived by unfolding the photon distribution data with various indices of refraction. To avoid background from 12 GeV primary protons, the index of refraction is adjusted below the Cherenkov threshold of 12 GeV protons . As a consequence, analysis is done for , giving the energy spectral shape above 1 GeV. Figure 2 shows the inferred energy spectral shape at the near site and the far to near flux ratio along with the beam simulation result. The beam simulation is well validated by the PIMON measurement without any tuning.

The interaction rate at the near site is measured in the 1kt by detecting Cherenkov light emitted from produced charged particles. The vertices and directions of Cherenkov rings are reconstructed with the same methods as in SK. In the 1kt, however, an analog sum of signals from all PMTs is recorded by an FADC to select beam spills with only one event. The definition of events per spill is the number of peaks of the FADC signal with collected photo-electrons (p.e.) ( deposited energy). The average number of events observed in the full detector is about 0.2/spill including entering background events due to cosmic rays or induced muons from upstream (about 1.5% of events in the fiducial volume defined below). Thus events occur in about 10% of those spills with event. Neutrino interactions are selected by requiring: a) There is no detector activity in the preceding the beam spill. b) Only a single event is observed in the FADC peak search for that spill. c) The reconstructed vertex is inside the 25 t fiducial volume defined by a 2 m radius, 2 m long cylinder along the beam axis, in the upstream side of the detector. The detection efficiency of the 1kt detector for detecting CC interactions is 87% and for neutral current inelastic () interactions it is 55%. The expected ratio of CC to gives an overall efficiency of 72%. The main source of inefficiency is the 1000 p.e. threshold of the peak search in the FADC signal. The neutrino interaction simulator used for efficiency calculations is the same as that used in all SK analyses. Finally the number of events in 1kt is corrected for spills with multiple events. The average event rate per proton hitting the target is . Correcting for efficiencies, relative target masses, and detector live times, the expected signal at the far site is estimated by applying the extrapolation from the experimentally validated beam simulation.
Accelerator-produced neutrino interactions at the far site, SK, are selected by comparing two Universal Time Coordinated (UTC) time stamps from the GPS system, for the KEK-PS beam spill start time and for the SK trigger time. The time difference between two UTC time stamps, where is the time of flight of a neutrino, should be distributed around the interval from to match the width of the beam spill of the KEK-PS. Since the measured uncertainty of the synchronization accuracy for the two sites is beam-induced events are selected in a window.

Data reduction similar to that used in atmospheric neutrino analyses at SK is applied to select fully contained (FC) neutrino interactions. The criteria are: a) There is no detector activity within 30 s before the event. b) The total collected p.e. in a 300 ns time window is ( deposited energy). c) The number of PMTs in the largest hit cluster in the outer-detector is . d) The deposited energy is MeV. Finally, a fiducial cut is applied accepting only events with fitted vertices inside the same volume used for SK atmospheric neutrino analysis. The detection efficiency of SK is 93% for CC interactions and 68% for interactions, for a total of 79%. Similarly to the 1kt, the inefficiency is mainly due to the energy cut. Figure 3 shows the distribution at various stages of the reduction. A clear peak in time with the neutrino beam from the KEK-PS is observed in the analysis time window.
In order to compare the expected and observed spectrum, the neutrino energy was reconstructed for the 1-ring -like FC events in the SK fiducial volume assuming charged-current quasi-elastic interaction (). For this interaction, the initial neutrino energy can be calculated from the momentum() and angle( of the outgoing muons as
| (1) |
where and are masses of nucleon and muon, respectively. It should be noted that for non-quasi-elastic interaction events, the neutrino energy is underestimated. The expected spectrum was made from the beam and neutrino interaction MC simulation. Overall normalization was done using the event rate measurement at the 1kt.
3 Results
Fifty-six FC events are observed in the fiducial volume. The selection window gives an expected background from atmospheric neutrino interactions of order events.
The systematic uncertainty of the 1kt measurement is 4%, for which the leading terms are due to vertex fitting and its effect on the fiducial cut. Other sources such as energy scale uncertainty and the treatment of multiple events in a spill are relatively small. The statistical uncertainty of the 1kt measurement is . The systematic uncertainty of the extrapolation from the near site measurement is estimated to be based on the PIMON measurement uncertainty and beam simulation uncertainty for low energy neutrinos. The systematic uncertainty in the SK measurement is , mainly due to the fiducial cut. The systematic uncertainty term coming from uncertainty in the neutrino energy spectrum and cross section is small due to cancellations. The quadrature sum of all known uncertainties for the far site event rate prediction is The resulting expectation is events in the absence of neutrino oscillations. The observed and expected numbers for various categories are summarized in Table 1. The number of Cherenkov rings and particle identification are reconstructed by the same algorithms as those used at SK, and the event category definitions are also the same. The expected number of events for analyses of CC interactions in the other near detectors are for MRD (iron target) and for SciFi (water target), each of which is consistent with the value based on 1kt analysis.
| Event Category | Observed | Expected |
|---|---|---|
| Single Ring -like | 30 | 44.06.8 |
| Single Ring -like | 2 | 4.41.7 |
| Multi Ring | 24 | 32.25.3 |
| TOTAL | 56 |
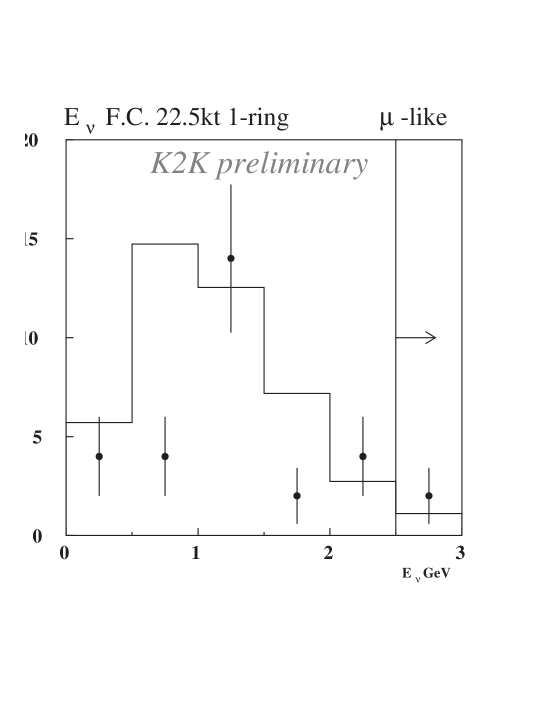
Figure 4 shows the reconstructed spectrum for the 1-ring -like FC events in the SK fiducial volume. The histogram in the figure is the one expected from the beam and neutrino interaction MC. The difference between the expected and observed spectrum indicates the distortion due to the neutrino oscillation.
4 Conclusion and Future Prospect
The crucial principles of K2K have been proven to work: The beam direction has been continuously monitored and controlled within for several months duration by controlling the proton position on target with millimeter accuracy and operating the horn magnet stably. Pion kinematics have successfully been measured in situ allowing prediction of the neutrino beam at the distance of 250 km with six to seven percent accuracy. Events at the far site have been identified by means of GPS timing, reducing backgrounds to a negligible level. Fifty-six FC neutrino events have been observed where are expected. The study of the spectral shape for the oscillation analysis is now on going. In order to confirm the neutrino oscillation phenomena and to determine the oscillation parameter precisely, the beam spectral shape, neutrino interaction and their errors are being carefully studied. For more complete study of the beam spectrum and neutrino interaction, a new fine-grained(2cm) detector will be installed in 2003. It consists of 3m long plastic scintillator bars and wavelength shifter fibers. The experiment expects to accumulate protons on target, providing sufficient statistics to study neutrino oscillations by spectral analysis for disappearance.
Acknowledgments
We thank the KEK and ICRR Directors for their strong support and encouragement. K2K is made possible by the inventiveness and the diligent efforts of the KEK-PS machine group. We gratefully acknowledge the cooperation of the Kamioka Mining and Smelting Company. This work has been supported by the Ministry of Education, Culture, Sports, Science and Technology, Government of Japan and its grants for Scientific Research, the Japan Society for Promotion of Science, the U.S. Department of Energy, the Korea Research Foundation, and the Korea Science and Engineering Foundation.
References
References
- [1] K.S.Hirata et al., Phys. Lett. B205, 416 (1988); K.S.Hirata et al., Phys. Lett. B280, 146 (1992); Y.Fukuda et al., Phys. Lett. B335, 237 (1994); S.Hatakeyama et al., Phys. Rev. Lett. 81, 2016 (1998); Y.Fukuda et al., Phys. Rev. Lett. 82, 2644 (1999); Y.Fukuda et al., Phys. Lett. B467, 185 (1999); D.Casper et al., Phys. Rev. Lett. 66, 2561 (1991); R.Becker-Szendy et al., Phys. Rev. D46, 3720 (1992); W.W.M.Allison et al., Phys. Lett. B449, 137 (1999); M.Ambrosio et al., Phys. Lett. B434, 451 (1998).
- [2] Y.Fukuda et al., Phys. Lett. B433, 9 (1998).
- [3] Y.Fukuda et al., Phys. Lett. B436, 33 (1998).
- [4] Y.Fukuda et al., Phys. Rev. Lett. 81, 1562 (1998).
- [5] S.Fukuda et al., Phys. Rev. Lett. 85, 3999 (2000).
- [6] S. H. Ahn et al., Phys. Lett. B511, 178 (2001).
- [7] H.Noumi et al., Nucl. Instr. and Meth. A398, 399 (1997).
- [8] M.Ieiri et al., Proc. 1st Asian Particle Accelerator Conference (1998).
-
[9]
H. Sato,
Proc. Particle Accelerator Conference (1999);
K. Takayama, ICFA Beam Dynamics Newsletter No.20, (1999). - [10] Y.Yamanoi et al., Proc. 15th International Conference on Magnet Technology (1997); Y.Yamanoi et al., IEEE Transactions on Applied Superconductivity 10, 252 (2000); Y.Suzuki et al., Proc. International Conference on Accelerator and Large Experimental Physics Control Systems (ICALEPCS) (1997); Proc. ICALEPCS (1999).
- [11] T.Maruyama, Ph.D. Thesis, Tohoku University (2000); K2K Beam Monitor Group, in preparation.
- [12] A.Suzuki et al., Nucl. Instr. and Meth. A453, 165 (2000).
- [13] T. Ishii et al., Nucl. Instr. and Meth. A482, 244 (2002).
- [14] H.G.Berns and R.J.Wilkes, IEEE Nucl. Sci. 47, 340 (2000).
- [15] R. Brun et al., CERN DD/EE/84-1 (1987).
- [16] J.R.Sanford and C.L.Wang, BNL AGS internal reports No.BNL11299 and No.BNL11479 (1967); C.L.Wang, Phys. Rev. Lett. 25, 1068 (1970); Y.Cho et al., Phys. Rev. D4, 1967 (1971); J.G.Asbury et al., Phys. Rev. 178, 2086 (1969); G.J.Marmer et al., Phys. Rev. 179, 1294 (1969); G.J.Marmer and D.E.Lundquist, Phys. Rev. D3, 1089 (1971); J.V.Allaby et al., CERN-TH-70-12 (1970).
- [17] T.A.Gabriel et al., ORNL/TM-11185; C.Zeitnitz and T.A.Gabriel, Nucl. Instr. and Meth. A349, 106 (1994).
- [18] K2K Collaboration, in preparation.