NEW RESULTS FROM K2K
Abstract
During the first half of the K2K run, data corresponding to POT were accumulated. In this data set, 56 accelerator-produced neutrino events were observed in the far detector, while the expected number from the near site measurements is . This means that the probability of the null-oscillation scenario is limited to less than 3%. A method for long-baseline neutrino experiments has been established.
1 Introduction
K2K[1] is the first accelerator-based long-baseline neutrino experiment, of which the baseline is 250 km between the KEK 12-GeV proton synchrotron (KEK-PS) and the Super-Kamiokande (SK) detector. The atmospheric neutrino anomaly found by the Kamiokande experiment[2] triggered various studies of neutrino oscillation in the region – , where is the difference of the squared masses. Among them, the SK experiment[3] confirmed the deficit of the upward-going atmospheric s and announced evidence for oscillation of the atmospheric neutrino. For the neutrino energy ((GeV)) and flight length ((km)), the oscillation probability can be written in terms of the mixing angle () and in a two-flavor approximation as follows:
| (1) |
K2K aims to firmly establish neutrino oscillation in the -disappearance mode and in the -appearance mode, with a well-defined flight length and a well-controlled and understood nearly pure beam. The average neutrino energy is 1.3 GeV and the beam composition is 98.2%, 1.3% and 0.5%.
2 Detectors
At the near site, 12-GeV protons are extracted from the KEK-PS in
a 1.1-sec spill every 2.2 seconds. The extracted protons are
bent to the Kamioka direction and injected into an Al target
of a 30 mm diameter and 66 cm length.
A pair of horn magnets focuses produced positive pions,
which subsequently decay into muons and s.
A pion monitor is occasionally put into
the beam line just after the horn magnets.
The pion monitor is a gas-Cherenkov detector, which measures
the momentum and angular distributions of pions.
From this measurement, it gives the far/near ratio of the neutrino flux
as a function of the neutrino energy. A measurement is made
when the beam parameters are changed.[4]
A muon monitor is located after a 200 m decay pipe and a beam dump.
The muon monitor consists of a segmented ionization chamber and
a silicon pad detector array. It provides spill-by-spill monitoring
of the intensity and direction of the beam.
A set of near neutrino detectors is located 300 m from the target.
It consists of a 1kton-water-Cherenkov detector (1kt),
a scintillating fiber tracker with a water target (SCIFI),[5]
lead-glass counters and
a muon range detector (MRD).[6]
The 1kt is used to measure the neutrino flux at the near site
to normalize the event rate at the far site while taking advantage of being
the same type detector as the SK.
Since the MRD is massive and has large-area coverage,
it is used to monitor the neutrino beam.
The SCIFI together with the MRD is used to study
neutrino interactions.
K2K uses the SK as a far neutrino detector.
It is a 50 kton water-Cherenkov detector comprising 11 thousand inner
PMTs and 18 hundred outer PMTs.
3 New results
3.1 Delivered beam
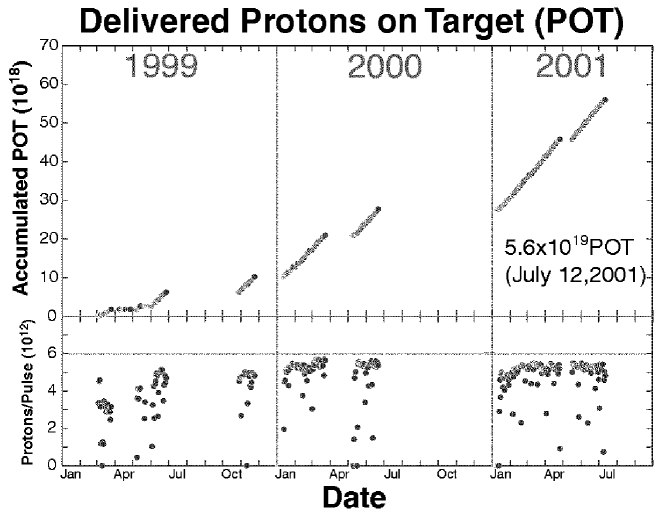
Fig. 1 shows the delivered protons on the target (POT) as a function of time. The top plot shows the integrated POT and the bottom plot shows the instantaneous POT. The instantaneous POT has nearly reached its design value of protons/pulse. Data corresponding to POT are used for analyses, which were accumulated during the period between June 1999 and July 2001. The goal is to accumulate POT for analyses.
3.2 Beam stability
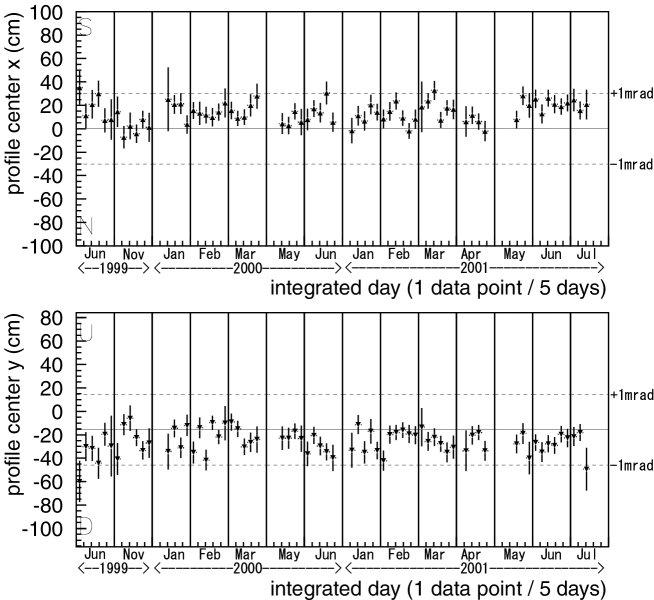
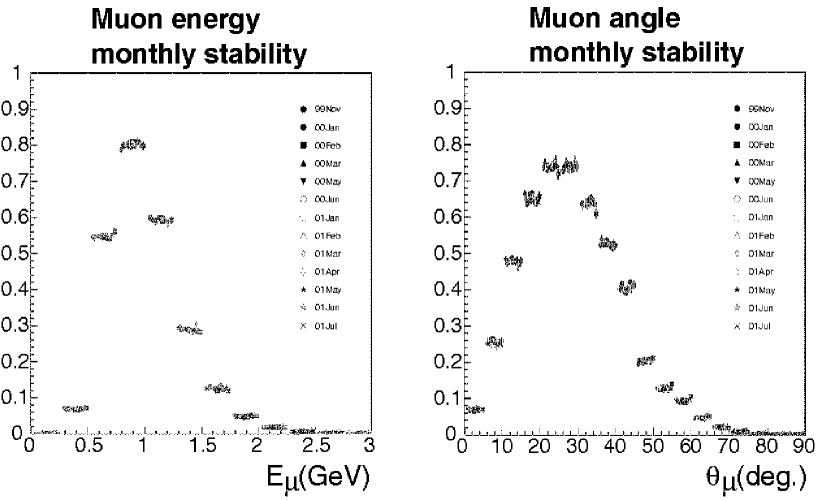
The neutrino beam direction has been monitored by the MRD by watching the neutrino profile center using interactions with iron. As shown in fig. 2, the neutrino beam has been directed to the SK detector within rad. It has also been confirmed pulse-by-pulse by the muon monitor by watching the muon profile center. This is sufficient direction stability for the experiment. The MRD has also monitored the neutrino event rate, and shows good stability. Fig. 3 shows the energy and angular distributions of muons produced by the charged-current interaction, which were measured by the MRD and plotted monthly. Both energy and angular distributions show good stability, which implies that the neutrino spectrum has been stable.
3.3 SK events
Accelerator-produced neutrino events at the SK detector are selected essentially using the timing information of the global positioning system (GPS). Other selection cuts are the same as the atmospheric neutrino analysis. Fig. 4 shows the time-difference distribution between the beam spill start and the SK event occurrence after each selection cut.
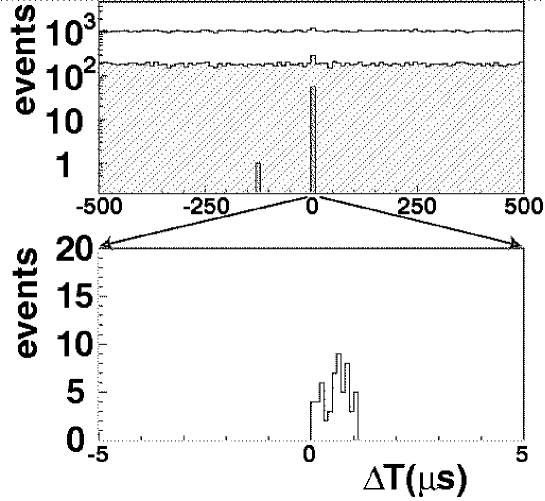
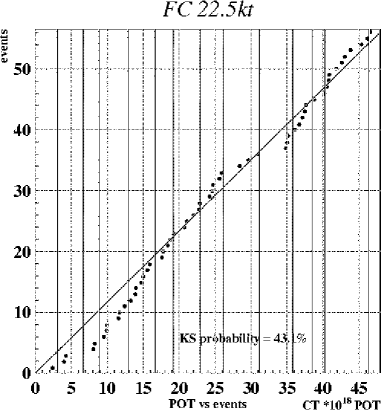
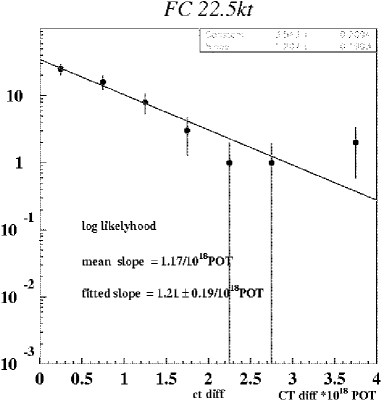
After all cuts we can see a bunch of events in the sec range, which corresponds to the beam spill length. In the fiducial volume of 22.5 kton, 56 fully contained events were observed, which breaks down into 30 single-ring -like events, 2 single-ring e-like events and 24 multi-ring events. Fig. 5(left) shows the SK event number as a function of the accumulated POT. Fig. 5(right) shows the distribution of the interval between two consecutive events. It fits to an exponential shape quite well, as expected. This means that the fluctuation of the event rate is statistical.
3.4 Results from event numbers
A summary of the results is listed in table 1.
We observed 56 SK events, while the expectation from the 1kt
measurement extrapolated by the pion monitor measurement is
.
This means that the probability of the null-oscillation scenario is
less than 3%.
We observed 2 single-ring e-like events at SK. This is consistent
with the Monte-Carlo expectation, suggesting that these events are
from the neutral-current interaction with water.
| observed | expected w/o osci | ||
|---|---|---|---|
| 1-ring -like | 30 | 24.4 | |
| 1-ring e-like | 2 | 3.7 | |
| multi-ring | 24 | 24.3 | |
| total | 56 | 52.4 |
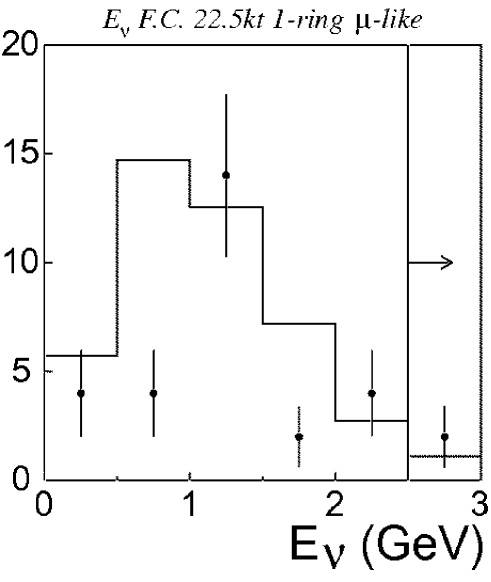
3.5 Spectrum analysis
For a quasi-elastic event, , one can calculate the neutrino energy from the muon energy and angle by the following equation:
| (2) |
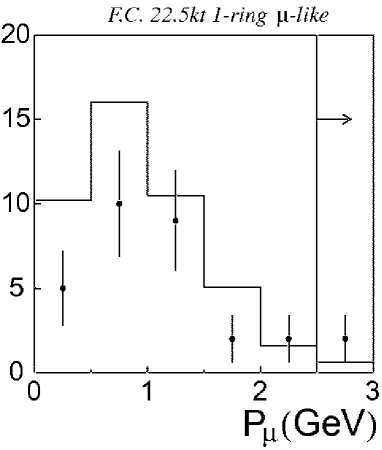
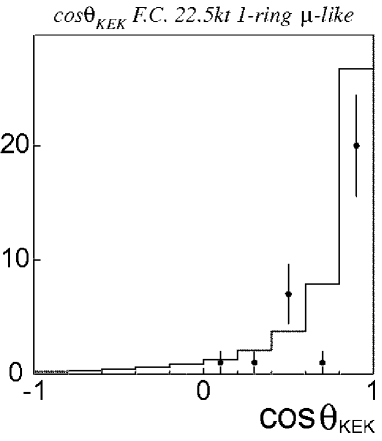
For SK events, in order to enhance the quasi-elastic events, we select single-ring -like events. Fig. 6 shows the muon momentum and angular distributions. Fig. 7 shows the reconstructed distribution calculated by equation 2. The histograms in the figures show the tentative Monte-Carlo calculation assuming no oscillation. A derivation of the spectrum expectation from the near-site measurements is under way while taking into account of the correct error correlation and the ambiguity of the neutrino interaction.
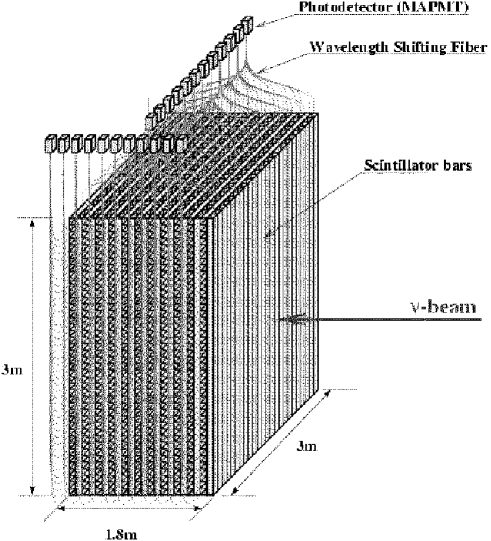
4 Near-detector upgrade
If , as is indicated by atmospheric neutrino analyses, the first oscillation minimum appears at around GeV in the K2K experiment. It is desirable to monitor the neutrino energy spectrum down to this low-energy region at the near site. For this purpose, we are going to install a full-active scintillator-bar tracker (SCIBAR). SCIBAR will replace the lead-glass counters. As shown in fig. 8, the detector is made of fine segmented scintillator bars. It can detect a proton down to 350 MeV/c. Protons can be identified by a dE/dx measurement.
5 Run plan
In order to firmly establish neutrino oscillation, K2K will accumulate POT, which corresponds to additional 18-month runs. In spite of the unfortunate accident of November 2001, the SK detector is being rebuilt while aiming at a restart within one year.[7] The upgraded detector SCIBAR will be ready by the summer of 2003.
6 Conclusion
During the first half of the K2K run until summer 2001,
data corresponding to
POT were accumulated for analyses.
In this data set, 56 accelerator-produced neutrino
events were observed in the far detector,
while the expected number from the near site measurements is
.
This means that the probability of the null-oscillation scenario is
limited to less than 3%.
We can declare that a method for long-baseline neutrino experiments
has been established. Namely, beam monitoring and handling towards
the detector 250 km away, synchronization of the far detector
with the accelerator by the GPS and spectrum and flux extrapolation
from the near site to the far site.
An oscillation analysis by studying near and far spectra is under way.
7 Acknowledgements
We thank the KEK and ICRR Directorates for their strong support and encouragement. K2K is made possible by the inventiveness and the diligent efforts of the KEK-PS machine group. We gratefully acknowledge the cooperation of the Kamioka Mining and Smelting Company. This work has been supported by the Ministry of Education, Culture, Sports, Science and Technology, Government of Japan and its grants for Scientific Research, the Japan Society of Promotion of Science, the U.S. Department of energy, the Korea Research Foundation, and the Korea Science and Engineering Foundation.
References
-
1 .
S. H. Ahn et al., Phys. Lett. B 511, 178 (2001);
T. Ishii, Proc. the 36th Rencontres de Moriond ”Electroweak Interactions and Unified Theories”, Les Arcs, Savoie, France, (2001), (KEK-Preprint 2001-29, hep-ex/0106008);
K. Nishikawa et al., KEK-PS proposal (E362) (1995). - 2 . K. S. Hirata et al., Phys. Lett. B 205, 416 (1988).
- 3 . Y. Fukuda et al., Phys. Rev. Lett. 81, 1562 (1998).
- 4 . T. Maruyama, Ph.D. Thesis, Tohoku University (2000).
- 5 . A. Suzuki et al., Nucl. Instr. and Meth. A 453, 165 (2000).
- 6 . T. Ishii et al., Nucl. Instr. and Meth. A 482, 244 (2002).
- 7 . Y. Totsuka, http://www-sk.icrr.u-tokyo.ac.jp/news/appeal.html.