Measurement of the Production Cross Section in 920 GeV Fixed-Target Proton-Nucleus Collisions
Abstract
Using the HERA B detector, the production cross section has been measured in 920 GeV proton collisions on carbon and titanium targets. The production was tagged via inclusive bottom quark decays into by exploiting the longitudinal separation of decay vertices from the primary proton-nucleus interaction. Both and channels have been reconstructed and the combined analysis yields the cross section .
keywords:
hadroproduction, bottom mesonsPACS:
13.85.Ni 13.85.Qk 13.20.He 24.85.+pDESY-02-076
hep-ex/0205106
31st-May-2002
I. Abt28, A. Abyzov26, M. Adams11, H. Albrecht13, V. Amaral8, A. Amorim8, S. J. Aplin13, A. Arefiev25, I. Ariño2, M. Atiya36, V. Aushev18, Y. Bagaturia13,43, R. Baghshetsyan13,44, V. Balagura25, M. Bargiotti6, S. Barsuk25, O. Barsukova26, V. Bassetti12, J. Bastos8, C. Bauer15, Th. S. Bauer32,33, M. Beck30, A. Belkov26, Ar. Belkov26, I. Belotelov26, I. Belyaev25, K. Berkhan34, A. Bertin6, B. Bobchenko25, M. Böcker11, A. Bogatyrev25, G. Bohm34, C. Borgmeier5, M. Bräuer15, D. Broemmelsiek12, M. Bruinsma32,33, M. Bruschi6, P. Buchholz11, M. Buchler10, T. Buran29, M. Capeáns13, M. Capponi6, J. Carvalho8, J. Chamanina27, B. X. Chen4, R. Chistov25, M. Chmeissani2, A. Christensen29, P. Conde2, C. Cruse11, M. Dam9, K. M. Danielsen29, M. Danilov25, S. De Castro6, H. Deckers5, K. Dehmelt13, H. Deppe16, B. Dolgoshein27, X. Dong3, H. B. Dreis16, M. Dressel28, D. Dujmic1, R. Eckmann1, V. Egorytchev13, K. Ehret15,11, V. Eiges25, F. Eisele16, D. Emeliyanov13, S. Erhan22, S. Essenov25, L. Fabbri6, P. Faccioli6, W. Fallot-Burghardt15, M. Feuerstack-Raible 16, J. Flammer13, H. Fleckenstein13, B. Fominykh25, S. Fourletov27, T. Fuljahn13, M. Funcke11, D. Galli6, A. Garcia2, Ll. Garrido2, D. Gascon2, A. Gellrich34,5,13, K. E. K. Gerndt13, B. Giacobbe6, J. Gläß24, T. Glebe15, D. Goloubkov13,39, A. Golutvin25, I. Golutvin26, I. Gorbounov31, A. Gorišek19, O. Gouchtchine25, D. C. Goulart7, S. Gradl16, W. Gradl16, Yu. Guilitsky25,13,41, T. Hamacher13,1, J. D. Hansen9, R. Harr10, C. Hast13, S. Hausmann16, J. M. Hernández13,34, M. Hildebrandt16, A. Hölscher16, K. Höpfner13, W. Hofmann15, M. Hohlmann13, T. Hott16, W. Hulsbergen33, U. Husemann11, O. Igonkina25, M. Ispiryan17, S. İşsever11, H. Itterbeck13, J. Ivarsson23,34, T. Jagla15, Y. Jia3, C. Jiang3, A. Kaoukher27,30, H. Kapitza11, S. Karabekyan13,44, P. Karchin10, N. Karpenko26, Z. Ke3, S. Keller31, F. Khasanov25, H. Kim1, Yu. Kiryushin26, I. Kisel28, F. Klefenz15, K. T. Knöpfle15, V. Kochetkov25, H. Kolanoski5, S. Korpar21,19, C. Krauss16, P. Kreuzer22,13, P. Križan20,19, D. Krücker5, T. Kvaratskheliia25, A. Lange31, A. Lanyov26, K. Lau17, G. Leffers15, I. Legrand34, B. Lewendel13, Y. Q. Liu4, T. Lohse5, R. Loke5, B. Lomonosov13,38, J. Lüdemann13, R. Männer24, R. Mankel5, U. Marconi6, S. Masciocchi28, I. Massa6, I. Matchikhilian25, G. Medin5, M. Medinnis13,22, M. Mevius32, A. Michetti13, Yu. Mikhailov25,13,41, R. Miquel2, R. Mizuk25, A. Mohapatra7, A. Moshkin26, B. Moshous28, R. Muresan9, S. Nam10, M. Negodaev13,38, I. Négri13, M. Nörenberg13, S. Nowak34, M. T. Núñez Pardo de Vera13, T. Oest14,13, A. Oliveira8, M. Ouchrif32,33, F. Ould-Saada29, C. Padilla13, P. Pakhlov25, Yu. Pavlenko18, D. Peralta2, R. Pernack30, T. Perschke28, R. Pestotnik19, B. AA. Petersen9, M. Piccinini6, M. A. Pleier15, M. Poli37, V. Popov25, A. Pose34, D. Pose26,16, V. Pugatch15,18, Y. Pylypchenko29, J. Pyrlik17, S. Ramachandran17, F. Ratnikov13,25, K. Reeves1,15, D. Reßing13, K. Riechmann28, J. Rieling15, M. Rietz28, I. Riu13, P. Robmann35, J. Rosen12,Ch. Rothe13, W. Ruckstuhl33,†, V. Rusinov25, V. Rybnikov13, D. Ryzhikov13,40, F. Saadi-Lüdemann13, D. Samtleben14, F. Sánchez13,15, M. Sang28, V. Saveliev27, A. Sbrizzi33, S. Schaller28, P. Schlein22, M. Schmelling15, B. Schmidt13,16, S. Schmidt9, W. Schmidt-Parzefall14, A. Schreiner34, H. Schröder13,30, H.D. Schultz13, U. Schwanke34, A. J. Schwartz7, A. S. Schwarz13, B. Schwenninger11, B. Schwingenheuer15, R. Schwitters1, F. Sciacca15, S. Semenov25, N. Semprini-Cesari6, E. Sexauer15, L. Seybold15, J. Shiu10, S. Shuvalov25,5, I. Siccama13, D. Škrk19, L. Sözüer13, A. Soldatov25,13,41, S. Solunin26, A. Somov5,13, S. Somov13,39, V. Souvorov34, M. Spahn15, J. Spengler15, R. Spighi6, A. Spiridonov34,25, S. Spratte11, A. Stanovnik20,19, M. Starič19, R. StDenis28,15, C. Stegmann34,5, S. Steinbeck14, O. Steinkamp33, D. Stieler31, U. Straumann16, F. Sun34, H. Sun3, M. Symalla11, S. Takach10, N. Tesch13, H. Thurn13, I. Tikhomirov25, M. Titov25, U. Trunk15, P. Truöl35, I. Tsakov13,42, U. Uwer5,16, V. Vagnoni6, C. van Eldik11, R. van Staa14, Yu. Vassiliev18,11, M. Villa6, A. Vitale6, I. Vukotic5, G. Wagner13, W. Wagner28, H. Wahlberg32, A. H. Walenta31, M. Walter34, T. Walter35, J. J. Wang4, Y. M. Wang4, R. Wanke15, D. Wegener11, U. Werthenbach31, P. J. Weyers5, H. Wolters8, R. Wurth13, A. Wurz24, S. Xella-Hansen9, J. Yang4, Yu. Zaitsev25, M. Zavertyaev15,38, G. Zech31, T. Zeuner31, A. Zhelezov25, Z. Zheng3, Z. Zhu3, R. Zimmermann30, T. Živko19, A. Zoccoli6, J. Zweizig13,22
asupported by the U.S. Department of Energy (DOE)
bsupported by the CICYT contract AEN99-0483
csupported by the Bundesministerium für Bildung und Forschung, FRG, under contract numbers 05-7BU35I, 05-7DO55P, 05 HB1HRA, 05 HB1KHA, 05 HB1PEA, 05 HB1PSA, 05 HB1VHA, 05 HB9HRA, 05 7HD15I, 05 7HH25I, 05 7MP25I, 05 7SI75I
dsupported by the Portuguese Fundação para a Ciência e Tecnologia
esupported by the Danish Natural Science Research Council
fsupported by the Texas Advanced Research Program
gsupported by the National Academy of Science and the Ministry of Education and Science of Ukraine
hsupported by the U.S. National Science Foundation Grant PHY-9986703
isupported by the Russion Fundamental Research Foundation under grant RFFI-00-15-96584 and the BMBF via the Max Planck Research Award
jsupported by the Norwegian Research Council
ksupported by the Foundation for Fundamental Research on Matter (FOM), 3502 GA Utrecht, The Netherlands
lsupported by the Swiss National Science Foundation
1 Introduction
The theoretical description of heavy quark hadroproduction has been a subject of great attention in recent years [1, 2, 3, 4]. For fixed target experiments [2, 3], the predictions, based on perturbative QCD, are compatible with experimental results from pion and proton beams, but both theoretical and experimental uncertainties are large. Only two measurements of the production cross section in proton-nucleus interactions were previously reported [5, 6]. Moreover, in collider experiments, the comparison between data and QCD predictions is not satisfactory [4].
The HERA B experiment is designed to identify -meson decays in a dense hadronic environment, with a large geometrical coverage. Interactions are produced on target wires in the halo of the 920 GeV HERA proton beam. The production cross section () on a nucleus of atomic number is obtained from the inclusive reaction
| (1) |
The -hadron decays into (“” in the following) are distinguished from the large prompt background by exploiting the lifetime in a detached vertex analysis. We select decays in both the muon and electron channels and perform a combined production cross section measurement.
In order to minimize the systematic errors related to detector and trigger efficiencies and to remove the dependence on the absolute luminosity determination, the measurement is performed relative to the known prompt production cross section [7, 8]. Our measurement covers the Feynman- () range . Within our acceptance, the to prompt cross section ratio can be expressed as:
| (2) |
where and are the and prompt cross sections limited to the mentioned range, and are the observed number of detached and prompt decays. is the relative detection efficiency of with respect to prompt , including contributions from the trigger, the dilepton vertex and the reconstruction. is the efficiency of the detached vertex selection. The branching ratio in hadroproduction is assumed to be the same as that measured in decays, with the value [9].
The prompt production cross section per nucleon, , was previously measured by two fixed target experiments [7, 8]. After correcting for the most recent measurement of the atomic number dependence ( [10]) and rescaling [11] to the HERA B c.m.s. energy, = 41.6 GeV, we obtain a reference prompt cross section of . About 70% [7] of the are produced in the kinematic range covered by our measurement.
2 Detector, Trigger and Data sample
A side view of the HERA B [14, 15] spectrometer is shown in Fig. 1. The spectrometer has a large geometrical coverage, from 15 mrad to 220 mrad in the bending plane and from 15 mrad to 160 mrad in the vertical plane.
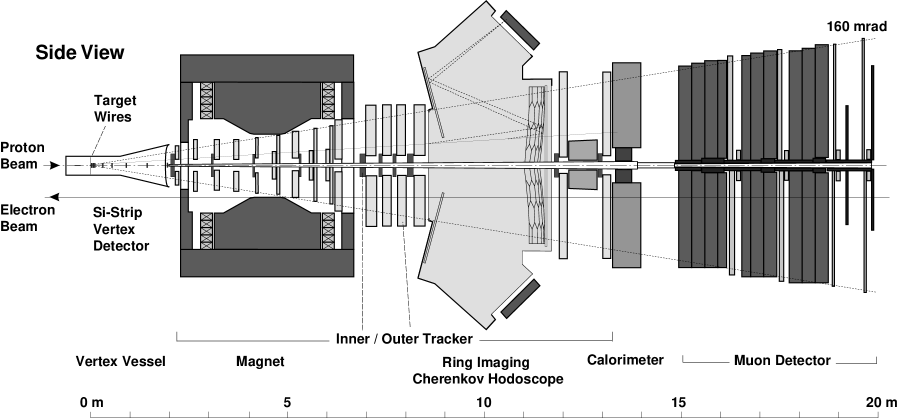
The target assembly [16] consists of two wire stations separated by 4 cm along the beam line, each containing 4 target wires of different materials. A servo system automatically steers the target wires during a run in order to maintain a constant interaction rate. The Vertex Detector System (VDS) [17] is realized by a system of 20 Roman pots containing seven planar stations (4 stereo views) of double-sided silicon micro-strip detectors (50 mm 70 mm sensitive area, 50 m pitch) that are operated in a vacuum vessel at 10 to 15 mm distance from the proton beam. An additional station is mounted immediately behind the 3 mm thick Al window of the vacuum vessel.
A dipole magnet with 2.13 Tm field-integral houses a first set of tracking stations, followed by a second set extending to 13 m downstream of the interaction region. To cope with the large particle flux gradient radial to the beam, the tracker is divided into a fine grained Inner Tracker (ITR) [18] and a large area Outer Tracker (OTR) [14, 19]. The ITR uses micro-strip gas chambers (typical pitch of 300 m) with gas electron multipliers. The OTR uses honeycomb drift cells with wire pitches of 5 mm near the beam and 10 mm away from the beam.
The particle identification is performed by a ring imaging Cherenkov hodoscope (RICH) [20], an electromagnetic calorimeter (ECAL) [21] and a muon detector (MUON) [22]. The RICH detector uses as radiator. The focal planes of the detector (above and below the beam line, respectively) are read out by multianode photomultipliers. The ECAL is based on “shashlik” sampling calorimeter technology, consisting of scintillator layers sandwiched between metal absorbers. In the radially innermost section, W is used in the absorber, and Pb everywhere else. The MUON system consists of 4 tracking stations located in the most downstream portion of the detector, at different depths in iron and iron-loaded absorbers. It is built from gas-pixel chambers in the radially innermost region and from proportional tube chambers, some with segmented cathodes (pads), everywhere else.
The data sample presented in this analysis was acquired in a short physics run during the HERA B commissioning period in summer 2000, at 5 MHz interaction rate, with a maximum of two target wires operated simultaneously and separated by 4 cm along the beam direction. The two wires were made of carbon (1000 m longitudinally and 100 m transversely) and titanium (500 m and 50 m, respectively).
The data were collected by triggering on dimuon and dielectron signatures. The MUON pretrigger candidates were based on a double pad chamber coincidence [23], while the ECAL pretrigger candidates were defined by ECAL clusters with a transverse energy GeV [24]. The First Level Trigger (FLT) required two pretrigger candidates of the same type and forwarded these to the Second Level Trigger (SLT). The SLT is a software filter [25] running on a farm of 240 PCs. Starting from the pad coincidences and high- ECAL clusters, a fast hit-counting algorithm and a simplified Kalman filter were applied to the OTR and VDS data to confirm the lepton pair candidates. An invariant mass cut of and an unlike-sign track requirement were also applied in the electron channel. The data from accepted events were assembled and sent to the online reconstruction farm [26], consisting of 100 dual-CPU PCs. The whole trigger chain allowed a reduction of the initial interaction rate of 5 MHz to a final output rate of 20 Hz [27]. A total of 450,000 dimuon and 900,000 dielectron candidates were recorded under these conditions.
At the time of data taking, the ITR and the MUON pixel chambers were not included in the trigger. As a consequence, the forward hemisphere of the proton-nucleus c.m.s. is reduced in this measurement, compared to the full HERA B acceptance.
3 Monte Carlo Simulation
A Monte Carlo (MC) simulation is used to determine the efficiency terms in Eq. 2 and to estimate the prompt background contribution to the decay channel.
The simulation of heavy quark () production is achieved, first, by generating the basic process including hadronization, using the Pythia 5.7 event generator [28]; secondly, the remaining part of the process () is given as an input to the Fritiof 7.02 package [29] to simulate further interactions inside the nucleus.
To describe the prompt kinematics accurately, the generated events are weighted according to the known prompt differential cross sections ( and ) measured in proton-gold collisions [7]. These results were obtained in the positive region, while our measurement covers the range . MC studies based on the Color Octet Model [30] of charmonium production show a symmetric distribution of prompt decays. We therefore use the experimental parameterization [7] to extrapolate to the full space. The model dependence of the generated spectrum is of less relevance since our acceptance is essentially flat.
For the MC simulations, the events generated by Pythia are weighted according to a model with various contributions. First, the generated quark kinematics ( and ) are given by the computation of M. Mangano et al. [31] using the most recent next-to-next-to-leading-logarithm (NNLL) MRST parton distribution functions [32] with a quark mass of and a QCD renormalization scale . Second, the intrinsic transverse momenta of the colliding quarks are smeared with a Gaussian distribution leading to [33]. Finally, the fragmentation is described by a Peterson function [34] with a parameter [5]. The subsequent -hadron production and decay are controlled by the Pythia default parameters. The -hadron average lifetime is taken from Ref. [9]: .
The sensitivity of the final result on the cross section within our acceptance () has been determined by varying the following MC model parameters: the parton distribution functions (from MRST to CTEQ5 [35]), the quark mass (in the range ), the QCD renormalization scale (from to ), the fragmentation function (from the Peterson form [5, 36, 37] with parameter , to the Kartvelishvili form [38] with parameter [37]), the intrinsic transverse momentum distribution (with in the range [0.125,2.0] ) and the fraction of -baryons produced in the hadronization process in the range [0, 12]%. The observed variations in the detection efficiencies have been included in the systematic error.
The generated particles are propagated through the geometry and material description of the detector using the Geant 3.21 package [39]. A simulation of the detector response to particles is achieved by reproducing the digitization of electronic signals, with a realistic description of hit efficiencies and problematic channels. The MC events are subjected to a full trigger simulation and reconstructed with the same algorithms as the data.
4 Event Selection
Since the observed number of prompt decays is used as a normalization factor of the cross section measurement, we begin by selecting and counting the number of decays (), before applying the detached vertex analysis. The lepton reconstruction in the OTR is seeded with the dilepton trigger track candidates; moreover a matching criteria is applied between the reconstructed track and the trigger track candidate in both the OTR and the VDS. The selection and counting procedure differs between the muon and electron channels, due to differences in the background levels, shapes and triggering conditions.
4.1
Three criteria are used to select decays and to purify the reconstructed sample from non- background: a dimuon vertex requirement and muon identification cuts in both the MUON and the RICH systems. The cuts are chosen to give the best signal significance () on the number of seen () with the observed background (). The resulting spectrum is shown in Fig. 2, with prompt decays. The like-sign spectrum shown in Fig. 2 is obtained from the same set of triggered events: the small discrepancy in number of reconstructed events in the background regions arises from the difference in trigger acceptance between the two cases and from physics contributions to the unlike-sign spectrum (Drell-Yan, open charm production).

4.2
The selection of decays is more complex due to very large background contributions, mainly from pions interacting in the ECAL and hadrons overlapping with energetic neutral showers. Due to such background, a clear signal can be reconstructed only by means of strong electron identification requirements. Electron identification in the ECAL is based both on the ratio of the cluster energy to the momentum from tracking () and on the search for electron bremsstrahlung signals:
- the distribution is established for a purified sample by using a double-bremsstrahlung requirement as described in the following paragraph. The spectrum is compatible with a Gaussian distribution of mean and width 9%;
- bremsstrahlung photons emitted upstream of the magnet maintain the original electron direction; thus they can be used to correct the electron momentum at the vertex and they also provide a clean electron signature (bremsstrahlung tag).
The invariant mass distribution is shown in Fig. 3(a), requiring only that be within 1 from unity for each track. Figs 3(b,c) show the improvements in signal significance that are obtained when the bremsstrahlung selection is added to the requirement.

| Bremsstrahlung | cut in units of | |||
|---|---|---|---|---|
| requirement | ||||
| None | [] | |||
Table 1 lists the number of prompt signal events found for different and bremsstrahlung requirements. Using these sets one can measure the bremsstrahlung tag probability for a single electron redundantly, resulting in an average . This measured tag probability is in good agreement with expectations from MC simulations. The systematic uncertainties include the observed fluctuations when varying the fitting functions and range used to estimate the amount of events in the invariant mass spectra.
The good knowledge of the particle identification efficiencies allows us to infer the number of prompt present in a sample where looser identification cuts have been applied and where no clear signal is directly visible. Under such conditions, the normalization factor can be obtained while preserving reasonable statistics for the final detached vertex analysis, which relies only on the vertex separation cuts for the background rejection, as will be shown in Sect. 5.
The total number of prompt in our sample with no bremsstrahlung tag requirement and with a 3 cut is (entry in square brackets in Table 1).
5 Detached Vertex Analysis
The long decay length of -hadrons is used to separate the events from the prompt and to further reduce the non- background. The decay length (), defined as the distance along the beam axis between the decay vertex and the closest wire (primary production point), is shown in Fig. 4 for a purified sample of events (2 bremsstrahlung requirement). The width of the prompt vertex distribution is more than 10 standard deviations smaller than the mean decay length of triggered -hadrons (0.8 cm). Given the achieved vertex resolution, a detached vertex cut proves to be efficient in the signal selection. Additionally, a cut on the minimum impact parameter of both leptons to the production vertex () or to the wire () is applied in the detached vertex selection. The minimum impact parameter distribution of prompt decay leptons (purified sample) to the wire is compared to the corresponding distribution from decay leptons (dashed line) in Fig. 5, illustrating the potential gain in signal-purity when applying a minimum impact parameter cut.

The prompt which survive the detached vertex cuts cannot be distinguished from events and their contribution to the detached signal has to be determined from MC. A study has been performed to ensure that the simulation tool reliably reproduces the real data for the physical quantities defining the detached selection cuts, as illustrated by the good MC-data agreement in Fig. 4 and Fig. 5. In the simulation of the channel, a Gaussian distribution has been added to the standard MC track-slopes, increasing the slope errors by 20% in average, in order to match the parameters observed in data and resulting in a similar good MC-data agreement as in the case.

The optimization of the detached vertex cuts is achieved by maximizing the ratio , where is the number of accepted signal events in the MC sample and the number of background events in real data, observed in the whole upstream region and downstream in the side bins of the invariant mass signal. The systematic errors in the final result take into account the variations in the signal estimated under different sets of cuts found by the optimization procedure.
The main background contributions expected in the detached sample are due to combinatorics (bad vertex or track reconstruction) and to double semileptonic or events. The combinatorial yield is estimated through the observed events in the region upstream of the primary interaction (unphysical region), while the charm background level is estimated by means of MC simulations, assuming a production cross section of b/nucleon for our 920 GeV proton beam energy [40]. The background yield is estimated by studying the MC mass spectrum of events surviving trigger and selection cuts, with a contribution relative to the observed yield of events.
5.1
The detached vertex cuts found by the optimization procedure in the dimuon channel are: a minimum decay length of 7.5 times the uncertainty on the secondary vertex position 111The typical cutoff is at about 5 mm, with some events down to 3 mm being accepted., a minimum track impact parameter to the assigned primary vertex of 160 m and a minimum track impact parameter to the assigned wire of 45 m.
Only 11 events survive these cuts downstream of the primary interaction region with invariant mass above 2.1 (see Fig. 6). Only a single event is found upstream of the primary interaction.

In order to use the full information of the detached invariant mass spectrum, an unbinned likelihood fit is performed, using the Gaussian parameters of the prompt signal together with an exponential background contribution with free slope. The output of the fit shown in Fig. 6 yields 1.9 events. The background slope obtained from the fit is compatible with the simulated charm and bottom quark background shape, although the statistics are low.
From simulation, the expected background from prompt decays is negligible. The estimated background contributions of semileptonic charm and bottom quark decays, together with the single event expected from combinatorial background (seen upstream) and the number of fitted signal events, are compatible with the 11 events observed downstream of the primary interaction region.
To determine in our range, the prompt and MC events are submitted to the same analysis chain used for real data. From simulation we obtain the efficiency terms entering in the cross section formula: . The corresponding cross section measured in the channel is nb/nucleon, obtained by using the weighted average of our target materials. All parameters contributing to the measurement (Eq. 2) are summarized in Table 2.
5.2
The cut optimization procedure in the channel results in the following criteria: a minimum decay length of 0.5 cm, a minimum track impact parameter to the assigned wire of 200 m or alternatively an isolation of the lepton candidate at the of the wire from any other track by a minimum distance of 250 m. The types and values of the cuts are not exactly the same as in the muon analysis due to the very different background conditions.
The detached selection yields 8 events upstream of the primary interaction region (pure combinatorial background) and 19 downstream events (see Fig. 7). Among the downstream candidates, 10 events are found in the mass window ().

Similarly to the muon analysis, an unbinned likelihood fit is performed on the invariant mass spectrum of the detached downstream candidates. The shape of the signal is taken from simulated decays, while the background shape is a combination of the shapes obtained from simulated double semileptonic bottom quark decays and from pure combinatorial (upstream) events. The result of the likelihood fit is shown in Fig. 7(b), yielding 8.6 events. When the background shape used in the fit is replaced by a pure combinatorial background shape or by a pure double semileptonic background, a % variation is observed in the number of events. This contribution is included in the systematic error of our measurement.
The expected background from prompt decays is of less than 0.2 events at the 90% C.L. in the whole downstream region. As in the case, the estimated background yields from semileptonic charm and bottom quark decays, together with the expected combinatorial background level (8 events seen upstream) and the fitted signal, are compatible with the 19 events observed downstream of the primary interaction region.
Different cut optimization techniques and assumptions have been tested to verify the stability of the signal. The optimizations are performed simultaneously on the three detached vertex cuts (, and the isolation cut) using the background from real data and the downstream events from MC. Independently on the optimization criteria, a signal with significance greater than 2 is always observed in the downstream part of the spectrum, while a visible signal is never present in the upstream part. In Fig. 8, the selected detached events are displayed in a scatter plot of the invariant mass versus the measured decay length (): a clustering is observed around the invariant mass for large values in the region downstream of the primary interaction.

To confirm the assignment of the selected events, an unbinned maximum likelihood fit is performed on the decay length measurements. A mean decay length of cm on events is expected from MC. We measure cm for the 10 downstream events in the region (), in good agreement with the interpretation, while the 8 upstream background events yield a mean decay length of cm (measured using ). To further verify that the selected events have features compatible with decays, we performed a visual inspection of the candidates studying extra detached vertices (from the other decay) and extra tracks attached to the vertex. Both categories of events are observed, and their yields are compatible with MC expectations. Within the limits of the available statistics, the and distributions are also compatible with the interpretation.
From MC simulation, we obtain the efficiency terms entering in the cross section measurement (Eq. 2): . The corresponding cross section measured in the channel is nb/nucleon, obtained by using the weighted average of our target materials. All the parameters used in Eq. 2 are summarized in Table 2.
| channel | channel | |
| Target | 77% C(=12) +23% Ti(=48) | |
| Interaction rate | 5 MHz | |
| Beam energy | 920 GeV | |
| 41.6 GeV | ||
| nb/nucleon | ||
| Prompt () | ||
| Detached () | ||
| Br | ()% | |
| nb/nucl. | nb/nucl. | |
| Combined | nb/nucleon | |
| Combined | nb/nucleon | |
6 Combined Cross Section Measurement
The two measurements, nb/nucleon and nb/nucleon, obtained in the muon and electron channels, respectively, are compatible within statistical uncertainties. In order to extract the maximum information on the production cross section from our data, we combine the and likelihoods in a four parameter likelihood maximization (, background slope, and background yields) on the detached candidates. The fit provides our final result of the production cross section:
| (3) |
where the quoted uncertainty has been estimated directly from the fit (see Fig. 9).

The main sources of systematic uncertainty in the present measurement, which are not related to the final statistics, are due to the prompt cross section reference (11%), the branching ratio Br (9%), the trigger and detector simulation (5%), the prompt MC production models (2.5%), the MC production models (5%), the prompt counting (5%) and the carbon-titanium difference in efficiencies (1.7%). Other contributions are below the 1% level. Uncertainties stemming from the background shapes used in the maximum likelihood fits on the invariant masses and from the cut values are dominated by the low statistics of observed detached events. For these sources we assign conservative uncertainties of % and 13% to the and channels, respectively. The overall systematic uncertainty for our measurement, averaged over the muon and electron channels, is of %.
To compare our measurement with theoretical predictions, we extrapolate the measurement to the full range, relying on the production and decay model described in Sect. 3 which foresee that 92% of from decays are produced in our range. We obtain the total production cross section:
| (4) |
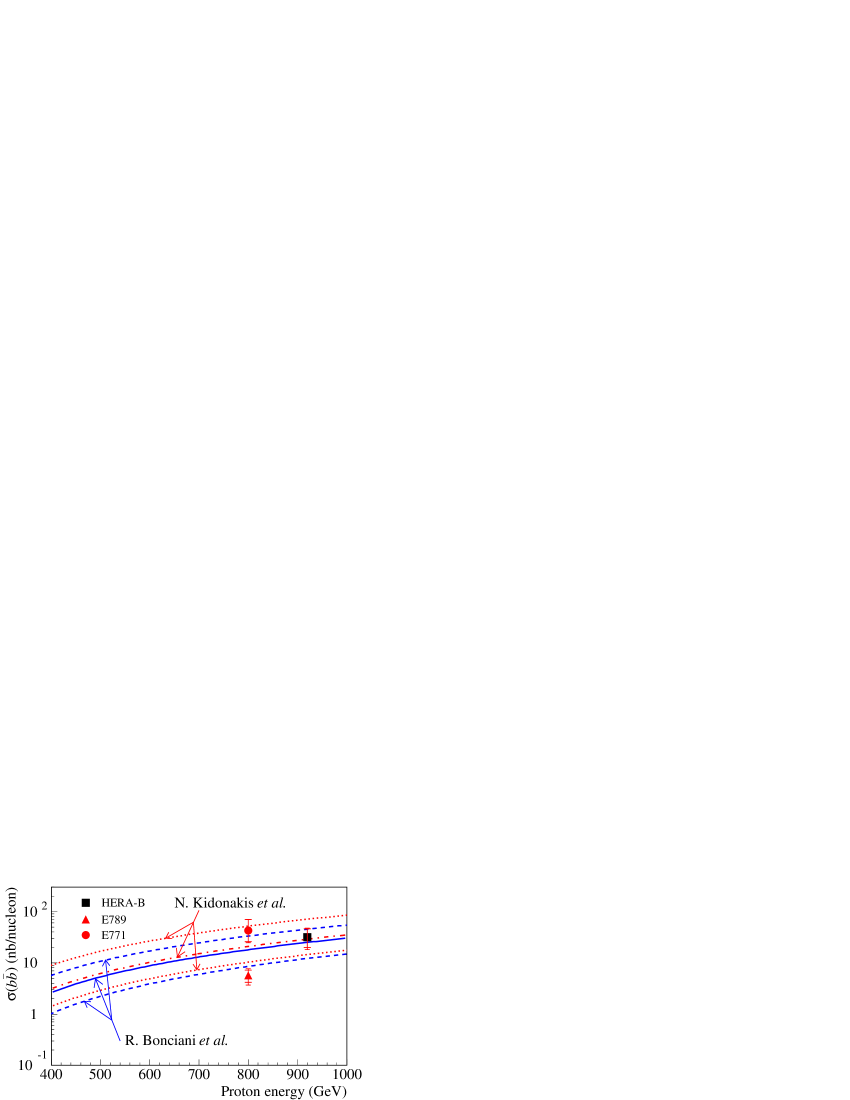
In Fig. 10, this result is compared with the latest QCD calculations [2, 3] beyond next-to-leading order (NLO). The two predicted values at 920 GeV proton beam are, respectively, nb/nucleon 222Value based on Ref. [2], updated with the parton distribution function in Ref. [32]. and nb/nucleon, in good agreement with our measurement. In the same figure, the E789 [5] and E771 [6] experimental results obtained with 800 GeV proton interactions on Au and Si, respectively, are plotted and are seen to be compatible (Fig. 10).
7 Conclusions
Events coming from decays have been identified in a sample of 1.35 million dilepton triggered events, acquired in a short physics run during the HERA B commissioning period in summer 2000. The data analysis results in the identification of candidates and candidates.
From these candidates, we compute the production cross section by normalizing to the known prompt cross section. In the kinematic range , we obtain nb/nucleon and nb/nucleon in the muon and electron channels, respectively. Within statistical errors, the two results are compatible. The combined result of the production cross section measured by HERA B at 920 GeV using C and Ti interactions in our range is . Extrapolating this measurement to the full range, we obtain the total production cross section:
| (5) |
Acknowledgments
We express our gratitude to the DESY laboratory and to the DESY accelerator group for their strong support since the conception of the HERA B experiment. The HERA B experiment would not have been possible without the enormous effort and commitment of our technical and administrative staff. It is not possible to list here the many individuals who have contributed to HERA B. We are especially grateful to the following persons and their groups: G. Avoni, C. Baldanza, J. Bizzell, A. Cotta-Ramusino, F. Czempik, I. D’Antone, J. Davila, J. Dicke, A. Donat, U. Dretzler, A. Epifantsev, S. Fricke, W. Funk, A. Gutierrez, F. Hansen, M. Harris, S. Hennenberger, J. Hogenbirk, M. Jablonski, V. Kiva, M. Kolander, Y. Kolotaev, L. Laptin, H. Leich, H. Lüdecke, Q. Li, K. Y. Liu, P. Liu, C. Lu, K. Ludwig, J. McGill, E. Michel, N. Murthy, E. Novikov, S. Omeltchuk, D. Padrazo, H. B. Peters, P. Pietsch, M. Pohl, N. Ratnikova, A. Rausch, W. Reinsch, P. Rose, I. Rostovtseva, R. Rusnyak, W. Sands, P. Solc, S. Starostin†000† deceased , K.-H. Sulanke, V. Tchoudakov, M. Tkatch, K. Wagner, P. Wegner, V. Zerkin, E. Zimmer-Nixdorf. We thank the external HERA B referees R. Forty, D. Froidevaux, R.-D. Heuer, K. Jakobs and J. Jaros for many stimulating discussions and suggestions. We are indebted to our administrative staff U. Djuanda and I. Kerkhoff for their continuous assistance.
In the preparation of this paper, we have benefited from many useful discussions with M. Mangano, P. Nason, and R. Vogt on the theory of production.
References
- [1] P. Nason, Proc. of the XX Int. Symp. on Lepton and Photon Interactions at High Energies, hep-ph/0111024; S. Frixione et al., Adv. Ser. Direct. High Energy Phys. 15 (1998), 609.
- [2] R. Bonciani et al., Nucl. Phys. B529 (1998) 424.
- [3] N. Kidonakis et al., Phys. Rev. D64 (2001) 114001.
- [4] S. Frixione et al., Proc of Int. Eur. Conf. on High Energy Physics, July 2001, Budapest, hep-ph/0111368.
- [5] D. M. Jansen et al., Phys. Rev. Lett. 74 (1995) 3118.
- [6] T. Alexopoulos et al., Phys. Rev. Lett. 82 (1999) 41.
- [7] M. H. Schub et al., Phys. Rev. D52 (1995) 1307.
- [8] T. Alexopoulos et al., Phys. Rev. D55 (1997) 3927.
- [9] D. E. Groom et al., Eur. Phys. J. C15 (2000) 1.
- [10] M. J. Leitch et al., Phys. Rev. Lett. 84 (2000) 3256.
- [11] T. Alexopoulos et al., Phys. Lett. B374 (1996) 271.
- [12] M. J. Leitch et al., Phys. Rev. Lett. 72 (1994) 2542.
- [13] R. Vogt, hep-ph/0111271.
- [14] E. Hartouni et al., HERA B Design Report, DESY-PRC-95-01 (1995).
- [15] The HERA B Collaboration, HERA B Status Report, DESY-PRC-00-04 (2000).
- [16] K. Ehret, Nucl. Instr. Methods A446 (2000) 190.
- [17] C. Bauer et al., Nucl. Instr. Methods A453 (2000) 103.
-
[18]
T. Zeuner, Nucl. Instr. Methods A446 (2000) 324;
Y. Bagaturia et al., hep-ex/0204011, in press on Nucl. Instr. Methods A. - [19] M. Capeans, Nucl. Instr. Methods A446 (2000) 317.
-
[20]
J. Pyrlik, Nucl. Instr. Methods A446 (2000) 299;
I. Ariño et al., Nucl. Instr. Methods A453 (2000) 289. -
[21]
G. Avoni et al., Proc. of the IX Conf. on Calorimetry in Particle
Physics, Annecy, France, Oct. 9-14, 2000, Calorimetry in High energy
physics, (2001) 777;
A. Zoccoli, Nucl. Instr. Methods A446 (2000) 246. -
[22]
M. Buchler et al., IEEE Trans. on Nucl. Sci. 46 (1999) 126;
A. Arefiev et al., IEEE Trans. on Nucl. Sci. 48 (2001) 1059. - [23] M. Böcker et al., IEEE Trans. Nucl. Sci. 48 (2001) 1270.
-
[24]
V. Alberico et al., Il Nuovo Cimento, 110 A (1997) 1453;
G. Avoni et al., Nucl. Instr. Methods A461 (2001) 332. - [25] P. Kreuzer, Nucl. Instr. Methods A462 (2001) 212.
- [26] J. M. Hernández, Proc. of the Int. Conf. on Computing in High Energy Physics CHEP 2001, Beijing, Sep. 2001.
- [27] J. M. Hernández et al., Nucl. Science Symp. Conf. Record, 2000 IEEE, vol.2 (2000) 12/116.
- [28] T. Sjöstrand, Comp. Phys. Comm. 82 (1994) 74.
- [29] H. Pi, Comp. Phys. Comm. 71 (1992) 173.
- [30] P. Cho and A. Leibovich, Phys. Rev. D53 (1996) 150.
- [31] M. Mangano, P. Nason and G. Ridolfi, Nucl. Phys. B373 (1992) 295; P. Nason, S. Dawson and R. K. Ellis, Nucl. Phys. B327 (1988) 49.
- [32] A. D. Martin et al., Phys. Lett. B531 (2002) 216.
- [33] J. Chay, S. D. Ellis and W. J. Stirling, Phys. Rev. D45 (1992) 46.
- [34] C. Peterson et al., Phys. Rev. D27 (1983) 105.
- [35] H. L. Lai et al., Eur. Phys. J. C12 (2000) 375.
- [36] J. Chrin, Z. Phys. C36 (1987) 163; D. Decamp et al., Phys. Lett. B244 (1990) 551; P. Nason and C. Oleari, Nucl. Phys. B565 (2000) 245.
- [37] A. Heister et al., Phys. Lett. B512 (2001) 30.
- [38] V. G. Kartvelishvili, A. K. Likhoded and V. A. Petrov, Phys. Lett. B78 (1978) 615.
- [39] R. Brun et al., GEANT3, Internal Report CERN DD/EE/84-1, CERN, 1987.
- [40] S. Frixione et al., Nucl. Phys. B431 (1994) 453.