MEASURING THE RARE DECAYS and
Abstract
In this paper I will describe the search for rare kaon decay processes and . The small decay rate for these processes is considered a key prediction of the standard model. We searched for the charged kaon decay using kaons decaying at rest in the E787 detector at Brookhaven National Laboratory in two different phase space regions: Region 1 with pion momentum above 205 MeV/c (the peak) and Region 2 with pion momentum below 205 MeV/c. We have found 2 events in Region 1 which is known to have small background (). This observation leads to a branching ratio measurement of . We found 1 event in Region 2 with an expectation of background events. The observation from Region 2 is consistent with the branching ratio measured using Region 1. I will also describe new efforts underway to measure both the decay rates with much higher statistics.
1 Introduction
The rare kaon decays and offer unique opportunities to probe higher order phenomena associated with quark mixing and the origin of CP non-invariance. E787 at the Brookhaven National Laboratory Alternating Gradient Synchrotron (AGS) has measured the decay [1] based on the observation of two events with low expected background. This measurement was based on data from the pion momentum region above 205 MeV/c (the peak); we have recently extended this measurement to the low momentum region with new techniques [2]. The branching ratio indicated by these observations is consistent with the Standard Model (SM) expectation. To fully explore the possibility of new physics or to make a precise measurement of the t-d quark coupling (assuming the SM level for ), a new measurement is about to commence. E949 is designed to obtain a single event sensitivity of (8–14), roughly an order of magnitude below the SM prediction. In order to reach this sensitivity the present detector has been upgraded, and data running has begun with higher kaon flux. With the completion of E949 in 2004, the possibility of an inconsistency with the SM prediction of will be fully explored or the important top-down quark mixing parameter will be determined to a precision if the SM expectation is confirmed.
In addition, it has become evident that the sector can yield the single most incisive measurement in the study of CP violation through a measurement of the branching ratio for (), estimated to be about . Within the SM this is a unique quantity which directly measures the area of the CKM unitarity triangles i.e. the physical parameter that characterizes all CP violation phenomena, or the height of the triangle shown in Fig. 1. The quest to observe is being taken up by the new KOPIO experiment at BNL discussed below.
 |
The measurements of and will result in a complete picture of Standard Model CP-violation in the system and a comparison with comparably precise measurements anticipated from the sector will be possible.
2 Phenomenology of .
is a flavor-changing neutral current process, arising at the one loop level in the SM as shown in Fig. 2.
 |
The presence of the top quark in the loops makes this decay very sensitive to the modulus of the elusive CKM coupling [3]. Moreover, this sensitivity can be fully exploited because of the hard GIM suppression, the relatively small QCD corrections (which have been calculated to next-to-leading-logarithmic order [4]), and the fact that the normally problematic hadronic matrix element can be determined to a few percent from the rate of () decay [5]. Taking account of all known contributions to the intrinsic theoretical uncertainty, the branching ratio can be calculated to a few percent [3], given the SM input parameters. QCD corrections to the charm contribution are the leading source of the residual theoretical uncertainty. Long distance contributions are known to be negligible so not only can the effects of SM short-distance physics be clearly discerned, but also the effects of possible non-SM physics. In the SM, using current data on , , , , , mixing, etc., the branching ratio is expected to be .
The decay mode is unique in that it is completely dominated by direct CP violation [6] due to the CP properties of , and the relevant short-distance hadronic transition current. Since is predominantly a coherent, CP odd superposition of and , only the imaginary part of survives in the amplitude. The comments made above about the hadronic matrix element, QCD corrections, etc., in also apply to with the additional feature that the lack of a significant charm quark contribution reduces the intrinsic theoretical uncertainty to . Since the value of the sine of the Cabibbo angle is well known (), is equivalent to the Jarlskog invariant, . , in turn, is equal to twice the area of any of the six possible unitarity triangles [7]. Since theoretical uncertainties are extremely small, measurement of will provide the standard against which all other measures of CP violation will be compared, and even small deviations from the expectation derived from SM predictions or from other measurements, e.g. in the sector, will unambiguously signal the presence of new physics. In the Wolfenstein parameterization of the CKM matrix,
| (1) |
Inserting the current estimates for SM parameters into Eq. 1, the branching ratio for is expected to be in the range . A clean measure of the height of the unitary triangle, , is provided by the branching ratio. We note that, all other parameters being known, Eq. 1 implies that the relative error of is half that of . Thus, for example, a measurement of can, in principle, determine to .
Most forms of new physics [8, 9, 10] postulated to augment or supersede the SM have implications for B(). In minimal supersymmetry and in some multi-Higgs doublet models [11], the extraction of and from CP asymmetries in B decays would be unaffected. Such effects might then show up in a comparison with , where, e.g., charged Higgs contributions modify the top quark dependent function in . In other new physics scenarios, such as supersymmetric flavor models [12], the effects in tend to be small, while there can be large effects in the (and also the ) system. In these models the rare decays are the only clean way to measure the true CKM parameters. Loop diagrams involving new heavy particles in extensions of the SM can interfere with SM diagrams and alter the decay rate, and also the kinematic spectrum[8]. Exotic scenarios such where is a hypothetical stable weakly interacting particle or system of particles have also been suggested [13, 14]. It is therefore important to obtain higher statistics for the decay and to extend the measurement to obtain the spectrum.
3 E787 results
The signature for in the E787 experiment (See Fig. 3) is a single stopping in a target (TG), decaying to a single with no other accompanying photons or charged particles. In Region 1, the major backgrounds were found to be the two body decays () and , scattered beam pions, and charge exchange (CEX) reactions resulting in decays , where or . Region 2 has larger potential acceptance than Region 1 because the phase space is more than twice as large and the loss of pions due to nuclear interactions in the detector is smaller at the lower pion energies. However, there are additional sources of background for Region 2. These include in which the loses energy by scattering in the material of the detector (primarily in the TG), , , , and () decays in which both the and the are invisible because of absorption.
The data were obtained with a flux of electrostatically separated kaons per 1.6 sec spill at 700 to 800 MeV/c (with 20% pion contamination)[15] entering the apparatus. The beam momentum and spill was changed from time-to-time to get optimum efficiency. The kaons were identified by a Cerenkov detector; two multi-wire-proportional-chambers were used to determine that there was only one entering particle. After slowing in a BeO degrader the kaons traversed a 10-cm-thick lead-glass (PBG) detector read out by 16 fine-mesh photomultiplier tubes (PMT) and a scintillating target hodoscope (TH) placed before the TG. The PBG detector was designed to be insensitive to kaons and detect electromagnetic showers originating from kaon decays in the TG. The TH was used to verify that there was only one kaon as well as determine the position, time, and energy loss of the kaon before it entered and stopped in the TG. The TG consisted of 413 5.0-mm-square, 3.1-m-long plastic scintillating fibers, each connected to a PMT. The fibers were packed axially to form a cylinder of 12 cm diameter. Gaps in the outer edges of the TG were filled with smaller fibers which were connected to PMTs in groups. The PMTs were read out by ADCs, TDCs, and 500 MHz transient digitizers based on GaAs charge-coupled devices (CCDs)[17]. Photons were detected in a hermetic calorimeter mainly consisting of a 14-radiation length thick barrel detector made of lead/scintillator sandwich and 13.5-radiation length thick endcaps of undoped CsI crystals [18]. The rest of the detector consisted of a central drift chamber (UTC)[19], and a cylindrical range stack (RS) of 21 layers of plastic scintillator with two layers of embedded tracking chambers, all within a 1-T solenoidal magnetic field. The TG, UTC, and RS allowed the measurement of the , , and of the charged decay products. The UTC had 12 layers of anode wires for measuring the transverse momentum and six foils etched with helical cathode strips to measure dip angle or in the plane. After correction for energy loss in the target and I-counter, the momentum resolution was measured to be %. After making corrections for the energy loss in the sub-detectors before entering the RS, the range and kinetic energy resolutions are measured to be % and %, respectively. The decay sequence from pions that came to rest in the RS was observed using another set of 500 MHz transient digitizers (TD)[20]. The decay sequence observation is a powerful tool in identifying a charged pion. Muon rejection from this information can reach about . This cut is independent of the separation using another cut on the range and momentum correlation for different particles, where the separation is more than 3.
The data reduction and offline analysis for Region 1 and Region 2 were similar [21], although the final cuts to enhance signal and suppress background to less than one event were different. The UTC, RS with the TD readout and the photon veto system were the most important elements for Region 1 analysis. The TG with the CCD pulse digitizing system, and the photon veto system were the important elements for Region 2 analysis. A multilevel trigger selected events by requiring an identified to stop in the TG, followed, after a delay of at least 1.5 ns, by a single charged particle track that traversed TG and RS with a hit-pattern consistent with the expectation for . Events with photons were suppressed by vetos on the barrel and endcap detectors. In the offline analysis, the single charged particle was required to be identified as a with , , and consistent for a , and the TD pulse information consistent with the decay sequence in the last RS counter on the pion trajectory. The kinematic variables for Region 1 were corrected for various correlations for each event and the signal region was defined by the intervals , , and . For Region 2 the signal was defined by , , and .
3.1 Region 1 result
| Background | 1995-7 | 1998 |
|---|---|---|
| 1 beam bkg | ||
| 2 beam bkg | ||
| CEX | ||
| Total |
The data sets for Region 1 were divided in two parts: the 1995-97 data and the 1998 data. The 1995-97 data was already analysed and the results published ([1]), nevertheless, we reanalysed the 1995-97 data with the same reconstruction programs as the 1998 data for consistency in the final results. We formed multiple independent constraints on each source of background. These constraints were grouped in two independent sets of cuts, designed to have little correlation. One set of cuts was relaxed (or inverted) to enhance the background so that the other set could be evaluated to determine its power of rejection, as summarized below. The background due to was obtained by separately measuring the rejection factors of the TD particle identification and kinematic ( and ) particle identification. The background due to was obtained by measuring the rejection factor of photon veto using the events in the kinematic peak of the two-body decay and the rejection factor of the kinematic cuts on events tagged by a photon. The background from beam pions was evaluated by separately measuring the rejections of Cerenkov, TH beam particle identification, and the delay time between pion and kaon. The charge exchange background estimate is from Monte Carlo. The kaon regeneration rate and beam profile are from the actual measurement using data for the process of . The final background estimate for Region 1 is shown in Table 1. The integrity of the background estimates was assured because the background cuts were defined using only one-third of the data, sampled uniformly from the entire set, without examining the events in the pre-determined signal region. The cuts were then applied with no further changes to the remaining two-thirds of the data to obtain the final background numbers.
Figure 4 shows the range versus kinetic energy for the events surviving all the selection criteria. The box indicated by the solid lines depicts the signal search region. Two signal events are found inside this signal region and the events outside this box are from the background due to photons escaping detection. Detailed studies of the candidate events as well as a signal probability study showed that they are consistent with the signature of .
The acceptance is estimated using , , and -scattering monitor samples taken simultaneously with the trigger and by means of a Monte Carlo sample. Table 2 gives the acceptances for each cut category and the final acceptance. The corresponding branching ratio assuming no background is also in the table for the two different data sets.
| Category | 1995-97 | 1998 |
|---|---|---|
| stop efficiency | 0.704 | 0.702 |
| decay after 2 ns | 0.850 | 0.851 |
| phase space | 0.155 | 0.136 |
| Solid angle acceptance | 0.407 | 0.409 |
| nucl. interaction | 0.513 | 0.527 |
| Reconstruction efficiency | 0.959 | 0.969 |
| Other kinematic constraints | 0.665 | 0.554 |
| decay acc. | 0.306 | 0.392 |
| Beam and target analysis | 0.699 | 0.706 |
| Accidental loss | 0.785 | 0.751 |
| Total acceptance | 0.0021 | 0.0020 |
| Total triggers () | 3.2 | 2.7 |
| Br() () |
To combine searches with small statistics for both signal and background level, a statistical analysis [22] is performed giving the final branching ratio measurement on from E787:
Br()=
Assuming unitarity, GeV/, GeV/ and , one can derive the constraint
(68% C.L.),
without requiring any knowledge of or .
3.2 Region 2 result
For Region 2 we have so far analysed data from 1996 which corresponded to a kaon exposure of . The Region 2 background was found to be dominated by events in which the pion had a nuclear interaction near the kaon decay vertex, most probably on a carbon nucleus in the TG plastic scintillator. This scatter left the pion with reduced kinetic energy, putting it in Region 2. We suppressed this background by removing events in which the pion track had a scattering signature in the TG. These signatures included kinks, tracks that did not point back to the vertex fiber in which the kaon decayed, or energy deposits inconsistent with the ionization energy loss for a pion of the measured momentum. The remaining background consisted of events in which the pion scattered in one of the fibers traversed by the kaon. The extra energy deposits from the pion scatters were obscured by the earlier large energy deposits of the kaon. For these events, we examined the pulse shapes recorded in the CCDs in each kaon fiber using a fit and eliminated events in which an overlapping second pulse, in time with the pion, was found to have energy larger than 1 MeV. To obtain sufficient separation of the and induced pulses in the CCDs we required a minimum delay of 6 ns between the kaon and the pion. Finally, additional rejection was obtained by removing events with photon interactions in detectors surrounding the kaon beam-line; these cuts caused substantial ( 42 %) loss of efficiency because of accidental hits due to the high flux of particles.
| d | ||
| dm | ||
| d | ||
| Beam | d | |
| dm | ||
| CEX | dm | |
| Total |
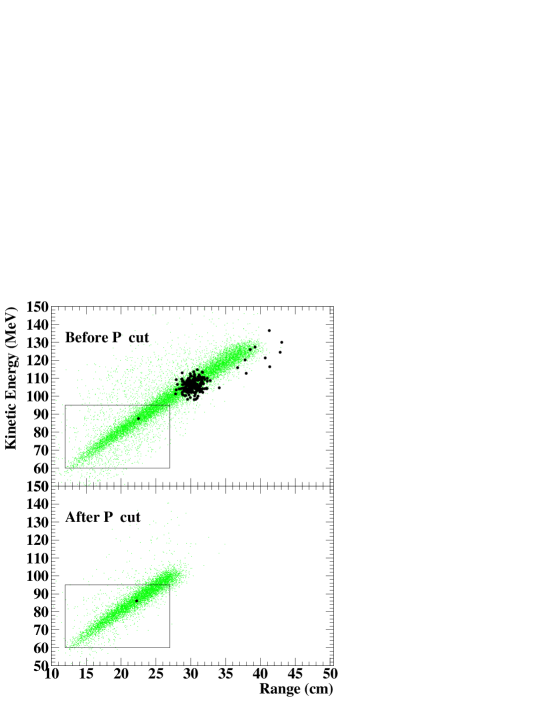
The background estimates for Region 2 were performed using the same techniques as the Region 1 analysis: multiple independent constraints. The dominant background from decay was measured by evaluating the rejection of the photon veto system on events tagged by scattering signatures in the TG and target CCDs. Similarly, the rejection of the target CCD cut was determined by using events that failed the photon veto criteria. It should be noted that the Region 1 analysis measured photon veto rejection using the unscattered events in the momentum peak (205 MeV/c). This method could not be used for Region 2 because the scattering in the TG spoiled the back-to-back correlation between the detected track in the RS and the undetected , leading to different photon veto rejection factors for scattered and unscattered background events. The other less important backgrounds were estimated using data or data combined with Monte Carlo estimates of cut efficiencies. The final background estimates and associated errors in Table 3 include corrections for small correlations in the separate groups of cuts and cross contamination of background samples. After all cuts the signal region for Region 2 was examined: Fig. 5 shows the kinematics of the remaining events before and after the cut on measured momentum, .
| Acceptance factors | |
|---|---|
| stop efficiency | 0.670 |
| decay after 6 ns | 0.591 |
| phase space | 0.345 |
| Geometry | 0.317 |
| nucl. int. and decay in flight | 0.708 |
| Reconstruction efficiency | 0.957 |
| Other kinematic cuts | 0.686 |
| decay chain | 0.545 |
| Beam and target analysis | 0.479 |
| CCD acceptance | 0.401 |
| Accidental loss | 0.363 |
| Total acceptance |

Using the total number of incident on TG for the 1996 data, , the acceptance reported in Table 4, and the observation of one event in Region 2 we calculate the upper limit of (90% C.L.) [24]. This is consistent with the branching ratio reported from Region 1 and the SM decay spectrum [1]; combining the measurements from Region 1 and Region 2 does not alter the branching ratio measurement significantly because it is dominated by the sensitivity of Region 1. However, for non-standard scalar and tensor interactions, Region 2 has larger acceptance than Region 1. We have combined the sensitivity of both regions to obtain the 90% C.L. upper limits, and , for scalar and tensor interactions, respectively.
This measurement is also sensitive to , where is a hypothetical stable weakly interacting particle, or system of particles. Fig. 6 shows 90% C.L. upper limits on together with the previous limit from [23]. The dotted line in Fig. 6 is the single event sensitivity defined as the inverse of the acceptance for multiplied by the total number of stopped kaons as a function of .
The rest of the data from E787 is now under analysis for Region 2. It is expected that the rest of the data should have lower background from because of better performance from both the PBG detector and the CCD pulse digitizing system on the target.
4 E949 and CKM
E949 is based upon incremental upgrades to the techniques and technology of E787. The extensive analysis of E787 data has been used to project the sensitivity of E949. The net increase in sensitivity per year of E949 over initial E787 running is a factor of 13 coming from improvements summarized in Table 5. The most important detector upgrades are additional photon veto systems as well as improved trigger and data acquisition systems for better efficiency. The largest factor in sensitivity, however, comes from the improved accelerator operations that will be optimized for E949. The AGS will be operated during the next several years in conjunction with RHIC which requires injection roughly twice per day leaving 20 hrs./day available for AGS slow extracted beam. E949 will be the primary (or only) AGS user during the 2001-2003 period. After the proposed E949 running time of 6000 hours (2 years or about 60 weeks), the expected sensitivity will be . Combined with the E787 data, the result will reach with 0.7 expected background events. As reported in this paper we now have much better understanding of the background expected in Region 2. We have placed new photon veto systems in the upgraded E949 detector to reduce the background in Region 2 further. With the added acceptance from Region 2 below the , the total sensitivity may reach . We would therefore expect to see 7–13 events if the branching ratio is equal to the central SM value of .
| Upgrade | Imprvmnt. |
|---|---|
| factor | |
| Lower momentum | 1.44 |
| Higher duty factor | 1.53 |
| E787 improvements | 1.54 |
| Addtl. efficiency improvements | 1.9 |
| Rate effects & below | 2 |
| Total | 13 |
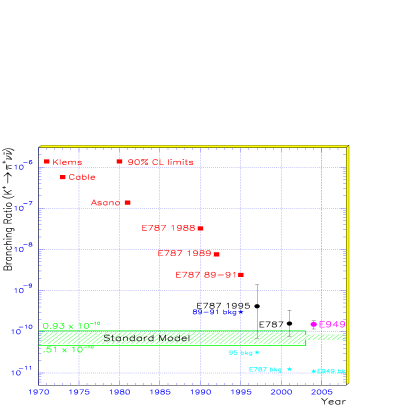 |
Fig. 7 is a plot of the progress in sensitivity for experiments. Included are experiments that set 90% CL limits (earlier E787 results and previous experiments), as well as the single event sensitivities for E787 and E949.
The E949 collaboration has physicists from BNL, FNAL, UBC, TRIUMF, KEK, Alberta, Osaka, Fukui, IHEP-Moscow, INR-Moscow, Kyoto, UNM, RCNP.
An experiment (CKM) to measure using a very high flux of kaons in flight has recently been approved at Fermilab [25]. The experiment relies on radio frequency separation techniques to obtain a clean 20 Gev/c kaon beam with intensity of 30 MHz. Many of the photon veto and background reduction techniques will be similar to E787, however, CKM will employ a ring imaging Cerenkov detector to obtain additional measurement of the decay kinematics to reduce background. The experiment intends to obtain 100 events with low background to make a precise measurement of this decay. An additional feature of CKM is that since it employs kaons decaying in flight, the main background in E787 for Region 2 should not present as much difficulty. The detailed enumeration of backgrounds in Region 2 in E787 analysis is therefore important for CKM.
5 KOPIO


Conclusive measurement of , which is estimated to be , requires a high kaon flux and very good background suppression. The backgrounds mainly come from competing decays that also yield s with branching ratios that are millions of times larger, e.g. . Interactions between neutrons and kaons in the neutral beam with residual gas in the decay volume can also result in emission of single s, as can the decays of hyperons which might occur in the decay region, e.g. . The current experimental limit [26] is a by-product of the KTeV experiment at Fermilab. It employed the Dalitz decay . An experimental improvement in sensitivity of more than four orders of magnitude is therefore required to obtain the signal for .
The KOPIO experiment [27] is designed to provide maximum possible redundancy for this kinematically unconstrained 3 body decay; the experiment has an optimum system for ensuring that the observed is the only detectable particle emanating from the decay, and has multiple handles for identifying possible small backgrounds. KOPIO employs a novel low energy, time-structured beam to allow determination of the incident kaon momentum. This intense beam, with its special characteristics, can be provided only by the BNL Alternating Gradient Synchrotron (AGS) [28]. Utilizing low momentum also permits a detection system for the decay photons that yields a fully constrained reconstruction of the ’s mass, energy, and, momentum. The photon veto system has features similar to those employed successfully in the E787 measurement of .
In Figure 8 we show a simplified representation of the beam and detector concept. The 24 GeV primary proton beam impinges on the kaon production target in 200 ps wide pulses at a rate of 25 MHz giving a microbunch separation of 40 ns. A 500 solid angle neutral beam is extracted at to produce a “soft” spectrum peaked at 0.65 GeV/c; kaons in the range from about 0.4 GeV/c to 1.3 GeV/c are used. The vertical acceptance of the beam (0.005 r) is kept much smaller than the horizontal acceptance (0.100 r) so that effective collimation can be obtained to severely limit beam halos and to obtain an additional constraint on the decay vertex position. Downstream of the final beam collimator is a 4 m long decay region which is surrounded by the main detector. Approximately 16% of the kaons decay yielding a decay rate of about 14 MHz. The beam region is evacuated to a level of Torr to suppress neutron-induced production. The decay region is surrounded by an efficient Pb/scintillator photon veto detector (“barrel veto”). In order to simplify triggering and offline analysis, only events with the signature of a single kaon decay producing two photons occurring within the period between microbunches are accepted.
Photons from decay are observed in a two-stage endcap detector comprised of a fine-grained preradiator followed by an 18 radiation length (X0) electromagnetic calorimeter. The preradiator obtains the times, positions and angles of the interacting photons from decay by determining the initial trajectories of the first pairs. The preradiator consists of 64 0.034 X0-thick layers, each with plastic scintillator, converter and dual coordinate drift chamber. The preradiator has a total effective thickness of 2 X0 and functions to measure the photon positions and directions accurately in order to allow reconstruction of the decay vertex while also contributing to the achievement of sufficient energy resolution.
The calorimeter located behind the preradiator consists of “Shashlyk” tower modules, 11 cm by 11 cm in cross section and 18 X0 in depth. A Shashlyk calorimeter module consists of a stack of square tiles with alternating layers of Pb and plastic scintillator read out by penetrating WLS fibers. The preradiator-calorimeter combination is expected to have an energy resolution of /E. Shashlyk is a proven technique which has been used effectively in BNL experiment E865 and is presently the main element in the PHENIX calorimeter at RHIC.
Suppression of most backgrounds is provided by a hermetic high efficiency charged particle and photon detector system surrounding the decay volume. The system includes scintillators inside the vacuum chamber, decay volume photon veto detectors and detectors downstream of the main decay volume. The barrel veto detectors are constructed as Pb/scintillator sandwiches providing about 18 X0 for photon conversion and detection. The detection efficiency for photons has been extensively studied with a similar system in BNL experiment E787. The downstream section of the veto system is needed to reject events where photons or charged particles leave the decay volume through the beam hole. It consists of a sweeping magnet with a horizontal field, scintillators to detect charged particles deflected out of the beam, and photon veto modules. A special group of counters - collectively, the “catcher” - vetoes particles that leave the decay volume but remain in the beam phase space. This system takes advantage of the low energy nature of our environment to provide the requisite veto efficiency while being blind to the vast majority of neutrons and s in the beam. The catcher uses aerogel Cerenkov radiators read out with phototubes.
The goal of KOPIO is to obtain about 60 events with a signal to background ratio of greater than 2:1. This will yield a statistical uncertainty in the measurement of the area of the CKM unitarity triangle of less than 10%. While is clearly the focus of KOPIO, many other radiative decays of significant interest to the study of low energy QCD will be measured and numerous searches for non-SM processes will also be conducted simultaneously.
The KOPIO collaboration includes UBC, BNL, Cincinnati, Kyoto, Moscow (INR), New Mexico, TJNAF, TRIUMF, Virginia, VPI, Yale, and Zurich. The experiment is scheduled to begin operation in 2005.
6 Conclusion
This work was supported by the U.S. Department of Energy under Contract No. DE-AC02-98CH10886.
References
- [1] S. Adler et al., Phys. Rev. Lett. 88, 041803 (2002). S. Adler et al. Phys. Rev. Lett. 84, 3768 (2000) and Phys. Rev. Lett. 79, 2204 (1997).
- [2] S. Adler, et al., Phys. Lett. B 537/3-4, 211-216 (2002).
- [3] A. J. Buras, Preprint hep-ph/0101336 (2001), A. J. Buras and R. Fleischer, Phys. Rev. D 64 (2001) 115010. G. Buchalla and A. J. Buras, Nucl. Phys. B548, 309 (1999). G. Buchalla and A.J. Buras, Nucl. Phys. B400, 225 (1993);
- [4] G. Buchalla and A.J. Buras, Nucl. Phys. B412, 106 (1994).
- [5] W.J. Marciano and Z. Parsa, Phys. Rev. D53, R1 (1996).
- [6] L. Littenberg, Phys. Rev. D39, 3322 (1989).
- [7] C. Jarlskog and R. Stora, Phys. Lett. B 208, 268 (1988).
- [8] G. Isidori, in Kaon Physics, edited by J. L. Rosner and B. D. Winstein (The University of Chicago Press, Chicago, 2001), p.355. Also see, G. D’Ambrosio and G. Isidori, Phys. Lett. B530(2002)108.
- [9] M. Leurer, Phys. Rev. Lett. 71, 1324 (1993); S. Davidson, D. Bailey, and B. Campbell, Z. Phys. C61, 613 (1994); A.J. Buras, A. Romanino, and L.Silvestrini, Nucl. Phys. B520, 3 (1998): G-C. Cho, hep-ph/9804327, KEK-TH-568, Apr 1998; T. Goto, Y. Okada, and Y. Shimizu, hep-ph/9804294, KEK-TH-567, Apr 1998; G. Couture and H. Knig, Z. Phys. C69, 167 (1996).
- [10] Y. Grossman and Y. Nir, Phys. Lett. B398, 163 (1997).
- [11] G. Bélanger, C.G. Geng and P. Turcotte, Phys. Rev. D46, 2950 (1992); C.E. Carlson, G.D. Dorata and M. Sher, Phys. Rev. D54, 4393 (1996) hep-ph/9606269.
- [12] Y. Nir and M. Worah, Phys. Lett. B423, 319 (1998).
- [13] S. Bertolini and A. Santamaria, Nucl. Phys. B 315, 558 (1989).
- [14] T.M. Aliev, M.I. Dobroliubov, and A. Yu. Ignatiev, Nucl. Phys. B335, 311(1990).
- [15] J. Dornboos et al., Nucl. Instr. Meth. A444, 546 (2000).
- [16] M.S. Atiya et al., Nucl. Instrum. Methods Phys. Res. A 321, 129 (1992)
- [17] D.A. Bryman et al., Nucl. Instrum. Meth. A 396 394 (1997).
- [18] I-H. Chiang et al., IEEE Trans. Nucl. Sci. NS-42, 394 (1995). T.K. Komatsubara et al., Nucl. Instrum. Methods A 404, 315 (1998).
- [19] E.W. Blackmore et al., Nucl. Instrum. Methods Phys. Res. A 404, 295 (1998).
- [20] M.S. Atiya et al., Nucl. Instrum. Methods Phys. Res. A 279, 180 (1989).
- [21] P. Bergbusch, Ph. D. Thesis, University of British Columbia, (2000); N. Muramatsu, Ph. D. Thesis, University of Tokyo, KEK-Report 2001-1(2001).
- [22] T. Junk, NIM A434 (1999) 435.
- [23] M.S. Atiya, et al., Phys. Rev. D 48, R1 (1993).
- [24] Review of Particle Physics, Eur. Phys. Jour. 15, 201 (2000). G. J. Feldman and R. D. Cousins, Phys. Rev. D 57, 3873 (1998). We have used the 90% C.L. upper limit of 3.6 for 1 observed event with expected background of 0.73.
- [25] “Charged Kaons at the Main Injector”, J. Frank, et al., Fermilab Proposal, April 2, 2001. hep-ex/0007021 (2000).
- [26] A. Alavi-Harati et al., Phys. Rev. D61, 072006 (2000).
- [27] Rare Symmetry Violating Processes, A proposal to the National Science Foundation to construct the MECO and KOPIO experiments, Oct 1999. http://pubweb.bnl.gov/people/e926/
- [28] J.W. Glenn, AGS/AD Technote 426 (1996); J. W. Glenn, et al., Proc. Particle Accelerator Conference, IEEE, 967 (1998).