DESY 02-062 ISSN 0418-9833
May 2002
Search for QCD Instanton-Induced Processes in Deep-Inelastic Scattering at HERA
H1 Collaboration
Signals of QCD instanton-induced processes are searched for in deep-inelastic scattering (DIS) at the electron-proton collider HERA in a kinematic region defined by the Bjorken-scaling variables , and photon virtualities . Several observables characterising hadronic final state properties of QCD instanton-induced events are exploited to identify a potentially instanton-enriched domain. While an excess of events with instanton-like topology over the expectation of the standard DIS background is observed it can not be claimed to be significant given the uncertainty of the simulation. Upper limits on the cross-section for instanton-induced processes of between and are set dependent on the kinematic domain considered. The data do not exclude the cross-section predicted by instanton perturbation theory for small instanton sizes. At large instanton sizes a naive extrapolation of instanton perturbation theory yields a cross-section in the range of sensitivity of this study. Such a cross-section is not observed, in agreement with non-perturbative lattice simulations of the QCD vacuum.
To be submitted to Eur. Phys. J. C
C. Adloff33, V. Andreev24, B. Andrieu27, T. Anthonis4, A. Astvatsatourov35, A. Babaev23, J. Bähr35, P. Baranov24, E. Barrelet28, W. Bartel10, J. Becker37, M. Beckingham21, A. Beglarian34, O. Behnke13, C. Beier14, A. Belousov24, Ch. Berger1, T. Berndt14, J.C. Bizot26, J. Böhme10, V. Boudry27, W. Braunschweig1, V. Brisson26, H.-B. Bröker2, D.P. Brown10, W. Brückner12, D. Bruncko16, F.W. Büsser11, A. Bunyatyan12,34, A. Burrage18, G. Buschhorn25, L. Bystritskaya23, A.J. Campbell10, T. Carli10, S. Caron1, F. Cassol-Brunner22, D. Clarke5, C. Collard4, J.G. Contreras7,41, Y.R. Coppens3, J.A. Coughlan5, M.-C. Cousinou22, B.E. Cox21, G. Cozzika9, J. Cvach29, J.B. Dainton18, W.D. Dau15, K. Daum33,39, M. Davidsson20, B. Delcourt26, N. Delerue22, R. Demirchyan34, A. De Roeck10,43, E.A. De Wolf4, C. Diaconu22, J. Dingfelder13, P. Dixon19, V. Dodonov12, J.D. Dowell3, A. Droutskoi23, A. Dubak25, C. Duprel2, G. Eckerlin10, D. Eckstein35, V. Efremenko23, S. Egli32, R. Eichler36, F. Eisele13, E. Eisenhandler19, M. Ellerbrock13, E. Elsen10, M. Erdmann10,40,e, W. Erdmann36, P.J.W. Faulkner3, L. Favart4, A. Fedotov23, R. Felst10, J. Ferencei10, S. Ferron27, M. Fleischer10, P. Fleischmann10, Y.H. Fleming3, G. Flügge2, A. Fomenko24, I. Foresti37, J. Formánek30, G. Franke10, G. Frising1, E. Gabathuler18, K. Gabathuler32, J. Garvey3, J. Gassner32, J. Gayler10, R. Gerhards10, C. Gerlich13, S. Ghazaryan4,34, L. Goerlich6, N. Gogitidze24, C. Grab36, V. Grabski34, H. Grässler2, T. Greenshaw18, G. Grindhammer25, T. Hadig13, D. Haidt10, L. Hajduk6, J. Haller13, W.J. Haynes5, B. Heinemann18, G. Heinzelmann11, R.C.W. Henderson17, S. Hengstmann37, H. Henschel35, R. Heremans4, G. Herrera7,44, I. Herynek29, M. Hildebrandt37, M. Hilgers36, K.H. Hiller35, J. Hladký29, P. Höting2, D. Hoffmann22, R. Horisberger32, A. Hovhannisyan34, S. Hurling10, M. Ibbotson21, Ç. İşsever7, M. Jacquet26, M. Jaffre26, L. Janauschek25, X. Janssen4, V. Jemanov11, L. Jönsson20, C. Johnson3, D.P. Johnson4, M.A.S. Jones18, H. Jung20,10, D. Kant19, M. Kapichine8, M. Karlsson20, O. Karschnick11, F. Keil14, N. Keller37, J. Kennedy18, I.R. Kenyon3, S. Kermiche22, C. Kiesling25, P. Kjellberg20, M. Klein35, C. Kleinwort10, T. Kluge1, G. Knies10, B. Koblitz25, S.D. Kolya21, V. Korbel10, P. Kostka35, S.K. Kotelnikov24, R. Koutouev12, A. Koutov8, J. Kroseberg37, K. Krüger10, T. Kuhr11, T. Kurča16, D. Lamb3, M.P.J. Landon19, W. Lange35, T. Laštovička35,30, P. Laycock18, E. Lebailly26, A. Lebedev24, B. Leißner1, R. Lemrani10, V. Lendermann7, S. Levonian10, M. Lindstroem20, B. List36, E. Lobodzinska10,6, B. Lobodzinski6,10, A. Loginov23, N. Loktionova24, V. Lubimov23, S. Lüders36, D. Lüke7,10, L. Lytkin12, N. Malden21, E. Malinovski24, I. Malinovski24, S. Mangano36, R. Maraček25, P. Marage4, J. Marks13, R. Marshall21, H.-U. Martyn1, J. Martyniak6, S.J. Maxfield18, D. Meer36, A. Mehta18, K. Meier14, A.B. Meyer11, H. Meyer33, J. Meyer10, P.-O. Meyer2, S. Mikocki6, D. Milstead18, S. Mohrdieck11, M.N. Mondragon7, F. Moreau27, A. Morozov8, J.V. Morris5, K. Müller37, P. Murín16,42, V. Nagovizin23, B. Naroska11, J. Naumann7, Th. Naumann35, G. Nellen25, P.R. Newman3, F. Niebergall11, C. Niebuhr10, O. Nix14, G. Nowak6, J.E. Olsson10, D. Ozerov23, V. Panassik8, C. Pascaud26, G.D. Patel18, M. Peez22, E. Perez9, A. Petrukhin35, J.P. Phillips18, D. Pitzl10, R. Pöschl26, I. Potachnikova12, B. Povh12, G. Rädel1, J. Rauschenberger11, P. Reimer29, B. Reisert25, D. Reyna10, C. Risler25, E. Rizvi3, P. Robmann37, R. Roosen4, A. Rostovtsev23, S. Rusakov24, K. Rybicki6, D.P.C. Sankey5, S. Schätzel13, J. Scheins1, F.-P. Schilling10, P. Schleper10, D. Schmidt33, D. Schmidt10, S. Schmidt25, S. Schmitt10, M. Schneider22, L. Schoeffel9, A. Schöning36, T. Schörner25, V. Schröder10, H.-C. Schultz-Coulon7, C. Schwanenberger10, K. Sedlák29, F. Sefkow37, V. Shekelyan25, I. Sheviakov24, L.N. Shtarkov24, Y. Sirois27, T. Sloan17, P. Smirnov24, Y. Soloviev24, D. South21, V. Spaskov8, A. Specka27, H. Spitzer11, R. Stamen7, B. Stella31, J. Stiewe14, I. Strauch10, U. Straumann37, M. Swart14, S. Tchetchelnitski23, G. Thompson19, P.D. Thompson3, N. Tobien10, F. Tomasz14, D. Traynor19, P. Truöl37, G. Tsipolitis10,38, I. Tsurin35, J. Turnau6, J.E. Turney19, E. Tzamariudaki25, S. Udluft25, A. Uraev23, M. Urban37, A. Usik24, S. Valkár30, A. Valkárová30, C. Vallée22, P. Van Mechelen4, S. Vassiliev8, Y. Vazdik24, A. Vest1, A. Vichnevski8, K. Wacker7, J. Wagner10, R. Wallny37, B. Waugh21, G. Weber11, D. Wegener7, C. Werner13, N. Werner37, M. Wessels1, G. White17, S. Wiesand33, T. Wilksen10, M. Winde35, G.-G. Winter10, Ch. Wissing7, M. Wobisch10, E.-E. Woehrling3, E. Wünsch10, A.C. Wyatt21, J. Žáček30, J. Zálešák30, Z. Zhang26, A. Zhokin23, F. Zomer26, and M. zur Nedden10
1 I. Physikalisches Institut der RWTH, Aachen, Germanya
2 III. Physikalisches Institut der RWTH, Aachen, Germanya
3 School of Physics and Space Research, University of Birmingham,
Birmingham, UKb
4 Inter-University Institute for High Energies ULB-VUB, Brussels;
Universiteit Antwerpen (UIA), Antwerpen; Belgiumc
5 Rutherford Appleton Laboratory, Chilton, Didcot, UKb
6 Institute for Nuclear Physics, Cracow, Polandd
7 Institut für Physik, Universität Dortmund, Dortmund, Germanya
8 Joint Institute for Nuclear Research, Dubna, Russia
9 CEA, DSM/DAPNIA, CE-Saclay, Gif-sur-Yvette, France
10 DESY, Hamburg, Germany
11 Institut für Experimentalphysik, Universität Hamburg,
Hamburg, Germanya
12 Max-Planck-Institut für Kernphysik, Heidelberg, Germany
13 Physikalisches Institut, Universität Heidelberg,
Heidelberg, Germanya
14 Kirchhoff-Institut für Physik, Universität Heidelberg,
Heidelberg, Germanya
15 Institut für experimentelle und Angewandte Physik, Universität
Kiel, Kiel, Germany
16 Institute of Experimental Physics, Slovak Academy of
Sciences, Košice, Slovak Republice,f
17 School of Physics and Chemistry, University of Lancaster,
Lancaster, UKb
18 Department of Physics, University of Liverpool,
Liverpool, UKb
19 Queen Mary and Westfield College, London, UKb
20 Physics Department, University of Lund,
Lund, Swedeng
21 Physics Department, University of Manchester,
Manchester, UKb
22 CPPM, CNRS/IN2P3 - Univ Mediterranee,
Marseille - France
23 Institute for Theoretical and Experimental Physics,
Moscow, Russial
24 Lebedev Physical Institute, Moscow, Russiae
25 Max-Planck-Institut für Physik, München, Germany
26 LAL, Université de Paris-Sud, IN2P3-CNRS,
Orsay, France
27 LPNHE, Ecole Polytechnique, IN2P3-CNRS, Palaiseau, France
28 LPNHE, Universités Paris VI and VII, IN2P3-CNRS,
Paris, France
29 Institute of Physics, Academy of
Sciences of the Czech Republic, Praha, Czech Republice,i
30 Faculty of Mathematics and Physics, Charles University,
Praha, Czech Republice,i
31 Dipartimento di Fisica Università di Roma Tre
and INFN Roma 3, Roma, Italy
32 Paul Scherrer Institut, Villigen, Switzerland
33 Fachbereich Physik, Bergische Universität Gesamthochschule
Wuppertal, Wuppertal, Germany
34 Yerevan Physics Institute, Yerevan, Armenia
35 DESY, Zeuthen, Germany
36 Institut für Teilchenphysik, ETH, Zürich, Switzerlandj
37 Physik-Institut der Universität Zürich, Zürich, Switzerlandj
38 Also at Physics Department, National Technical University,
Zografou Campus, GR-15773 Athens, Greece
39 Also at Rechenzentrum, Bergische Universität Gesamthochschule
Wuppertal, Germany
40 Also at Institut für Experimentelle Kernphysik,
Universität Karlsruhe, Karlsruhe, Germany
41 Also at Dept. Fis. Ap. CINVESTAV,
Mérida, Yucatán, Méxicok
42 Also at University of P.J. Šafárik,
Košice, Slovak Republic
43 Also at CERN, Geneva, Switzerland
44 Also at Dept. Fis. CINVESTAV,
México City, Méxicok
a Supported by the Bundesministerium für Bildung und Forschung, FRG,
under contract numbers 05 H1 1GUA /1, 05 H1 1PAA /1, 05 H1 1PAB /9,
05 H1 1PEA /6, 05 H1 1VHA /7 and 05 H1 1VHB /5
b Supported by the UK Particle Physics and Astronomy Research
Council, and formerly by the UK Science and Engineering Research
Council
c Supported by FNRS-FWO-Vlaanderen, IISN-IIKW and IWT
d Partially Supported by the Polish State Committee for Scientific
Research, grant no. 2P0310318 and SPUB/DESY/P03/DZ-1/99
and by the German Bundesministerium für Bildung und Forschung
e Supported by the Deutsche Forschungsgemeinschaft
f Supported by VEGA SR grant no. 2/1169/2001
g Supported by the Swedish Natural Science Research Council
i Supported by the Ministry of Education of the Czech Republic
under the projects INGO-LA116/2000 and LN00A006, by
GAUK grant no 173/2000
j Supported by the Swiss National Science Foundation
k Supported by CONACyT
l Partially Supported by Russian Foundation
for Basic Research, grant no. 00-15-96584
1 Introduction
The Standard Model of particle physics is known to contain certain processes which violate the conservation of baryon and lepton number () in the case of electroweak interactions and chirality in the case of strong interactions [1]. Such anomalous processes cannot be described by standard perturbation theory. They are induced by instantons [1, 2]. In the strong sector, described by quantum chromodynamics (QCD), instantons are non-perturbative fluctuations of the gluon field. They represent tunnelling transitions between topologically non-equivalent vacua. Deep-inelastic scattering (DIS) offers a unique opportunity [3] to discover a class of hard processes induced by small QCD instantons. The rate is calculable111For an exploratory calculation of the instanton-induced contribution to the gluon-induced part of the total DIS cross-section at large values of the Bjorken scaling variable , see Ref. [4]. within “instanton-perturbation theory” and is found to be sizeable [5, 6, 7]. Moreover, the instanton-induced final state exhibits a characteristic signature [3, 8, 9, 10, 11]. Detailed reviews are given in Refs. [12, 13].
An experimental observation of instanton-induced processes would constitute a discovery of a basic and novel non-perturbative QCD effect at high energies. The theory and phenomenology for the production of instanton-induced processes at HERA in positron proton collisions at a centre of mass energy of GeV has recently been worked out by Ringwald and Schrempp [3, 5, 6, 7, 8, 9]. The size of the predicted cross-section is large enough to make an experimental observation possible. The expected signal rate is, however, still small compared to that from the standard DIS process. The suppression of the standard DIS background is therefore the key issue in this analysis. QCD instanton-induced processes can be discriminated from standard DIS by their characteristic hadronic final state signature, consisting of a large number of hadrons at high transverse energy emerging from a “fire-ball”-like topology in the instanton rest system [3, 8, 9]. Derived from simulations studies characteristic observables are exploited to identify a phase space region where a difference between data and the standard DIS simulations would indicate a contribution from instanton-induced processes.
Upper cross-section limits on instanton-induced processes based on standard hadronic final state observables measured with the H1 detector have already been derived in Refs. [14, 15, 16]. Here, we present for the first time a dedicated experimental search for instanton-induced processes in high energy particle collisions.
2 Phenomenology of QCD Instanton-Induced Processes in DIS
Instanton () processes in DIS at HERA are discussed within the framework of the work of Ringwald and Schrempp [3, 5, 6, 7, 8, 9]. These processes dominantly occur in a photon gluon () fusion process as sketched in Fig. 1. The characteristic -event signatures result from the following basic reaction:
| (1) |
where , () denotes gluons, right-handed quarks (anti-quarks), is the number of quark flavours and is the number of gluons produced. Right-handed quarks are produced in -induced processes, left-handed quarks are produced in anti-instanton ) processes. The final state induced by instantons or anti-instantons can only be distinguished by the chirality of the quarks. Experimental signatures sensitive to instanton-induced chirality violation are not exploited in this analysis. Both -processes and -processes enter in the calculation of the total cross-section.
 |
|
As shown in Fig. 1, a photon splits into a quark anti-quark pair in the background of an instanton or an anti-instanton field. The so-called -subprocess is produced by the quark or the anti-quark fusing with a gluon from the proton. The respective partonic final state includes light quarks and anti-quarks. Therefore, together with the current quark (), in every -event, quark anti-quark pairs of each of the (light) flavours are simultaneously produced222 In principle, also heavy flavours contribute whenever very small instantons are probed. In general, however, the quarks must appear approximately massless on the scale of the dominant effective -size , i.e. , where is the quark mass. In the HERA kinematic region, the rate is dominated by such that only up, down and strange quarks appear massless (). The contribution of charm and bottom quarks to the cross-section is likely to be small. It was checked that the predicted final state signature does not change significantly if heavy quarks are included in the simulation.. In addition, a mean number of gluons is expected to be emitted in the -subprocess.
The quarks and gluons emerging from the -subprocess are isotropically distributed in the -rest system defined by . One expects therefore a pseudo-rapidity333The pseudo-rapidity of a particle is defined as , where is the polar angle with respect to the proton direction defining the -axis. () region with a width of typically units in . This region is densely populated with particles of relatively high transverse momentum which are homogeneously distributed in azimuth in the -rest frame. Apart from this pseudo-rapidity band, the hadronic final state exhibits a current jet emerging from the outgoing current quark . The large number of partons emitted in the -process leads to a high multiplicity of charged and neutral particles in every event.
The actual number of produced hadrons and their energies crucially depends on the centre of mass energy available in the -system, which in turn can be written (see Fig. 1) in terms of the variables and describing the kinematics of the -subprocess. These variables are defined in analogy to the Bjorken scaling variables and . A knowledge of the distributions of these variables is indispensable for the correct prediction of the hadronic final state. These distributions can be calculated within -perturbation theory [5, 6] for large and .
The total -production cross-section at HERA, , is essentially determined by the cross-section of the -subprocess denoted by . The latter can be calculated by integrating444For simplicity, the additional integration over the relative colour orientation has already been performed in equation (2). Both instanton and anti-instanton degrees of freedom enter in the cross-section formula, since it is obtained from taking the modulus squared of the amplitude depicted in Fig. 1. The complete formula and more details can, for instance, be found in Ref. [6] which contains as well the explicit physical interpretation of the variables and . over the ()-size and the distance -vector :
| (2) |
where several parts of the integrand have been omitted. () is the -size (-size) distribution that is calculable within -perturbation theory [1] for with being the strong coupling taken at the renormalisation scale and for QCD [1, 17, 18]:
| (3) |
where is a known scheme dependent constant.
The function , with , describes the -interaction associated with a resummation of final state gauge bosons. It is calculable in -perturbation theory, formally for , and may attenuate to some extent the exponent of the exponential in equation (3) that is typical for tunnelling transitions. For a general gauge theory with coupling , equations (2) and (3) give the qualitative behaviour for the -cross-section:
| (4) |
Thus, in the absence of final state gauge boson effects (i.e. ), with typical values of at HERA and the weak gauge coupling , equation (4) illustrates the strong suppression of electroweak instanton effects which is absent in QCD:
| (5) |
In this picture the tiny instanton-induced electroweak violation will only be observable, if the final state emission of a huge number of -bosons counteracts the exponential suppression [19], i.e. . In QCD, however, final state gluons are expected to only provide a moderate numerical correction of the rate. Correspondingly, the predictions of the -induced rate in QCD depends much less on the resummation of final state gauge bosons.
According to equation (3) the -size distribution follows a power law:
| (6) |
and the integral over () generally diverges for large (). However, in the DIS regime the exponential factor appearing in equation (2) ensures the convergence of the integral. For large enough effectively only small size instantons contribute to the cross-section. Therefore the -cross-section is calculable in DIS [5].
The and the distributions can be calculated using quenched (for ), non-perturbative lattice simulations of the QCD vacuum. They will be discussed and compared with perturbative predictions in section 7. By confronting -perturbation theory with these lattice simulations, limits on the validity of -perturbation theory have been derived [6, 7, 10]. The calculations agree for and , which can be translated into limits on and , i.e. and [6, 10] where is the QCD scale in the scheme for flavours.
For the region, , , and , the -cross-section at HERA has been estimated to be [6]. This result has recently been updated [11, 12, 20] by using the 1998 world average of the strong coupling [21] to . The quoted errors for the -induced cross-section only contain the uncertainty obtained from varying the strong coupling. The change in leads to a change of the minimal required to . This cross-section has been derived for three-flavours, corresponding to . An additional cut, , is advocated [5, 10, 11] to reduce remaining theoretical uncertainties connected with non-planar diagrams.
In this domain the cross-section is . The calculation is based on a two loop renormalisation group invariant expression of the -density and thus does not depend much on the chosen renormalisation scale. In the kinematic domain in which this pioneering analysis is performed, i.e. the polar angle of the scattered positron , , and , the cross-section calculated with QCDINS555 In this result theoretical uncertainties connected with non-planar diagrams are not taken into account. However, the observables used in this analysis to calculate cross-section limits seem to be rather insensitive to these uncertainties [10]. is .
Even though these predictions have not yet reached the same quantitative level of precision as current standard perturbative QCD calculations, the cross-section is large enough to motivate dedicated searches for -processes at HERA.
3 The H1 Detector at HERA
A detailed description of the H1 detector can be found elsewhere [22]. Here we briefly introduce the detector components most relevant for this analysis: the liquid argon (LAr) calorimeter, the backward lead-fibre calorimeter (SpaCal) and the tracking chamber system.
The hadronic energy flow is mainly measured by the LAr calorimeter [23] extending over the polar angle range with full azimuthal coverage. It consists of an electromagnetic section ( radiation lengths) with lead absorber and a hadronic section with steel absorber. The total depth of both calorimeters varies between and interaction lengths. Test beam measurements of the LAr calorimeter modules show an energy resolution of for electromagnetic showers [24] and of for charged pions [25].
The backward lead-fibre calorimeter SpaCal [26] covers the polar angle range . In the electromagnetic section, with a depth of radiation lengths, the position and the energy of electrons are measured. The electron energy resolution is . In total, the SpaCal has two interaction lengths which provide additional measurements for hadrons.
The calorimeters are surrounded by a superconducting solenoid providing a uniform magnetic field of T parallel to the beam axis for momentum measurement of charged particles. These are measured in two concentric jet drift chamber modules (CJC), covering the polar angle range [27]. A backward drift chamber (BDC) aids identification of positrons scattered into the SpaCal calorimeter.
The luminosity is measured using the elastic Bethe-Heitler process . The final state positron and photon are detected in calorimeters situated close to the beam pipe at distances of m and m from the interaction point in the positron beam direction.
4 Simulation of Standard DIS and -Processes
Detailed simulation of the H1 detector response to hadronic final states have been performed for QCD models of the standard DIS processes and for QCD -induced scattering processes.
4.1 Simulation of Standard DIS
The RAPGAP Monte Carlo [28] incorporates the QCD matrix element and models higher order parton emissions to all orders in using the concept of parton showers [29] based on the leading logarithm DGLAP equations [30], where QCD radiation can occur before and after the hard subprocess. The formation of hadrons is performed using the LUND string model [31] implemented in JETSET [32]. This QCD Monte Carlo is called “MEPS”.
An alternative treatment of the perturbative phase is implemented in ARIADNE [33], where gluon emissions are simulated using the colour dipole model (CDM) [34] by assuming a chain of independently radiating dipoles spanned by colour connected partons. The first emission in the cascade is modified to reproduce the matrix element to first order in [35]. The hadronisation is performed using JETSET. This QCD Monte Carlo is called “CDM” in the following.
The CDM and the MEPS Monte Carlo simulations are both interfaced to the program HERACLES [36] to include electroweak corrections to the lepton vertex, where is the electromagnetic coupling.
The Monte Carlo DIS samples have been generated using the CTEQ4 [38] parton density functions and have been reweighted using a parametrisation extracted from the recent H1 measurement of the proton structure function [39].
The MEPS and the CDM models have been comprehensively compared to a variety of hadronic final state data, and an attempt has been made to optimise the free model parameters [40, 41]. No single parameter set was found which describes all studied distributions well. Moreover, the Monte Carlo models make different predictions. Therefore and in view of the involved approximations it is questionable to what extent the currently available QCD models can describe the standard DIS hadronic final state in particular in the tails of distributions. In this analysis the Monte Carlo models have been used with their default parameter values.
4.2 Simulation of QCD Instanton-induced Processes
QCDINS [11, 42] is a Monte Carlo package to simulate QCD -induced scattering processes in DIS. It acts as a hard process generator embedded in the HERWIG [43] program. The hard process is treated according to the physics assumptions explained in section 2. Apart from the cut, the default parameters of the QCDINS 2.0 version were used, i.e. , and the number of flavours is set to . The CTEQ4 [38] parton density functions have been employed. After assembling the hard -subprocess, further QCD emissions are simulated in the leading-logarithm approximation. The coherent branching algorithm implemented in HERWIG is used. The transition from partons to the observable hadrons is performed with the cluster fragmentation model [44].
The hadronic final state topology is mainly influenced by the energy available for the hard -subprocess. It has been explicitly checked that the conclusions drawn from this analysis are unchanged when the LUND string model is used instead of the cluster fragmentation model. This has also been observed in Ref. [9], where in addition the effect of changing free model parameters in the hadronisation models has been studied. For what follows it is assumed that the commonly used hadronisation models are also applicable to describe the fragmentation of a large number of partons produced by the I-process in a narrow pseudo-rapidity region with high transverse energy.
5 Event Selection and Search Strategy
5.1 Inclusive DIS Event Selection
The data used in this analysis were collected in the years and with the H1 detector at the electron proton collider HERA. During this time HERA collided positrons at an energy of GeV with protons at an energy of GeV. The accumulated data sample corresponds to an integrated luminosity of pb-1.
The scattered positron is identified as the electromagnetic energy deposition with the highest energy. For this pioneering analysis we restrict the electron energy and angle measurement to the SpaCal calorimeter. The electron is required to lie well within the calorimeter and trigger acceptance of polar angles between and . A minimal positron energy of GeV is required. The events are triggered by demanding a localised energy deposition in the SpaCal together with loose track requirements in the multi-wire proportional and the drift chambers.
Furthermore the longitudinal momentum balance is required to lie within , where the sum runs over the scattered electron and all objects belonging to the hadronic final state. The hadronic final state objects are reconstructed from the calorimetric energy depositions in the LAr and the SpaCal calorimeters and from low momentum tracks ( GeV) in the central jet chamber according to the procedure described in [45]. The position of the coordinate of the reconstructed event vertex must be within of the nominal interaction point.
The photon virtuality and the Bjorken scaling variable are reconstructed from the scattered positron. The events are selected to cover the phase space region defined by , , and , where is the polar angle of the scattered positron.
The selected DIS data sample consists of about events. The simulated events reproduce well the shape and the absolute normalisation of the distributions of the energy and angle of the scattered positron as well as the kinematic variables , and . The contamination with events due to hadrons misidentified as positrons produced in collisions of high energetic protons with quasi-real photons is below . This was estimated using the Monte Carlo simulation program PHOJET [37], which contains the matrix elements for direct and resolved photon processes, parton showers and a phenomenological description of soft interactions.
5.2 Definition of the Discriminating Observables
The observables used to discriminate the -induced contribution from the standard DIS process are based on the hadronic final state. Only hadronic final state objects as defined in section 5.1 within are considered. Charged particles with transverse momenta of GeV are selected within . Here, both and are measured in the laboratory frame.
All hadronic final state objects are boosted to the hadronic centre-of-mass frame666The hadronic centre-of-mass frame is defined by , where () is the -momentum of the exchanged photon (proton).. Jets are defined by the cone algorithm [46, 47] with a cone radius of . The jet with the highest transverse energy () is used to estimate the -momentum of the current quark (see Fig. 1). can be reconstructed from the particles associated with the current jet and the photon -momentum, which is obtained using the measured momentum of the scattered positron. The cone size was chosen to optimise the resolution of the reconstruction of (see also Ref. [48]). The resolution is about . However, the distribution of the true over the reconstructed value exhibits large tails, since in about of the cases the wrong jet is identified as the current jet. Due to the limited accuracy of the reconstruction, the reconstructed cannot be used to experimentally control the “true” region of the -processes, but can nevertheless be exploited to discriminate -processes from the standard DIS background. The reconstructed is called in what follows. More information on the reconstruction can be found in [9, 48, 49]. The reconstruction of the variable is more difficult777 The data used for the present analysis do not incorporate a cut on . As noted in Refs. [7, 10], this presumably does not prevent a qualitative comparison with the Ringwald-Schrempp predictions in the fiducial and region for the following reason. The lattice data for the -distance distribution (from which the minimal theoretical -cut was deduced [6, 7, 10]) exhibit a rapid suppression of -effects for small -separation, corresponding to . Therefore, -contributions to the data from this region outside the validity of -perturbation theory can probably be neglected. and only possible for -events exhibiting the characteristic -topology [49].
The hadronic final state objects belonging to the current jet are not used in the definition of the following observables. A band in pseudo-rapidity with a width of units in is defined around the centre of gravity of the transverse energy () distribution of the hadronic final state objects (see Ref. [49] for details). This pseudo-rapidity band is called the -band in the following. The number of charged particles in the -band measured as tracks in the detector is counted () and the total scalar transverse energy of all hadronic final state objects in the -band is measured ().
All hadronic final state objects in the -band are boosted to an approximate -rest frame defined by , where is the average value expected by the QCDINS Monte Carlo simulation (see Fig. 1 for definition). In this system the sphericity () is calculated888The sphericity is defined as where and are the smallest of the three eigenvalues of the diagonalised sphericity tensor defined by , where and corresponds to the and components of the considered particle momenta . . For spherical events is close to , while for pencil-like events is . Furthermore, the axes and are found for which in the -rest system the summed projections of the -momenta of all hadronic final state objects in the -band are minimal or maximal [8]. The relative difference between and is called . This quantity is a measure of the transverse energy weighted azimuthal isotropy of an event. For isotropic events is small while for pencil-like events is large.
Three observables are used to enhance the fraction of -events in the inclusive data sample: the charged particle multiplicity in the -band (), the sphericity of all final state objects in the -band calculated in the approximate -rest frame () and the reconstructed . Three other observables, i.e. , and , contain additional information and will be used for further checks.
5.3 Comparison of Data to Standard QCD Predictions in Inclusive DIS
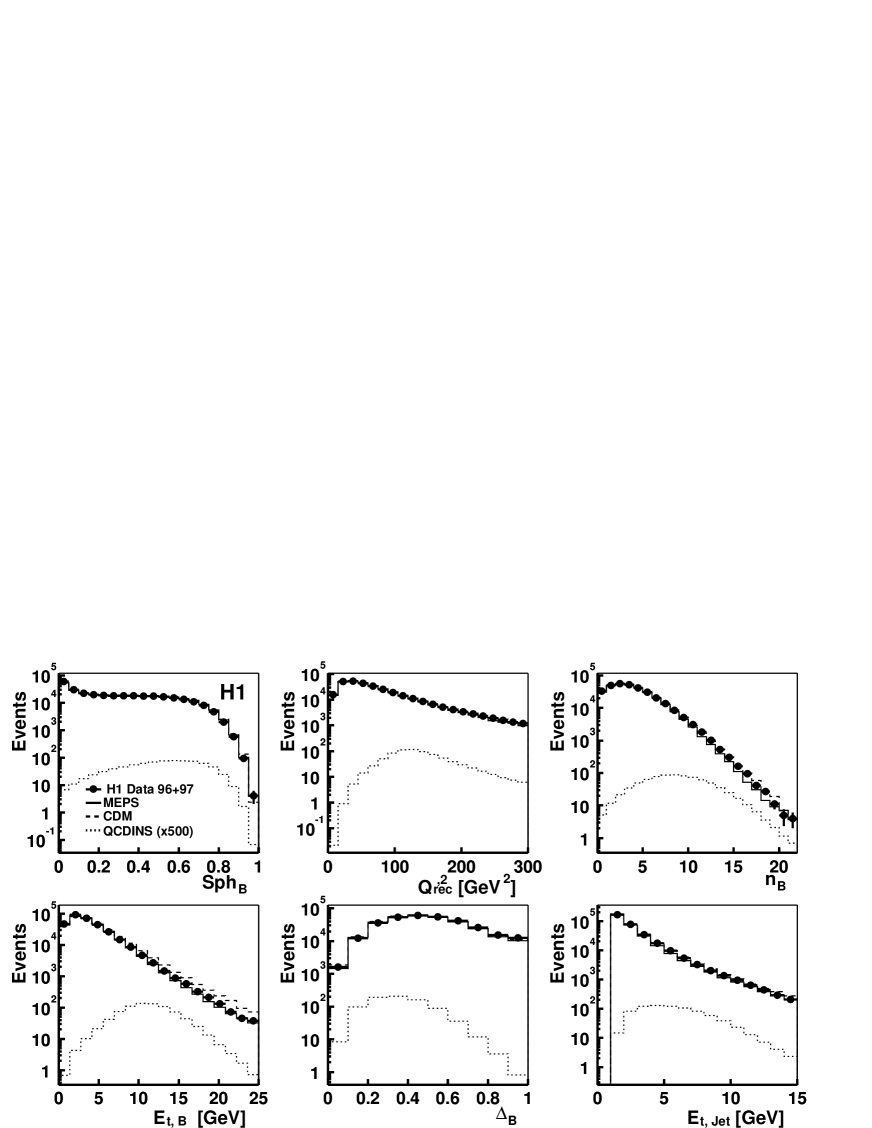
The distributions of the observables , and for data, for two standard DIS QCD models and for the -process are shown in Figs. 2 and 3. The gross features of the data are reasonably well described by both Monte Carlo simulations. The CDM model is able to describe the data within except at very low and very large sphericity values where a difference of is observed. The MEPS Monte Carlo reproduces the data within %. However, at large deviations up to are found.
The three other observables, i.e. , and , used as control distributions are shown in Figs. 2 and 3. The distribution is fairly well described (within ) by both standard DIS simulations. For the two standard DIS Monte Carlos simulations behave differently. MEPS describes the data within for GeV, but is lower by about for GeV. In the tail of this distribution (for GeV) the data are well reproduced up to the largest accessible values. The CDM model describes the data within for GeV, but the predictions progressively grow to be above the data at higher values. A harder tail than found in the data is also seen in the distribution. CDM overshoots the data by at large values. The MEPS simulation gives a much better description of this observable (within ). The hard transverse energy tail produced by CDM has also been observed in two-jet and three-jet production in DIS at HERA [41, 51, 52].
The instanton prediction is shown as a dotted line in Fig. 2 and Fig. 3. For visibility in Fig. 2 it is scaled up by a factor . The expected -signal is about two to three orders of magnitude smaller than the standard DIS background. Therefore cuts are needed to enhance the signal to background ratio.
6 Search for Instanton-Induced Events
Two methods are employed to increase the sensitivity to -processes: a combinatorial cut method described in section 6.1 and a multivariate discrimination technique based on a range search method described in section 6.2. While the main advantage of the combinatorial cut method is its simplicity, the multivariate discrimination technique allows the transition from a background dominated to an -enriched region to be investigated with one single observable.
6.1 Combinatorial Cut Based Method
The strategy to reduce the standard DIS background is based on the observables , and . These observables have been chosen, since they provide the best signal to background separation. Moreover, in the case of -induced processes the shape of their distributions is expected not to be much affected by contributions from non-planar diagrams [10] (see also section 2).
To find the optimal combinations of cut values the three observables are investigated using simulations of the standard DIS background and of the -signal. Amongst the studied cut combinations with an instanton efficiency the one is chosen with the best separation power, defined by , where is the fraction of remaining standard DIS background.
The best separation power is obtained for , and . For this cut combination () is found for the MEPS (CDM) simulation. At an -efficiency of about , the background has been suppressed by about a factor of . With these cuts, events are found in the data, while CDM predicts and MEPS (see also Tab. 1). The quoted errors on the expected event numbers include the statistical and the experimental systematic uncertainties.
The uncertainties arise from the following sources: a uncertainty in the hadronic energy scale of the LAr calorimeter, for the electromagnetic energy scale and for the hadronic energy scale measured in the SpaCal calorimeter, for the measurement of the track momentum, mrad for the polar and azimuthal angle of the track, () for tracks with a momentum above (below) MeV for inefficiencies in the track reconstruction and mrad for the polar angle of the scattered positron. These uncertainties have been propagated into the overall systematic error. An absolute normalisation error of % for the accuracy of the luminosity determination and a % uncertainty for the reweighting of the parton densities used in the Monte Carlo simulation have been included. The main contributions to the systematic uncertainties on the number of expected events are seen to arise from the track efficiency () and the momentum measurement ().
| Combinatorial cut method (section 6.1 ) | ||||
|---|---|---|---|---|
| N | ||||
| Data | ||||
| CDM | ||||
| MEPS | ||||
| Multivariate method (section 6.2) | ||||
| N | ||||
| Data | ||||
| CDM | ||||
| MEPS | ||||
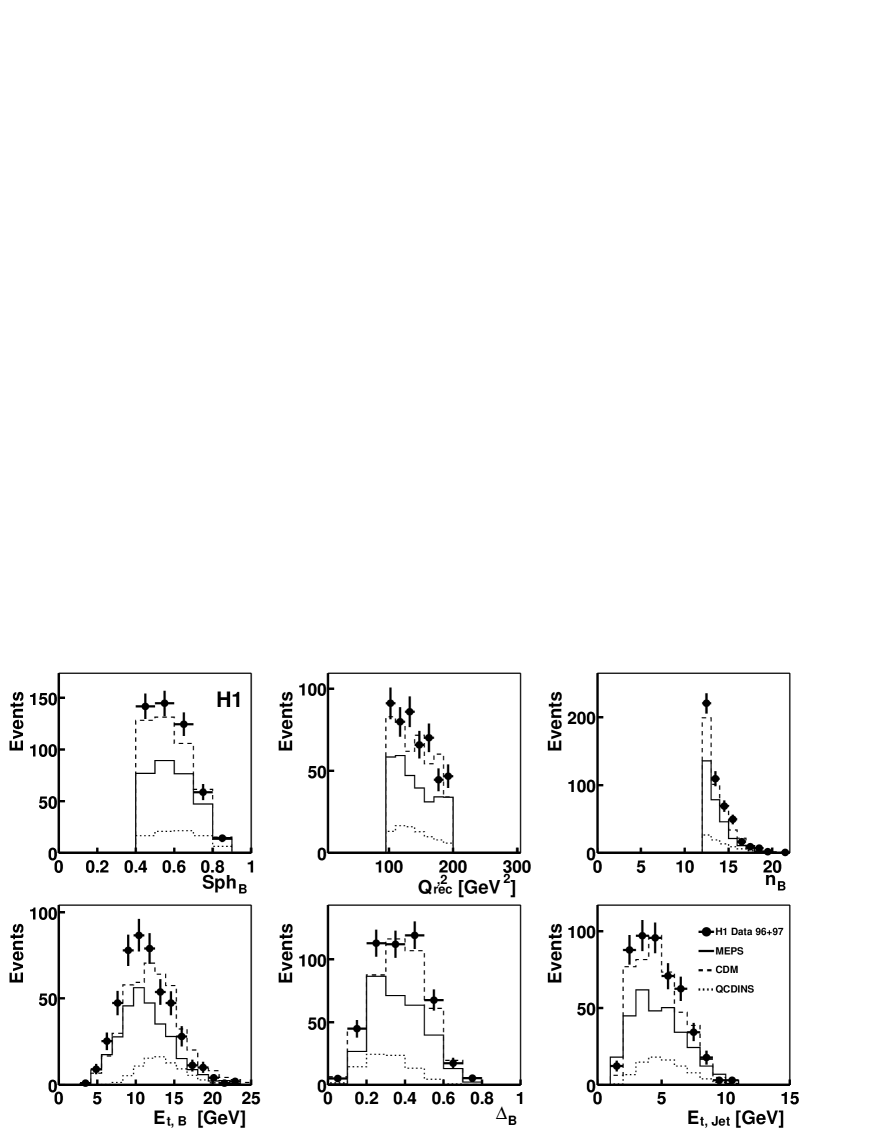
More events are found in the data than expected by either one of the background Monte Carlo simulations. MEPS suggests a clear excess in the data. In contrast to the findings before placing the cuts CDM is compatible with the data within errors. The predictions of the two standard DIS Monte Carlo simulations largely disagree with each other. This indicates that the background estimation is subject to large uncertainties as it is expected in this extreme region of phase space. The distribution of the discriminating observables after the cuts is shown in Fig. 4 in comparison with the standard DIS background expectation from the MEPS and the CDM Monte Carlo models. Fig. 4 also shows the expectation for the -contribution to the DIS process as modelled by QCDINS. In particular when compared to the MEPS model, the shape of the observed excess in the data is qualitatively compatible with an -signal for , and . However, it tends to lie towards low values in contrast to the -contribution. It has been noted in [10] that the (as the ) distribution expected for the -signal are most sensitive to theoretical uncertainties. A shift towards lower values is well possible within these uncertainties.
6.2 Search Based on a Multivariate Discrimination Technique
To make optimal use of the information contained in the observables separating the -signal and the background a multivariate discrimination technique is used. Events are classified as signal or background by estimating their probability density at each point in the phase space of the observables. Monte Carlo simulations are employed to sample these densities. The densities at each phase space point can be directly estimated by counting the number of expected signal and background events in a surrounding box. The likelihood of an event to be due to a signal can be defined by:
By cutting on this discriminator , the background contamination can be minimised at the expense of signal efficiency. For each value of the signal to background ratio as well as the signal efficiency can be easily calculated.
To estimate the and in the vicinity of a given event in the multi-dimensional phase space, a range search algorithm [53] based on a binary tree has been used. A more detailed description and the properties of this method can be found in [54, 55].
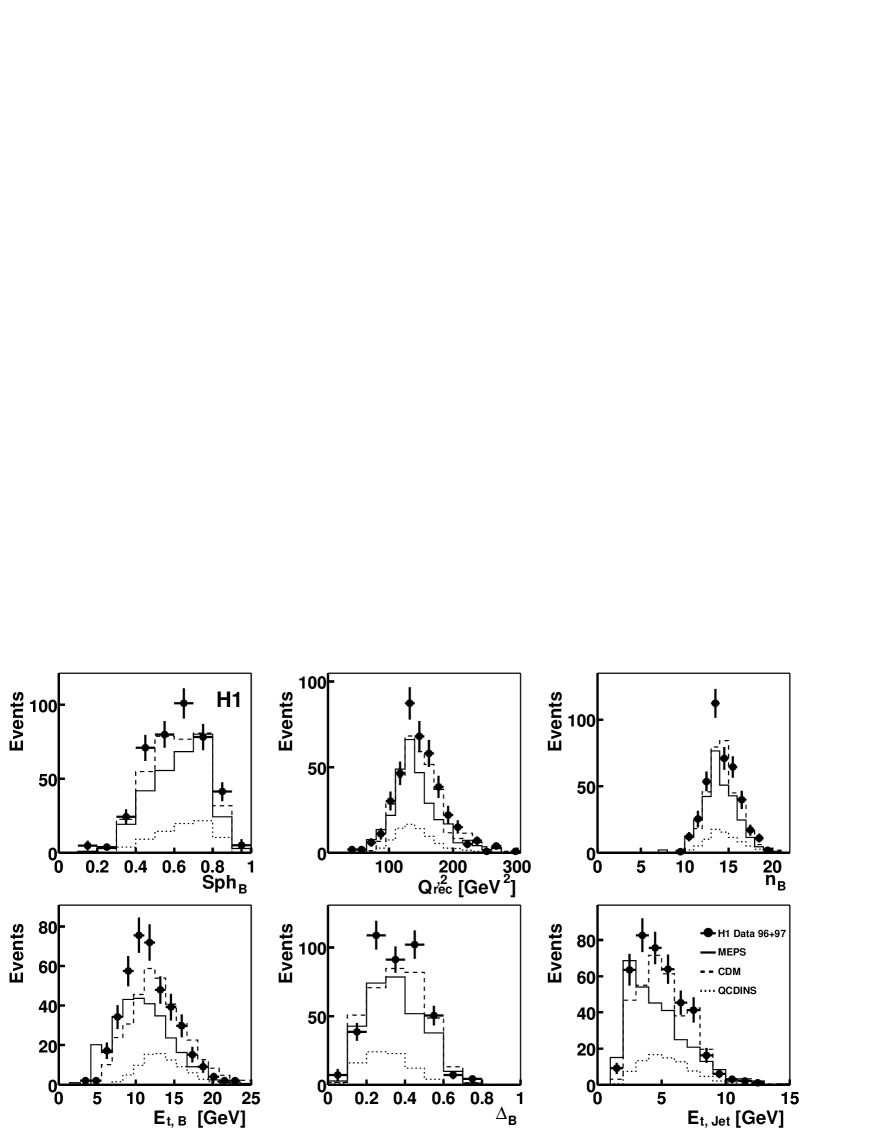
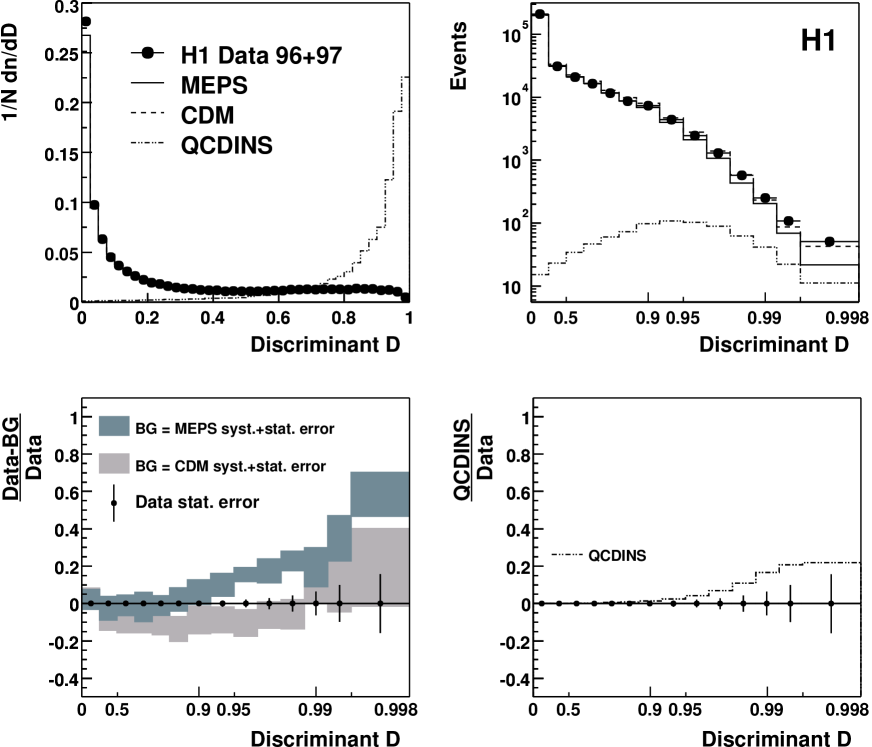
For the discriminator the phase space is spanned by the same observables , and , which are used for the combinatorial cut method. The discrimination power of the method is demonstrated in Fig. 6a where the shape of the discriminator distribution is shown. The simulated background events (solid and dashed line) are mainly concentrated at low values while the simulated -signal events (dotted line) are peaked towards . For , which corresponds to a cut at , a separation power of for MEPS and for CDM is obtained, respectively. The separation power is slightly improved with respect to the combinatorial cut method. events are observed in the data, while () are expected for CDM (MEPS) (see also Tab. 1). These results are consistent with the ones obtained from the cut-based method. The dominant contributions to the systematic uncertainties are attributed to the track efficiency (), the momentum measurement () and the energy scales in the calorimeters (). The discriminating observables after a cut are shown in Fig. 5. Note that the phase space region selected by the discriminator roughly coincides with the results of the combinatorial cut method. The observable distributions are suppressed at approximately the same points where the cuts have been placed by the combinatorial cut method. The shape of the excess in the data in the , and distributions is similar to the shape of the expected -distributions. The excess in the distribution is largest at while from -processes a peak at about is expected. Again, it should be noted that these distributions might be shifted towards lower values when contributions from non-planar diagrams are taken into account [10]. The fact that for the and the distributions the standard DIS Monte Carlo simulation also disagree with each other indicates large uncertainties from the different treatment of higher order QCD processes.
The multivariate discrimination technique offers furthermore the possibility to compare the description of the data by the Monte Carlo simulation in the complete phase space, i.e. from the region where no -contribution is expected () to the -enriched region (). Fig. 6b shows the absolutely normalised discriminator distribution on a logarithmic -axis scaled as . The majority of the standard DIS background events are concentrated at the lowest values. Towards larger values the background falls by three orders of magnitudes. The data roughly follow this trend. In the last three bins, a slight excess of data over background is observed. According to the QCDINS simulation, in this region % of all -events are contained. As shown in Fig. 6d, where the expected -signal with respect to the data is shown, the -contribution in the event sample is about %.
The description of the data by the background Monte Carlo simulations is illustrated in more detail in Fig. 6c, where the relative difference of background and data is shown. The MEPS Monte Carlo gives an excellent description of the data for which comprises the vast majority of events. Towards larger values an increasingly large excess of events is seen in the data. The largest discrepancy of is found at the largest value. The excess of data as a function of is qualitatively similar to the increasing ratio of QCDINS events to the data (see Fig. 6d).
From a purely statistical point of view the excess in particular in case of the MEPS background estimation is significant. However, the uncertainties in the background estimation are largely unknown in this extreme phase space region. This is also reflected in the different behaviour of the CDM Monte Carlo simulation. While it agrees with the data in the pure background region , it is not able to describe the data at larger values (), where no significant -contribution is expected. In this region CDM in contrast to MEPS predicts more events than found in the data. It is interesting that both CDM and MEPS fall below the data when the separation, i.e. , is largest. In the case of CDM this observation is, however, not significant given the experimental uncertainties. Whether the excess can be explained by -processes or whether it is simply due to a deficiency in the description of the relevant standard DIS process remains an open question. Altogether, despite some excess of events in the -signal region, the uncertainties in the background estimation are too large to draw firm conclusions.
7 Exclusion Limits for Instanton-induced Processes
Since no significant excess can be claimed upper limits on the QCD instanton cross-section are derived.
The hadronic final state of -induced events is strongly influenced by the centre-of-mass energy squared, , available for the partons emerging from the -subprocess. The distributions of the final state topology therefore crucially depend on both the minimal cut values, above which -perturbation theory is expected to be valid, and on the assumed and distributions, which are motivated by the validity of -perturbation theory and which are only under theoretical control for large enough and .
In this section first upper cross-section limits for instantons produced in the fiducial region and are derived. It is assumed that the and distributions are correctly described by -perturbation theory. This approach is based on the results described in section 6. To be less dependent on theoretical assumptions instantons are independently simulated in several bins of approximately constant and and the analysis is repeated. In this way the uncertainty on the assumed shape of the and distributions is minimised and the analysis is extended towards lower and value. Here, only the reasonable assumption is made that the topology of an -event is for a given correctly modelled by the -Monte Carlo simulation.
7.1 Exclusion Limits in the -Fiducial Region
First an upper limit on the -cross-section is derived at confidence level (CL) for instanton produced in the fiducial region, where the and distributions are calculated within the Ringwald-Schrempp approach. The number of observed events in the data and of expected standard DIS background events and the -signal efficiency obtained with the combinatorial cut method are used. To derive the cross-section limits the method described in Ref. [56] was used. For the background estimation and the selection efficiency statistical and systematic errors are taken into account by folding Gaussian distributions into the integration of the Poisson law used to determine the limit.
An -cross-section of ( ) is excluded when MEPS (CDM) is assumed to provide the correct background description. These results together with the ones obtained from the multivariate discrimination technique are summarised in Tab. 1. Both methods lead to similar results. The limits are not far from the predicted -cross-section of about .
As said before, it is questionable whether the CDM and MEPS models are able to adequately describe the standard DIS background in this extreme corner of phase space, where only of the events in the total sample of standard DIS events are expected. To be independent of the detailed modelling of the hadronic final state of DIS events, an additional upper limit is extracted where the expected standard DIS background is assumed to be zero. Whatever the “true” number of standard DIS events in the selected corner of phase space is, the -signal can certainly not be bigger than the number of observed events in the data. An upper limit on the -cross-section derived in this way is therefore the most conservative one, since it only uses the expected topology of -induced events and the number of events observed in the data. Here the combinatorial cut method was used. At confidence level a cross-section of is excluded without relying on the correct modelling of the background. The -cross-section predicted within the Ringwald-Schrempp framework is about a factor of lower.
7.2 -Model Independent Exclusion Limits
To minimise the theoretical input in the extraction of an upper limit on the -cross-section, small ranges of approximately constant and are analysed. Events in a grid with (grid size ) and with (grid size ) have been simulated using the QCDINS Monte Carlo program. In this way the effect of the assumed shape of the and distributions is minimised and the analysis is extended into regions, where the and distributions cannot be calculated. It is only assumed that the hadronic final state for instantons produced at fixed and , i.e. at fixed , is correctly modelled by the -Monte Carlo simulation.
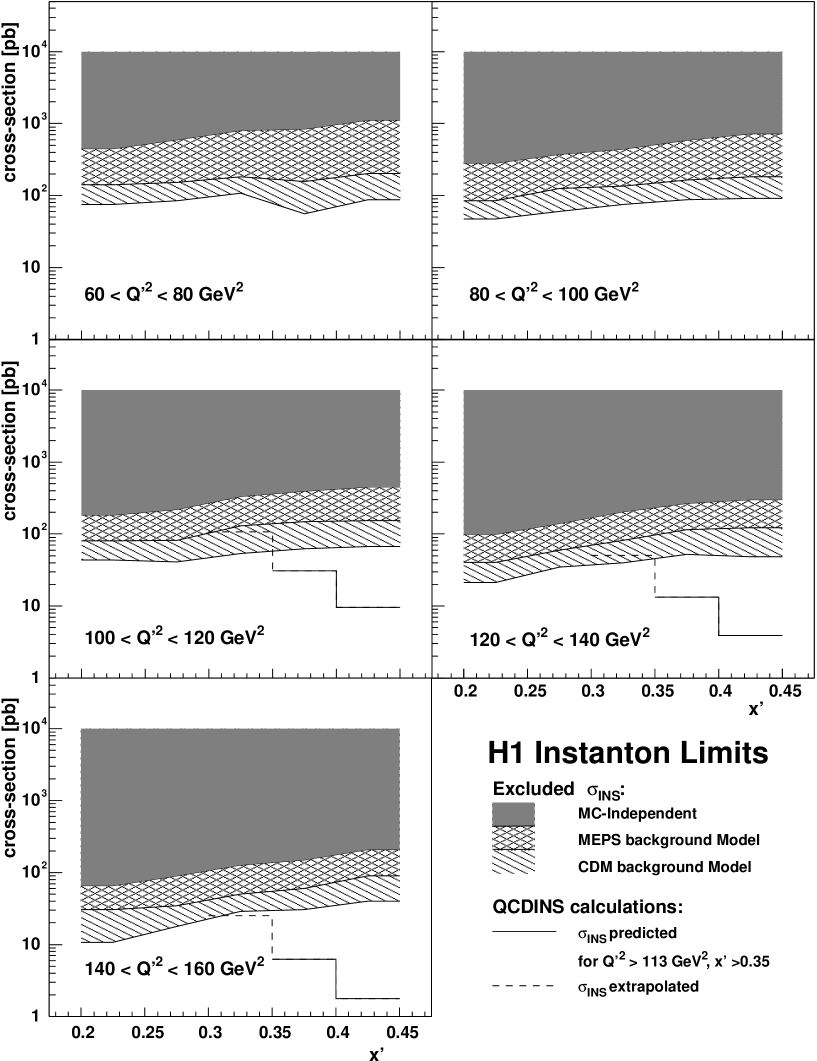
For each particular and bin, the analysis described in section 6.1 is repeated. The new best cut combinations ensuring an -efficiency and the maximal separation power are chosen. The data selected for these optimised cuts on , and are compared to the standard DIS background simulations. For each case an upper limit on the -cross-section at CL is derived. In Fig. 7 the cross-section exclusion limit obtained with the CDM and MEPS background simulations are shown for each and region. The difference of the results for the two standard DIS models reflects the uncertainty in the DIS prediction. The conservative limit independent of the background description, i.e. for the background assumed to be zero, is also shown. Depending on the and intervals -cross-sections between and are excluded.
In Fig. 7 also the -cross-section as evaluated in the Ringwald-Schrempp framework is shown in the region where -perturbation theory is expected to be valid, i.e. for large and corresponding to small instanton sizes. The upper limits are above the predicted -cross-sections in the fiducial region and . The continuation of the fast increase of the -cross-section towards lower values of and as expected from an extrapolation of -perturbation theory is also indicated.
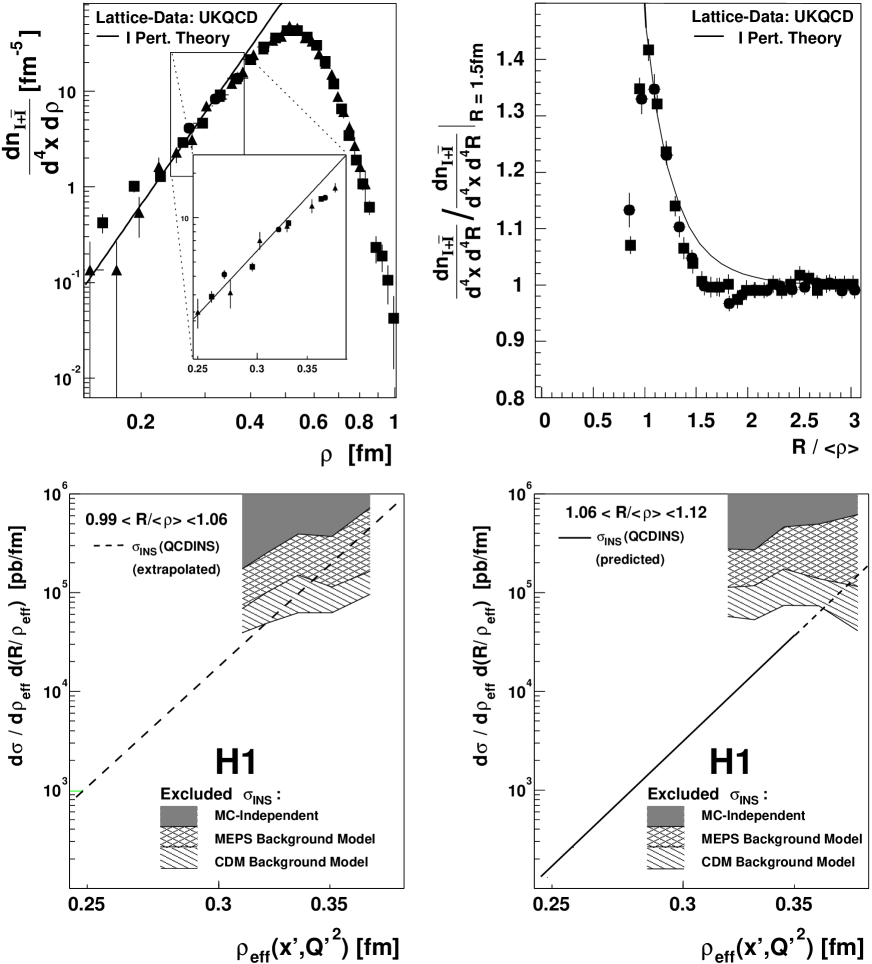
The prediction of -perturbation theory can be compared with non-perturbative lattice simulations of the QCD vacuum for zero flavours[7, 57] to obtain independent information on the and the distributions. This is illustrated999The notation is as follows: corresponds to and in eq. 2. The variable denotes the Euclidian space-time coordinates. in Fig. 8a and Fig. 8b. For low and large , where the -perturbation theory is expected to be valid, a power-like rise (see equation (6)) is found which is (including the absolute normalisation) in excellent agreement with the non-perturbative lattice simulations. For and the -perturbative calculation continues to rise while the lattice data flatten and finally drop towards and small , respectively. In this region the -perturbation theory is not reliable anymore. Figure 8c shows an expanded version of the region where -perturbation theory starts to deviate from the lattice data.
To compare this observation with the HERA cross-section limits we transform the and bins into the and bins by using the effective -size , which dominates the integration in equation (2) and can be obtained from information accessible in QCDINS. To present the cross-section limits we choose one bin which is just outside () and one bin which is just inside () the fiducial region. corresponds to and corresponds to . The obtained cross-section limits are shown in two bins of in Fig. 8d as a function of . The QCDINS predictions are shown as lines. For , i.e. within the fiducial region of -perturbation theory, the cross-section limits exclude the continuation of the power-like rise of the -cross-section with for . For the rise has to be attenuated even earlier. This disfavours a continuation of a steep rise of the -cross-section towards large values. The absence of this rise is in accord with the expectation of lattice simulation of the QCD vacuum.
8 Summary
QCD instanton-induced processes as modelled in a Monte Carlo simulation implementing the prediction of -perturbation theory have been searched for in deep-inelastic scattering at HERA in the kinematic range , , and . Three observables were used to enhance the sensitivity to instanton events with respect to the standard DIS QCD background: the charged particle multiplicity in the instanton rapidity band, the reconstructed quark virtuality and the sphericity of the hadronic final state objects in the instanton rapidity band. Applying either cuts or a multivariate discrimination technique based on these three observables, the standard DIS background is suppressed by typically a factor of , while of the -events are expected to be kept. In this region events were observed and and were predicted by two standard DIS QCD background models.
Using a multivariate discrimination technique the transition from the background dominated region to the -enriched region is investigated. The matrix element plus parton shower model describing the data in the background region clearly falls below the data in the signal region. With increasing sensitivity to -processes an increasingly large excess is seen in the data. The shape of the excess is qualitatively compatible with the expected -signal. The colour dipole model does not describe the data well in the background dominated region, but is in better agreement in the signal region. Although the data exceed the expectations where the sensitivity to the instanton process is expected to be largest, this effect is not significant given the uncertainties in the background estimation.
The standard DIS Monte Carlo models have known deficiencies and fail to describe various aspects of DIS data in the HERA regime. A better understanding of the formation of the hadronic final state in DIS in the bulk and in the extreme end of the phase space relevant for instanton searches will be needed to make further progress.
Based on solely the number of observed events in the data to remain independent of the modelling of the standard DIS background, a most conservative upper limit on the instanton cross-section of is excluded at confidence level. This limit is valid in the fiducial region of instanton perturbation theory, i.e. for and for implying small -sizes and large distances , where the -calculations are expected to be valid. The limit is about a factor of five above the cross-section predicted by instanton perturbation theory and relies on the -topology based on the calculated and distributions. To be independent of this assumption additional upper exclusion limits on the -cross-section have been derived in fixed and intervals corresponding to small regions of and . These limits are only based on the hadronic final state -topology for a given and and on the number of observed events in the data. Depending on the considered kinematic region -cross-sections between and are excluded at confidence limit. The limits cannot exclude the predicted -cross-section in the fiducial region, but exclude a steep -cross-section rise with decreasing , i.e. towards large -sizes, as would be obtained from a naive application of -perturbation theory in this region. The absence of such a steep rise is in accord with lattice simulations for zero flavours of the QCD vacuum.
In summary, this initial experimental study has shown that very large instanton contributions at small momentum transfers can be excluded at HERA. To reach sensitivity at the level of the predicted instanton-induced cross-section requires improved sophistication in the experimental methods and a thorough understanding of the hadronisation process.
Acknowledgements
We thank A. Ringwald and F. Schrempp for many helpful discussions and for their support with the QCDINS Monte Carlo simulation program. We are grateful to the HERA machine group whose outstanding efforts have made and continue to make this experiment possible. We thank the engineers and technicians for their work in constructing and now maintaining the H1 detector, our funding agencies for financial support, the DESY technical stuff for continual assistance, and the DESY directorate for the hospitality which they extend to the non-DESY members of the collaboration.
References
- [1] G. ’t Hooft, Phys. Rev. Lett. 37 (1976) 8; G. ’t Hooft, Phys. Rev. D 14 (1976) 3432; [Erratum-ibid. D 18 (1976) 2199].
- [2] A. A. Belavin, A. M. Polyakov, A. S. Shvarts and Y. S. Tyupkin, Phys. Lett. B 59 (1975) 85.
- [3] A. Ringwald and F. Schrempp, in: Quarks ’94 (Vladimir, Russia, 1994), D. Grigoriev et al., Eds., Proc. of the 8th Int. Seminar, pp. 170, hep-ph/9411217.
- [4] I. I. Balitsky and V. M. Braun, Phys. Lett. B 314 (1993) 237 [hep-ph/9305269].
- [5] S. Moch, A. Ringwald and F. Schrempp, Nucl. Phys. B 507 (1997) 134 [hep-ph/9609445].
- [6] A. Ringwald and F. Schrempp, Phys. Lett. B 438 (1998) 217 [hep-ph/9806528].
- [7] A. Ringwald and F. Schrempp, Phys. Lett. B 459 (1999) 249 [hep-lat/9903039].
- [8] M. Gibbs et al., in: Future Physics at HERA (Hamburg, Germany, 1996), G. Ingelman, A. deRoeck, and R. Klanner, Eds., vol. 1, p. 509.
- [9] T. Carli, J. Gerigk, A. Ringwald and F. Schrempp, in: Monte Carlo Generators for HERA Physics (Hamburg, Germany, 1999), A. Doyle, G. Ingelman, H. Jung and G. Grindhammer, Eds, p.329, hep-ph/9906441.
- [10] A. Ringwald and F. Schrempp, Phys. Lett. B 503 (2001) 331 [hep-ph/0012241].
- [11] A. Ringwald and F. Schrempp, Comput. Phys. Commun. 132 (2000) 267 [hep-ph/9911516].
- [12] A. Ringwald and F. Schrempp, in: New Trends in HERA Physics (Schloss Ringberg, Tegernsee, Germany, 1999), G. Grindhammer, B. Kniehl, G. Kramer and W. Ochs, Eds., pp. 203, hep-ph/9909338.
- [13] F. Schrempp, J. Phys. G 28 (2002) 915 [hep-ph/0109032].
- [14] S. Aid et al. [H1 Collaboration], Nucl. Phys. B 480 (1996) 3 [hep-ex/9607010].
- [15] S. Aid et al. [H1 Collaboration], Z. Phys. C 72 (1996) 573 [hep-ex/9608011].
- [16] T. Carli and M. Kuhlen, Nucl. Phys. B 511 (1998) 85 [hep-ex/9708008].
- [17] C. W. Bernard, Phys. Rev. D 19 (1979) 3013.
- [18] T. R. Morris, D. A. Ross and C. T. Sachrajda, Nucl. Phys. B 255 (1985) 115.
- [19] A. Ringwald, Nucl. Phys. B 330 (1990) 1; O. Espinosa, Nucl. Phys. B 343 (1990) 310.
- [20] A. Ringwald and F. Schrempp, in: Proc. DIS 2000 (Liverpool, England, 2000), J. A. Gracey and T. Greenshaw, Eds., pp. 318, hep-ph/0006215.
- [21] C. Caso et al. [Particle Data Group Collaboration], Eur. Phys. J. C 3 (1998) 1.
- [22] I. Abt et al. [H1 Collaboration], Nucl. Instrum. Meth. A 386 (1997) 310 and 348.
- [23] B. Andrieu et al. [H1 Calorimeter Group Collaboration], Nucl. Instrum. Meth. A 336 (1993) 460.
- [24] B. Andrieu et al. [H1 Calorimeter Group Collaboration], Nucl. Instrum. Meth. A 344 (1994) 492.
- [25] B. Andrieu et al. [H1 Calorimeter Group Collaboration], Nucl. Instrum. Meth. A 336 (1993) 499.
- [26] R. D. Appuhn et al. [H1 SPACAL Group Collaboration], Nucl. Instrum. Meth. A 386 (1997) 397.
- [27] J. Bürger et al., Nucl. Instrum. Meth. A 279 (1989) 217.
-
[28]
H. Jung,
Comput. Phys. Commun. 86 (1995) 147;
see updates on http://www.desy.de/jung. - [29] M. Bengtsson and T. Sjöstrand, Z. Phys. C 37 (1988) 465.
- [30] V. N. Gribov and L. N. Lipatov, Yad. Fiz. 15 (1972) 781 [Sov. J. Nucl. Phys. 15 (1972) 438]; Y. L. Dokshitzer, (In Russian), Sov. Phys. JETP 46 (1977) 641 [Zh. Eksp. Teor. Fiz. 73 (1977) 1216]; G. Altarelli and G. Parisi, Nucl. Phys. B 126 (1977) 298.
- [31] B. Andersson, G. Gustafson, G. Ingelman and T. Sjöstrand, Phys. Rept. 97 (1983) 31.
- [32] T. Sjöstrand and M. Bengtsson, Comput. Phys. Commun. 43 (1987) 367.
- [33] L. Lönnblad, Comput. Phys. Commun. 71 (1992) 15.
- [34] G. Gustafson and U. Pettersson, Nucl. Phys. B 306 (1988) 746; G. Gustafson, Phys. Lett. B 175 (1986) 453; B. Andersson, G. Gustafson, L. Lönnblad and U. Pettersson, Z. Phys. C 43 (1989) 625.
- [35] L. Lönnblad, Z. Phys. C 65 (1995) 285.
- [36] A. Kwiatkowski, H. Spiesberger and H. J. Mohring, Comput. Phys. Commun. 69 (1992) 155.
- [37] R. Engel, Z. Phys. C 66 (1995) 203.
- [38] H. L. Lai et al., Phys. Rev. D 55 (1997) 1280 [hep-ph/9606399].
- [39] C. Adloff et al. [H1 Collaboration], Eur. Phys. J. C 21 (2001) 33 [hep-ex/0012053].
- [40] N. Brook et al., in: Future Physics at HERA (Hamburg, Germany, 1996), G. Ingelman, A. deRoeck, and R. Klanner, Eds., p. 613.
- [41] N. Brook et al., in: Monte Carlo Generator for HERA Physics (Hamburg, Germany, 1999), A. Doyle, H. Jung, and G. Grindhammer, Eds., p. 10.
- [42] M. Gibbs, A. Ringwald and F. Schrempp, in: Proc. DIS 1995 (Paris, France, 1995), J.-F. Laporte and Y. Sirois, Eds., pp. 341, hep-ph/9506392.
- [43] G. Marchesini et al., Comput. Phys. Commun. 67 (1992) 465.
- [44] B. R. Webber, Nucl. Phys. B 238 (1984) 492.
- [45] C. Adloff et al. [H1 Collaboration], Eur. Phys. J. C 13 (2000) 609 [hep-ex/9908059].
- [46] L. del Pozo, University of Cambridge, RALT-002 (1993).
- [47] CDF Collab., F. Abe et al., Phys. Rev. D 45 (1992) 1458.
- [48] J. Gerigk, Dipl. Thesis University of Hamburg (unpublished) and MPI-PhE/98-20 (Nov. 1998), also at http://www-h1.desy.de/publications/theses_list.html
- [49] B. Koblitz [H1 Collaboration], J. Phys. G 28 (2002) 927 [hep-ex/0110042].
- [50] J. D. Bjorken and S. J. Brodsky, Phys. Rev. D 1 (1970) 1416.
- [51] C. Adloff et al. [H1 Collaboration], Eur. Phys. J. C 19 (2001) 289 [hep-ex/0010054].
- [52] C. Adloff et al. [H1 Collaboration], Phys. Lett. B 515 (2001) 17 [hep-ex/0106078].
- [53] R. Sedgewick, Algorithms in ++, Addison Wesley (1983) chapter 6.
- [54] T. Carli and B. Koblitz, in: Advanced Comp. Analysis Techniques in Physics Research (Batavia, USA, 2000), P. Bath and M. Kasemann, Eds., pp. 110, hep-ph/0011224.
- [55] B. Koblitz, Ph.D. thesis University of Hamburg 2002, in preparation, MPI-PhE/2002-07, also at http://www-h1.desy.de/publications/theses_list.html
- [56] T. Ahmed et al. [H1 Collaboration], Z. Phys. C 64 (1994) 545.
- [57] D. A. Smith and M.J. Teper (UKQCD Collab.), Phys. Rev. D 58 (1998) 014505; [hep-lat/9801008].