Determination of Solar Neutrino Oscillation Parameters using 1496 Days of Super-Kamiokande-I Data
Abstract
A number of different fits to solar neutrino mixing and mass square difference were performed using 1496 days of Super-Kamiokande-I’s solar neutrino data. These data select two allowed areas at large neutrino mixing when combined with either the solar 8B flux prediction of the standard solar model or the SNO interaction rate measurements. A global fit combining SK data with the solar neutrino interaction rates measured by Homestake, SNO, Gallex/GNO and SAGE prefers a single allowed area, the Large Mixing Angle solution, at the 98.9% confidence level. The mass square difference between the two mass eigenstates ranges from about to eV2, while the mixing angle is in the range of 0.25–0.65.
, , , , , , , , , , , , , , , , , , , , , , , , , ,∗, , , , , , , , , , , , , , , , , , , , , , , , , , ,†, , , , , , ,‡, , , , ,‡, , , , , , , , , , , , , , , , , , , ,§, , , , , , , , , , , , , , , , , , , , , , , , , , , , , , , , , , , , , , ,
1 Solar Neutrino Oscillations
While a number of previous solar neutrino experiments [1, 2, 3, 4] have measured a smaller neutrino interaction rate than that predicted by the Standard Solar Model (SSM) [5], in 1996 Super-Kamiokande (SK) began collecting data of unprecedented precision and quantity. In addition to a reduced interaction rate of solar 8B neutrinos (originating from decay of 8B nuclei) with electrons in the detector, SK measured with high precision the spectrum of the recoiling electrons as well as time variations of this reduced rate [6].
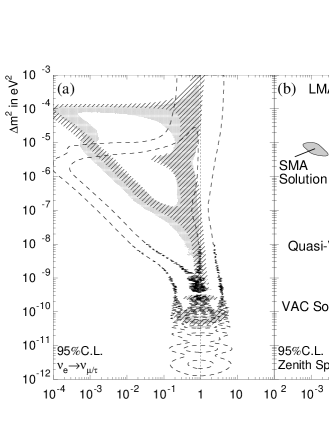
Neutrino flavor oscillations are able to explain all observed solar neutrino interaction rates, including the rate difference between SK and SNO [7]. The large neutrino flavor mixing between the second and third generation inferred from atmospheric neutrino data [8] in conjunction with the absence of an oscillation signal in the CHOOZ reactor neutrino experiment [9] (which is sensitive to oscillations in a similar region of mass square difference) requires the neutrino flavor mixing between the first and third generation to be small. Solar neutrino oscillations can therefore be approximated by a two-neutrino description with the parameters (mixing angle) and (difference in mass square). The mass eigenstate () is chosen to have the smaller (bigger) mass 111Alternatively, it is possible to call the mass eigenstate () which has the larger coupling to electrons (muons). In that case, ranges between 0 and and might be negative. The oscillation probability remains invariant under the transformation and .. Therefore, is always positive and the mixing angle ranges between 0 and . For between eV2 and eV2, matter densities in the sun and the earth can strongly affect the oscillation probability. Consequently, the symmetry of the vacuum oscillation probability around is broken. For , resonant enhancement of the oscillations (MSW effect [10]) can occur in the sun, while for , an anti-resonance can suppress the oscillations. Since matter-dominated solutions usually don’t occur for , we have not shown this “dark side” of the parameter space in previous reports. Below eV2, the oscillation probability is more affected by the oscillation phase than by matter effects. A logarithmic scale of the variable illustrates the mirror symmetry of the vacuum region (below eV2) at the maximal mixing line. Figure 1 (a) shows the experimentally allowed areas using various measurements.
In addition to the suppression of the rates, neutrino oscillations also produce other neutrino flavors. Furthermore, they can induce distortions of the neutrino spectrum and time variations of the solar neutrino fluxes. In the MSW region, the time variations arise from matter effects inside the earth (daily variations). In the vacuum regions, the time variations are the consequence of the change of the oscillation phase due to the yearly variation of the oscillation baseline – the distance between the sun and the earth.
In this paper we report on the new SK data set of 1496 days, which represents the completion of the analysis of all the data from Super-Kamiokande-I. Previous SK energy spectrum and time-variation measurements ruled out large regions of the oscillation parameter space allowed by other experiments [11]. When combined with the SSM, these measurements also restricted to be bigger than 0.2 disfavored oscillation to a sterile neutrino. Our final data set confirms our previous measurements and further constrains the range of possible oscillation parameters.
Even stronger constraints can be obtained by combining SK results with the rate measurements of other experiments. In particular, the combination of SNO’s measurement of the solar 8B interaction rate [12] with the SK rate yields additional information [7, 13] about 8B flavor conversion, since SK also has sensitivity to other active neutrino flavors. If the survival probability is moderately small for 8B neutrinos (less than about 50%) then SK can observe a significant excess due to the presence of other active species in its precise measurement of the elastic scattering rate. A similar signature can be observed in the combination of SK and the Homestake rate. In this case, however, the lower energy threshold of Homestake and its resulting sensitivity to other than 8B neutrinos lead to an ambiguity between spectral distortion and appearance signatures and therefore to a larger uncertainty in the observed excess.
2 Parameter Estimation for Two-Neutrino Oscillations
Without SK data, the strongest constraint of the parameters is a fit to the charged-current neutrino rates from Gallex/GNO, SAGE (combined into a single “Gallium” rate), Homestake (“Chlorine”) and SNO experiments [∥]. The light gray areas of Figure 1 (b) use only these three rates and their SSM-based predictions. The regions can be understood as the “overlap” of the three allowed regions of Figure 1 (a). Above eV2 near (maximal mixing) all three regions meet and form the large mixing angle (LMA) solution. The small mixing angle solution (SMA) is the “crossing point” of the Gallium region and the Chlorine region and lies between eV2 and eV2 at . The LOW solution is the large part of the extensive region(s) between eV2 and eV2, while the lower part of this region is called the quasi-vacuum (quasi-VAC) solution. Finally, the vacuum solutions (VAC) are found below eV2. All regions have similar (though the LOW fits are slightly worse with ).
| Bin | Range [MeV] | Ratestatsyst [SSM] | 8B Spectrum | E-Scale | E-Resol. |
|---|---|---|---|---|---|
| 1 | 5.0-5.5 | 0.4670.040 | |||
| 2 | 5.5-6.5 | 0.4580.014 | |||
| 3 | 6.5-8.0 | 0.4730.008 | |||
| 4 | 8.0-9.5 | 0.4600.009 | |||
| 5 | 9.5-11.5 | 0.4630.010 | |||
| 6 | 11.5-13.5 | 0.4620.017 | |||
| 7 | 13.5-16.0 | 0.5670.039 | |||
| 8 | 16.0-20.0 | 0.5550.146 | |||
| Comb. 5.0-20.0 | 0.465 | ||||
| Day | Mantle | Core | |||||
|---|---|---|---|---|---|---|---|
| Bin | -0.974–0 | 0.00–0.16 | 0.16–0.33 | 0.33–0.50 | 0.50–0.67 | 0.67–0.84 | 0.84–0.974 |
| 2 | 45320 | 44253 | 37949 | 47245 | 52245 | 50349 | 42652 |
| 3 | 47412 | 53034 | 50630 | 43826 | 47826 | 45128 | 43931 |
| 4 | 44813 | 46336 | 47033 | 46229 | 50929 | 46132 | 45135 |
| 5 | 45315 | 44940 | 50238 | 45132 | 47332 | 47735 | 48340 |
| 6 | 47725 | 50967 | 35155 | 39149 | 49853 | 43456 | 52164 |
| 7 | 51154 | 570150 | 831167 | 694131 | 665127 | 441118 | 469131 |
| 1-8 | 459.96.7 | 483 18 | 47617 | 45115 | 496 15 | 46716 | 45617 |
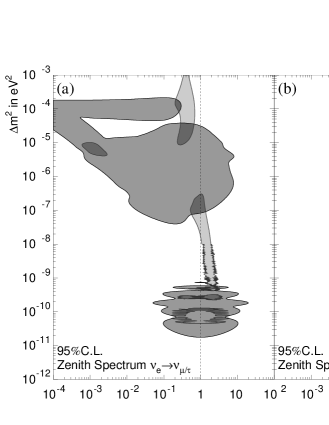
SK data breaks the degeneracy in of these regions by analyzing the shape of the “zenith angle spectrum” [11] which combines spectrum and daily variation analyses. Here we utilize the zenith angle spectrum from the entire SK-I data set collected between May 31st, 1996 and July 15th, 2001 (1496 live days). The numerical results are listed in Tables 2 and 2. There is no indication of spectral distortion, the to an undistorted spectrum is 4.6 for 7 degrees of freedom (71% C.L.). No significant daily variation is found, the day/night rate asymmetry is 0.020(stat)(syst). The gray excluded regions of Figure 2 (a) are the result of the zenith angle spectrum fit. The SMA and VAC regions are excluded since they require a distorted 8B neutrino spectrum. The lower part of the LMA and the upper part of the LOW solution predict daily variations and are therefore disfavored. The excluded areas are independent of the SSM neutrino fluxes. While the SK zenith angle spectrum shape is best described by quasi-VAC solutions, LMA fits have similar .
Since there is no indication of a distortion of the SK zenith spectrum, an analysis of the zenith spectrum shape alone can only yield excluded regions. However, if the 8B flux is known, the SK rate can be predicted. Then, the zenith spectrum shape can be combined with the SK rate into a single measurement. Figure 2(b) shows the allowed regions using SK rate and zenith angle spectrum in combination with the 8B flux prediction and uncertainty of the SSM. Unlike other experiments, whose allowed areas are shown in Figure 1 (a), SK allows only large mixing at 95% C.L, and there are two allowed regions: the LMA and quasi-VAC solution.
3 Combination of Super-Kamiokande Data with Other Experiments
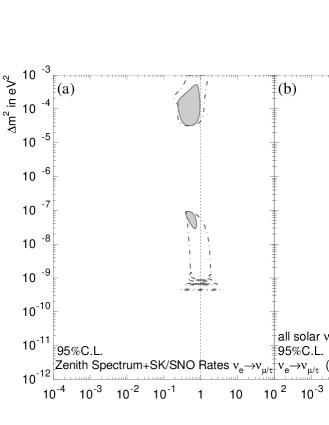
A comparison between the SK rate and SNO’s charged-current rate [12] yields another 8B flux constraint which is independent of the SSM, so a combination of the SK rate and zenith angle spectrum with the SNO charged-current rate need not rely on any neutrino flux prediction [13]. The SK rate of SSM (see Table 2) exceeds the SNO charged-current rate [12] of SSM, by about . If this is interpreted as an appearance signal of other active neutrino flavors, these flavors contribute about 25% to the SK rate and 70% to the 8B flux (the elastic scattering cross section for the other flavors is six to seven times smaller than for ). As a consequence of this appearance signal, the two allowed regions (dashed-dotted lines) of Figure 3 (a) result from a combined fit: a LMA and a quasi-VAC solution. If the SNO neutral-current rate is used as well, the quasi-VAC solutions are disfavored as seen in Figure 3 (a) (gray shaded areas).
To constrain the quasi-VAC region below the LOW solution, it is necessary to add the Gallium [3, 4] ( SNU or SSM) and Chlorine rates [1] ( SNU or SSM) to the fit. Such a global fit is still not influenced by the 8B and hep neutrino (arising from 3HepHe+e++) flux predictions of the SSM, which suffer from the largest uncertainties. However, it relies on the other SSM neutrino fluxes, in particular the 7Be flux (10% uncertainty) and the neutrino fluxes of the CNO cycle ( uncertainty). Those fluxes contribute [5] about 15% (7Be) and 6% (CNO) to the Chlorine rate and 27% (7Be) and 7% (CNO) to the Gallium rate in the SSM. The allowed areas of this global fit shown in Figure 3 (b) looks quite different when compared with the fit without SK data displayed in Figure 1 (b): only the upper part of the LMA survives.
Table 3 compares the four smallest local minima of the describing the global fit. The best fit is located in the upper LMA area. The 8B flux resulting from this fit is somewhat higher than expected by the SSM (cms) but well within the uncertainty. The hep flux is considerably higher than expected by the SSM (cms); however, the uncertainty of this prediction is thought to be very large. The fit agrees with the SK zenith angle spectrum moderately well and easily accommodates the Gallium, SK and SNO rates, though the predicted Chlorine rate is about too high. This worsens the otherwise very good best fit .
The quasi-VAC solution describes the SK zenith angle spectrum slightly better than the LMA does, however, the rates do not fit well. The resulting best fit 8B flux falls short of the SSM prediction. The surviving (at 99% C.L.) LOW solution fits the rates about as poorly as the quasi-VAC solution. The SK zenith angle spectrum fits LOW worse than it does either LMA or quasi-VAC. The lack of zenith angle variation in the SK data reduces the (usually around eV2) and worsens the LOW best fit which is already under pressure from the rates.
At around the level a small mixing angle solution appears. The mixing angle is about a factor of four smaller than the usual SMA. For any given 8B flux, such a small mixing angle region can be defined by the crossing of the Gallium and the Chlorine allowed areas; those two rates therefore automatically fit very well. In case of the classic SMA, the SK spectral data lack the predicted distortion. As a consequence, the region gets shifted towards smaller mixing, and even then the SK zenith angle spectrum considerably (about 3.5 ) disfavors this fit. Due to the reduced mixing angle, the predicted SNO charged-current rate is more than above the measurement. Consequently, small mixing is excluded at the level.
| Solution | Large Mixing | Quasi-Vacuum | Low | Small Mixing |
|---|---|---|---|---|
| Angle (LMA) | (Quasi-VAC) | (LOW) | Angle (SMA) | |
| 6.9 | 6.68 | 7.2 | 6.6 | |
| 0.38 | 1.5 | 0.66 | 0.0012 | |
| (46 dof; [%]) | 43.5 (57.7) | 53.5 (20.9) | 52.5 (23.7) | 58.9 (9.6) |
| (2 dof;[%]) | 0.0 (100.0) | 10.0 (0.7) | 9.0 (1.1) | 15.4 (0.05) |
| ([]) | 3.0 ( ) | 1.0 ( ) | 5.6 ( ) | 15.1 ( ) |
| Ga Rate [SNU] | 71.7 () | 64.4 () | 64.9 () | 78.3 () |
| Cl Rate [SNU] | 2.99 () | 3.09 () | 3.03 () | 2.43 () |
| SK Rate [%SSM] | 46.1 () | 45.0 () | 45.5 () | 45.7 () |
| SNO CC [%SSM] | 34.0 () | 38.9 () | 37.7 () | 40.0 () |
| SNO NC [%SSM] | 106 () | 76 () | 87 () | 89 () |
| [cm2s)] | 5.33 () | 3.83 () | 4.41 () | 4.48 () |
| [cm2s)] | 36 | 9 | 23 | 12 |
| 8B Spectrum Shape | ||||
| SK E-scale/resol. | / | / | / | / |
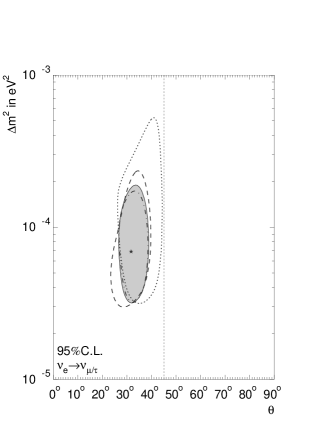
Figure 4 shows a close up view of the LMA region. The combined fits described above treat the 8B flux as a free parameter, which is only constrained by the solar neutrino experiments. If the SSM prediction of this flux is used (dashed-dotted line), the quasi-VAC, LOW and small mixing solutions are further disfavored: the quasi-VAC solution is then excluded at 99.4% C.L., LOW at 99.1% C.L. and small mixing at 99.96% C.L. If the SNO measurements are removed from the fit (dashed lines), LMA is still favored. Quasi-VAC solutions appear then at 95% C.L, LOW solutions at 97% C.L. and small mixing solutions at 93% C.L. If the radio-chemical measurements (Gallium and Chlorine) are ignored (dotted lines, or see Figure 3 a), LOW solutions appear at 92% C.L., quasi-VAC at 84% C.L. and small mixing solutions at 99.99% C.L.
4 Conclusion
The combined fit to the charged-current interaction rates measured by several experiments result in many allowed regions of neutrino mixing and mass square difference: LMA, SMA, LOW, quasi-VAC and VAC solutions. The absence of spectral distortion and daily variations of the SK solar neutrino interaction rate strongly constrains these regions rejecting SMA, LOW and VAC solutions at 95% C.L., while leaving only the higher mass square difference LMA and the quasi-VAC region. When combined with the SK interaction rate and either the SSM prediction of the 8B flux or the SNO rates, large neutrino mixing is selected. When Gallium, Chlorine and SNO data are combined with SK data, only the higher mass square difference LMA solutions remain at 98.9% C.L. Thus the combined results of all solar neutrino experiments can be used to determine a unique region of oscillation parameters that explains the famous solar neutrino problem.
Acknowledgments
We gratefully acknowledge the cooperation of the Kamioka Mining and Smelting Company. The Super-Kamiokande detector has been built and operated from funding by the Japanese Ministry of Education, Culture, Sports, Science and Technology, the U.S. Department of Energy, and the U.S. National Science Foundation.
References
- [*] Present address: Harvard University, Cambridge, MA 02138, USA
- [†] Present address: Enrico Fermi Institute, University of Chicago, Chicago, IL 60637, USA
- [‡] Present address: The Institute of Physical and Chemical Reasearch (RIKEN), Wako, Saitama 351-0198, Japan
- [§] Present address: Department of Physics, University of Utah, Salt Lake City, UT 84112, USA
- [1] B.T. Cleveland et al., Astrophys. J. 496, 505 (1998).
- [2] Y. Fukuda et al., Phys. Rev. Lett. 77, 1683 (1996).
-
[3]
E. Bellotti, Nucl. Phys. B(Proc. Suppl.) 91, 44 (2001);
W. Hampel et al., Phys. Lett. B 388, 364 (1996);
P. Anselmann et al., Phys. Lett. B 342, 440 (1995). -
[4]
V. Gavrin, Nucl. Phys. B(Proc. Suppl.) 91, 36 (2001);
J.N. Abdurashitov et al., Phys. Lett. B 328, 234 (1994). - [5] J.N. Bahcall, M.H. Pinsonneault, S. Basu, Astrophys. J. 555, 990 (2001).
- [6] S. Fukuda et al., Phys. Rev. Lett. 86, 5651 (2001).
- [7] Q.R. Ahmad et al. Phys. Rev. Lett. 87, 71301 (2001).
- [8] Y. Fukuda et al., Phys. Rev. Lett. 81, 1562 (1998).
- [9] M. Apollonio, Phys. Lett. B 466, 415 (1999).
- [10] S.P. Mikheyev and A.Y. Smirnov, Sov. Jour. Nucl. Phys. 42, 913 (1985); L. Wolfenstein, Phys. Rev. D 17, 2369 (1978).
- [11] S. Fukuda et al., Phys. Rev. Lett. 86, 5656 (2001).
- [12] Q.R. Ahmad et al. nucl-ex/0204008 (2002).
- [13] M. Smy in Neutrino Oscillations in Venice, ed. M. Baldo Ceolin, (Venezia, 2001) 35.
- [¶] A detailed discussion of this uncertainty will be published elsewhere.
- [∥] As we prepared this paper, SNO announced new results on its charged- and neutral-current rates, which assumes an undistorted 8B spectrum. In particular, the neutral-current rate can be strongly influenced by such spectral distortions. At present, the SNO measurement of this spectrum cannot be used to extract neutral-current and charged-current rates for distorted spectra, since the systematic uncertainties have not yet been given as a function of energy. As a consequence, we do not use the neutral-current rate in oscillation fits excluding SK data. In combined fits including the SK recoil electron spectrum, the distortions are small in the regions which are allowed by SK data.