FLAVOR CHANGING KAON DECAYS FROM HYPERCP:
MEASUREMENTS OF THE BRANCHING RATIOS
The Fermilab HyperCP collaboration is making precision studies of charged hyperon and kaon decays, as well as searches for rare and forbidden hyperon and kaon decays. We report here on measurements of the branching ratios of the flavor-changing neutral-current decays: , and compare our results to theoretical predictions. This is the first observation of the decay.
1 Introduction
The radiative, flavor-changing neutral-current decays of the type l+l- were originally of considerable interest because, as tree-level forbidden decays in the standard model, they were important systems in which to search for new physics. The interest in these decays has not waned, despite the lack of any indication of new physics, but the focus has shifted to using them as a test-bed for techniques in calculating quantum-chromodynamic (QCD) corrections to weak decays. Expected to proceed via one-loop level electroweak box and penguin diagrams, long-distance effects are thought to play a dominant role in these decays. Hence chiral perturbation theory (ChPT) has been employed to calculate both the rates and the form factors of these decays. An early ChPT calculation which parameterized the rates and form factors in terms of a single parameter, , has recently been supplemented by a higher-order, , ChPT calculation which parameterizes them in terms of two variables: and . This last calculation makes a model-independent prediction that the ratio should be greater than 0.23, a result of rather broad validity since it assumes only that the electron and muon channels are described by the same electromagnetic form factor and that this form factor does not have singular behavior. A previous calculation, using a different technique predicts a similar result.
Although first seen in 1975, with the observation of some forty () events, only in the last several years have precision measurements been made of the branching ratio and form factor in two experiments at the Brookhaven National Laboratory (BNL): BNL-777, and BNL-865. The most recent of these measurements comes from BNL-865. Using a sample of 10 300 events they have firmly established the vector nature of the decay, measured the slope of the form factor to 9%, and the branching ratio to 5%. The () branching ratio measurement has been more difficult to make. First observed in 1997 by BNL-787, they found a branching ratio about less than that expected, given the prediction of mentioned above and the BNL-E865 measurement of the branching ratio. The branching ratio has recently been measured by BNL-865 with a sample of some 400 events. This latter result agrees with the theoretical predictions and disagrees with the BNL-787 result by . Hence it is vital that this discrepancy be resolved and to determine if indeed the theorists predictions of are borne out.
2 The HyperCP Apparatus
The HyperCP experiment was designed and built primarily to investigate CP violation in hyperon decays. A plan view of the HyperCP spectrometer is shown in Fig. 1. A charged-secondary beam was produced by steering an 800-GeV/ proton beam onto a mm2-Cu target. A curved collimator with a 4.88 sr solid angle acceptance and embedded in a 6-m long dipole magnet deflected charged particles, with an average momentum of about 170 GeV/, up at a mean angle of 19.5 mrad. Following a vacuum decay region was a conventional magnetic spectrometer employing high-rate, narrow-pitch wire chambers. Two hodoscopes on either side of the channeled beam eminating from the collimator exit, called the Left-side and Right-side hodosopes, were the basis of most of the physics triggers. A hadronic calorimeter was used for triggering on the proton from decays, and was not used in the analysis reported here. At the rear of the spectrometer was a muon system consisting of two identical detectors positioned on either side of the channeled beam. The detectors had three proportional-tube stations, each behind 0.81 m of iron absorber, providing and measurements. At the rear of the muon detectors were two hodoscopes, with vertical and horizontal counters, used to trigger on events.
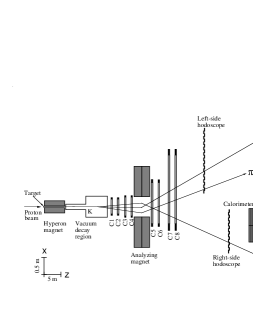
The polarities of both the Hyperon and Spectrometer magnets were periodically flipped to change the sign of the secondary beam; roughly two-thirds of the running time was spent on the positive polarity. A typical primary beam intensity of protons per second gave a secondary beam rate of 13 MHz at the exit of the collimator. Data were taken in two runs, one in 1997, another in 1999, with a total of 231 billion events recorded on magnetic tape, of which 555 million were fully-reconstructed () events. The analysis reported here is from the smaller 1997 data set containing 58 billion events.
3 Analysis
Rather than measuring absolute branching ratios, which would have required the somewhat difficult task of counting the number of kaons entering the apparatus, we measured the branching ratios relative to the well-measured (and far larger) branching ratios. We call the normalization modes and the signal modes. Since the topologies of both the signal and normalization modes were quite similar, measuring the branching ratios by this means minimized systematic errors.
The triggers used for both signal and normalization modes were both quite simple. For the normalization modes the triggers required a coincidence of signals in both the Left-side and Right-side hodoscopes. The triggers for the signal modes required this same coincidence along with a coincidence of charged particles in the Left-side and Right-side muon hodoscopes.
The branching ratios for were determined using the following formula:
| (1) |
where: are the numbers of observed events, are the geometric acceptances of the triggers, are the event-selection efficiencies, and are the trigger efficiencies; for signal () and normalization () modes. The number 200 is the prescale factor for the normalization trigger and is the muon identification efficiency. The values of the parameters used in Eq. 1 are given in Table 1 below. Note the generally large values of the efficiencies and acceptances. The following discussion explains how these values were obtained.
Item
Polarity
Polarity
94.4%
94.2%
47.5%
47.7%
80.3%
78.3%
77.9%
76.0%


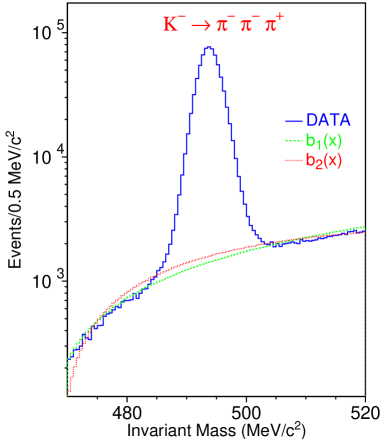
Data for both signal and normalization modes were selected in a similar manner. A three-track topology — two on the left side of the spectrometer and one on the right — was required in both cases, with the signal tracks having the additional requirement of a muon track in both the Left- and Right-side muon detectors. A muon track was defined as a track stub in a muon detector which included at least two of three hits in both and views in the muon proportional tubes with corresponding in-time hits in the muon hodoscopes. Two of the three pion tracks for the normalization modes were required to point to the fiducial areas of the muon detectors. A good fit to a common vertex was required of the three tracks. This was done by first fitting the tracks to a common vertex and requiring that the average transverse separation of the three tracks at that point be less than 2 mm and the d.o.f of the vertex-constrained fit be less than 2.5. This cut out most of the background from hyperon decays and uncorrelated tracks. Other rather loose cuts were applied to the parent: on its momentum, target point-back, and decay vertex. The invariant mass of the signal and normalization modes after these cuts is shown in Fig. 2. The number of signal events, as determined by maximum-likelihood fits in the region 470 MeV/ 520 MeV/, is given in Table 1. The invariant mass of normalization data sample is shown in Fig. 4.
From the combined positive and negative data samples we measured the relative trigger efficiency, , and the dimuon selection efficiency: , given in Table 1.
From Monte Carlo we determined the acceptances and the event selection efficiencies for signal and normalization modes. The Particle Data Group (PDG) parameters describing the decays were used. The decay parameters are not as well known. In the Monte Carlo simulation we assumed a vector interaction, as has been demonstrated in decays by the BNL-865 experiment, and is consistent, although not nearly as well established, with their measurement. For the slope of the form factor which describes the dilepton invariant mass spectrum, , for the decays we averaged the values from the BNL-777 and BNL-865 and measurements to obtain : the form factor being given by , where and are a slope parameter and a constant, respectively, and is the mass of the charged kaon. It is important to note, as can be seen in Fig. 4, that our acceptance in the dimuon invariant mass was quite uniform and hence we were not sensitive to even large deviations from the average value of the slope parameter . The geometric acceptances are given in Table 1. The event selection efficiencies, also measured using Monte Carlo, are quite high, and are also given in Table 1.

A word on errors. Our measurements were dominated by the statistical uncertainties in determining the number of events: giving a 10% error for the combined branching ratio measurement. Sources of systematic error were carefully studied, including: targetting variations, magnetic field variations, the difference between data and Monte Carlo, uncertainties in the parameters describing the and decays, and uncertainties in the trigger and muon identification efficiencies. The total systematic errors were found to be less than half the statistical errors. They were dominated by two sources roughly equal in magnitude: the error in the background under the signal peak (3.6%) and the error in the determination of the relative trigger efficiencies (3.1%).
4 Results
What do we find for the branching ratios? Using Eq. 1 we get: and = (, where the first and second errors are statistical and systematic, respectively. The two results are in agreement with each other, indicating no evidence of CP violation:
No surprise here: theoretical expectations for the CP asymmetry are orders of magnitude smaller. Assuming CP symmetry is good, we can combine the two measurements to give:
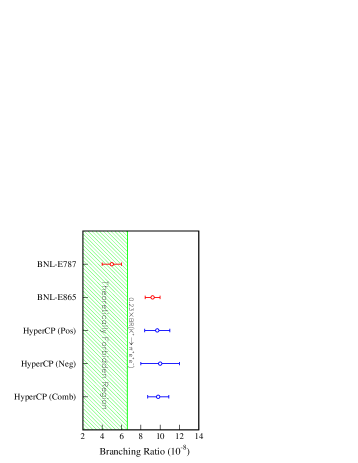
This result is consistent with the BNL-865 measurement, but higher than the BNL-787 result (see Fig. 6). It also, when combined with the PDG value for , is consistent with the theoretical predications of .
The HyperCP collaboration is analyzing the larger 1999 data set, which should give about a factor of four increase in statistics, and which has quite different systematics: a different muon detector, Monte Carlo, and tracking program. Figure 6 shows the mass peak from a preliminary analysis of the combined and 1999 data sets. By the end of the decade, new experiments such as CKM at Fermilab, should produce data sets for both the and modes that are on the order of 100,000 events, which will allow precision tests of ChPT predictions to be made.
We finally note that these results have been recently published in Physical Review Letters.

Preliminary!
Acknowledgments
We thank the organizers for an interesting and stimulating conference. We are indebted to the staffs of Fermilab and the participating institutions for their vital contributions. This work was supported by the U.S. Department of Energy and the National Science Council of Taiwan, R.O.C. K.B. Luk was partially supported by the Miller Institute.
References
References
- [1] G. Ecker, A. Pich and E. de Rafael, Nucl. Phys. B 291, 692 (1987).
- [2] G. D’Ambrosio, G. Ecker, G. Isidori and J. Portolés, JHEP 8, 4 (1998).
- [3] L. Bergström and P. Singer, Phys. Rev. D 43, 1568 (1991).
- [4] P. Bloch et al., Phys. Lett. B 56, 201 (1975).
- [5] C. Alliegro et al., Phys. Rev. Lett. 68, 278 (1992).
- [6] R. Appel et al., Phys. Rev. Lett. 83, 4482 (1999).
- [7] S. Adler et al., Phys. Rev. Lett. 79, 4756 (1997).
- [8] H. Ma et al., Phys. Rev. Lett. 84, 2580 (2000).
- [9] Particle Data Group, D.E. Groom et al., Eur. Phys. J. C 15, 1 (2000).
- [10] G. Ecker, A. Pich and E. de Rafael, Nucl. Phys. B 303, 665 (1988).
- [11] H.K. Park et al., Phys. Rev. Lett. 88, 111801 (2002).