SLAC-PUB-9219
BABAR-PROC-02/23
hep-ex/0205056
May, 2002
Rare Decays at BABAR
Dieter Best
University of California, Irvine
Department of Physics and Astronomy
Irvine, CA 92697-4575
(on behalf of the B AB AR Collaboration)
Abstract
We report recent results in the search for the rare meson decays and . These results are based on 56.4 fb-1 collected by the BaBar Collaboration at the SLAC PEP-II Factory. We set new 90% confidence level upper limits , , and .
Invited talk presented at the XXXVIIth Rencontres de Moriond on QCD and Hadronic Interactions,
3/16/2002—3/23/2002, Les Arcs, France
Stanford Linear Accelerator Center, Stanford University, Stanford, CA 94309
Work supported in part by Department of Energy contract DE-AC03-76SF00515.
1 The BaBar Detector
The results presented in this paper are based on an integrated luminosity of 56.4 fb-1 collected on the resonance with the BaBar detector [1] at the PEP-II asymmetric collider of the Stanford Linear Accelerator Center.
Charged particles are detected and their momenta measured by a combination of a 5 double–sided layer silicon vertex tracker and a 40–layer drift chamber, photons are detected by a CsI electromagnetic calorimeter. These detectors operate inside a 1.5 T solenoidal field.
Charged particle identification is achieved by the average energy loss in the tracking devices and by a unique, internally reflecting ring imaging Cherenkov detector.
2 Decay Reconstruction
The meson candidates are kinematically identified using two independent variables. is peaked at zero for signal since the mesons are produced via and therefore the energy of the meson in the rest frame is the beam energy . is a measure of the meson mass where we have substituted by the beam energy which is known with better precision than . is the momentum of the meson candidate in the rest frame calculated from the measured momenta of the decay products.
Rare decay modes suffer from large backgrounds due to random combinations of tracks produced in the light quark–antiquark continuum. The distinguishing feature of such backgrounds is their characteristic event shape resulting from the two–jet production mechanism. A quantity that characterizes the event shape is the angle between the thrust axis of the candidate and the thrust axis of the rest of the event where the thrust axis is defined as the axis that maximizes the sum of the magnitudes of the longitudinal momenta. This angle is small for continuum events, where the candidate daughters tend to lie in the jets, and uniformly distributed for true events.
We further suppress background using a Fisher discriminant constructed as an optimized linear combination of the scalar sum of the center–of–mass momenta of all charged tracks and photons (excluding the candidate decay products) flowing into 9 concentric cones centered on the thrust axis of the candidate. The more spherical the event, the lower the value of the Fisher discriminant.
All analyses have been performed as blind analyses, i.e., the region in and where the signal is expected is concealed until all the selection criteria are determined either from Monte Carlo events, data sidebands in the – plane (region outside the signal region) or data control samples.
Yields are extracted using extended maximum likelihood fits to the , , and Fisher discriminant (for ) or resonance mass distribution (for ) for signal and background.
In the following charge conjugate modes are implied throughout.
3 A Search for
The measurement of the branching fraction for is mainly aiming at the determination of the quark–mixing matrix element . The measurement of is also the main motivation for performing mixing measurements. Both are sensitive to new physics contributions in their loop and box diagrams.
Assuming that the short–distance contribution of the magnetic moment operator is dominating these transitions, one derives
| (1) |
where takes into account the decay form factors and the different phase space factors [3]. With a precise measurement of the ratio of branching fractions provides therefore a strong constraint on .
With the assumption of isospin invariance one also expects , if we assume in addition SU(3) symmetry we obtain . The measurement of the branching fractions alone provides therefore a model independent way of testing to what extent the short distance contributions are dominating these decays.
The relations above have been used to convert the experimental upper bound on the ratio of the exclusive radiative decays [4] (90% confidence level), into a bound on , 0.64 – 0.76, depending on the estimate of the SU(3)–breaking parameters in the short distance contribution [5]. While this bound is at present not competitive with the corresponding bound from the unitarity of the quark–mixing matrix [2] and from the fits of the quark–mixing matrix elements [6], which yield , one anticipates that the increased sensitivity in the radiative decay modes at the high luminosity factories will allow to test these relationships quantitatively.
Currently no measurements exist for the branching fraction of the decay , however, 90% confidence level upper limits have been obtained by the CLEO [7] and Belle collaborations [8]. CLEO obtains an upper limit of 1710-6 for the neutral and 1310-6 for the charged mode based on 9.7106 events. Belle obtains an upper limit of 10.610-6 for the neutral and 9.910-6 for the charged mode based on 11106 events.
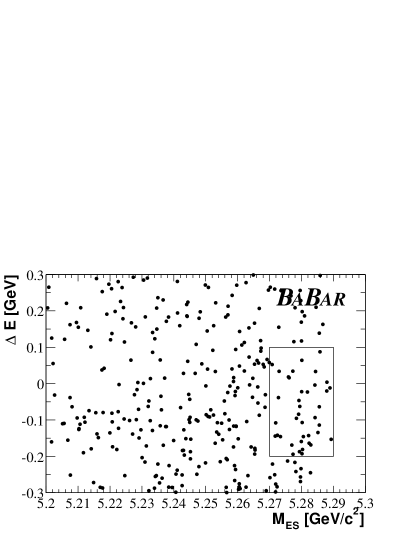
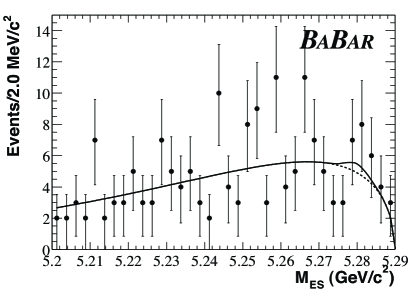
Figure 1 shows our results for after unblinding. On the left is shown the vs distribution for . The box outlines the signal region which was blinded during the analysis. On the right is shown the distribution for . The result of the likelihood fit is overlaid as a solid line, the dashed line represents the background contribution. The extended maximum likelihood fit yields 3.1 4.2 events for and 4.6 5.8 events for . We observe no signal and place the following 90% confidence level upper limits on the branching fractions:
This represents an improvement of an order of magnitude over previous measurements and reaches the range of theoretical predictions. The systematic uncertainty on the branching fraction is about 15% for both modes, where the largest contribution comes from the assumption of the number of mesons in the background.
4 A Search for
The branching fraction for the decay is interesting in the context of the determination of the angle in the unitarity triangle. In the absence of penguin contributions, the asymmetry in measures . An isospin analysis can be used to eliminate the penguin pollution in this case [9]. However, this analysis requires both the measurement of and , and therefore, although theoretically clean, this analysis is undermined by the small branching fraction of the decay . Theoretical predictions [10] are as high as 4.610-6, some references [11] give limits in the range 10-7 – 10-6.
However, measuring a CP averaged decay rate for is still interesting for . The phase angle obtained through the analysis of decays gives only an effective parameter which is dependent on , strong phases and the ratio of penguin to tree amplitudes. One can bound via[12]
where .
Recent results from CLEO [13] and Belle [14] have hinted at the possibility of a branching fraction of the order of 210-6. CLEO measures a limit of 5.710-6 based on 9.67106 events, Belle 5.610-6 based on 31.7106 events.
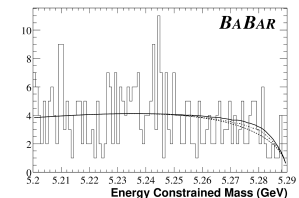
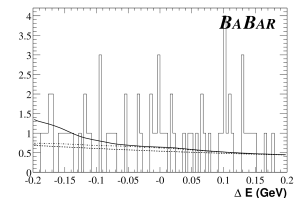
Figure 2 shows projections on (left) and (right) after unblinding with the likelihood function superimposed. The solid line is the overall probability density distribution function (PDF), the dashed line represents the continuum PDF while the dashed–dotted line represents the continuum and PDFs combined. There is no evidence for observation of a signal for yet. We place a 90% confidence level upper limit on the branching fraction of
This upper limit is better than that of previous searches. The largest two systematic uncertainties arise from the parameterization of the continuum background and the Fisher discriminant distribution, the third largest from the assumption for the background contribution.
References
- [1] BaBar collaboration, B. Aubert et al., Nucl. Instr. and Methods A 479, 1 (2002).
- [2] D. E. Groom et al., The European Physical Journal C 15, 1 (2000).
- [3] A. Ali, V.M. Braun, and H. Simma, Z. Phys. C 63 (1994) 437.
- [4] R. Patterson, in Proc. of the XXVII Int. Conf. on High Energy Physics, Glasgow, Scotland, 1994, eds. P.J. Bussey and I.G. Knowles (IOP Publ. Ltd., Bristol, 1995).
- [5] S. Narison, Phys. Lett. B 327, 354 (1994); J. M. Soares, Phys. Rev. D 49, 283 (1994).
- [6] A. Ali and D. London, Z. Phys. C 65, 431 (1995).
- [7] CLEO Collaboration, T. E. Coan et al., Phys. Rev. Lett. 84 5283 (2000).
- [8] Belle Collaboration, Y. Ushiroda et al., in Proc. of the 4th Int. Conf. on B Physics and CP Violation, 12–23 February 2001, Ise–Shima, Japan.
- [9] M. Gronau, D. London, Phys. Rev. Lett. 65, 3381 (1990).
- [10] Y. F. Zhou et al., hep-hp/0006225.
- [11] A. Ali et al., Phys. Rev. D 58, 094009 (1998); Charles, Phys. Rev. D 59, 054007 (1999).
- [12] Y. Grossman and H. Quinn, Phys. Rev. D 58, 017504 (1998).
- [13] CLEO Colaboration, D. M. Asner et al., Phys. Rev. D 65, 031103 (2002).
- [14] Belle Collaboration, talk at the Workshop on the CKM Unitarity Triangle, CERN 13th Feb 2002.