HEAVY FLAVOURS AT LEP
This paper describes recent developments in Heavy Flavour physics at LEP, focusing on a new result from the ALEPH Collaboration on the search for flavour oscillations of the meson. The impact of this analysis on the world combination and the resulting limit on the oscillation frequency are discussed.
1 Introduction
Six years after the end of the LEP1 data taking, the LEP collaborations continue producing impressive results in Heavy Flavours physics. Now very near to its completion, the LEP Heavy Flavours research programme achieved a very good precision in measuring some of the experimental quantities that enter in the determination of the CKM matrix elements, like the b hadron lifetimes, inclusive and exclusive b semileptonic branching ratios, or the oscillation frequency, reaching in some cases accuracies at the percent level and significantly better than the theoretical uncertainties involved in the CKM elements extraction . Rather than reviewing these results, the goal of this paper is to focus on a very recent result from the ALEPH collaboration on the search for oscillations, which represents the most relevant development in Heavy Flavour physics from LEP during the last few months.
The flavour mixing is expected to happen exactly as in the case of and mesons, as a consequence of the flavour non-conservation in charged weak-current interactions. However, a measurement of the oscillation frequency is still lacking, because it is too high to be resolved with the present experimental resolutions and statistics.
The interest in this measurement lies in the possibility to constrain much more tightly the value of ; in fact, using the oscillation frequency alone, the accuracy in the determination is about 15%, due the uncertainty on the non-perturbative QCD calculations involved, while in the ratio this uncertainty largely cancels .
If the width difference between the two mass eigenstates and CP violation effects are neglected, the probability for a meson produced at in a definite flavour eigenstate to decay at a time in the opposite (or same) flavour eigenstate can be simply expressed as:
| (1) |
where is the average lifetime, and .
In principle, using Eq. 1, it is possible to measure provided that, for every selected meson, one can measure the flavour state at production time, the flavour state at decay time, and the proper decay time. If the experimental sensitivity is not enough to perform such a measurement, the so-called “amplitude method”, consisting in fitting the amplitude of the oscillating term in Eq. 1 for a fixed value of the frequency, is commonly used to show the agreement of the data with a certain hypothesis for the value of ; to do this, the fitted value of is plotted as a function of the oscillation frequency being tested, . It is expected for to be consistent with one at the true value of and with zero at far lower frequencies.
The lower limit on at 95% C.L. is defined as the smallest value of for which an amplitude is not excluded at 95% C.L., while the sensitivity of a measurement is conventionally defined as the expected 95% C.L. lower limit on if the true value of were infinite.
2 New experimental results
In this section, the most recent experimental results on the search for oscillations from the ALEPH collaboration will be described .
Three different event selections have been applied to approximately four million hadronic Z decays, collected by the ALEPH detector from 1991 to 1995, and, for the first analysis alone, to about 400000 hadronic Z decays taken at the Z peak for calibration purposes from 1996 to 2000. The first selection reconstructs exclusively some hadronic decays; the second selection reconstructs semileptonic decays in a semi-exclusive manner, while the third is an inclusive selection of semileptonic decays.
2.1 Flavour Tagging
The three analyses use a similar algorithm for the determination of the flavour at production. In the event hemisphere opposite to the one containing the candidate, a neural network is used to discriminate tracks coming from the primary and the secondary vertex and to compute jet charges and primary and secondary vertex charges, which are combined with the charge of lepton or kaon candidates (if present) in a single estimator.
In addition, information from the hemisphere containing the candidate is also used, in particular by calculating charge estimators with the fragmentation tracks and looking at fragmentation kaon candidates. Finally, the correlation between the flavour and the angle of the with respect to the initial electron direction, due to the b forward-backward asymmetry, is exploited.
The average probability for signal events to tag incorrectly the initial state flavour is found to be about 24% for the three analyses.
The flavour state at decay is determined from the sign of the charge of the decay products. In the analyses using semileptonic decays, the opposite correlation between the lepton charge and the flavour in cascade decays with respect to the signal is taken into account.
2.2 Analysis of Fully Reconstructed Hadronic Decays
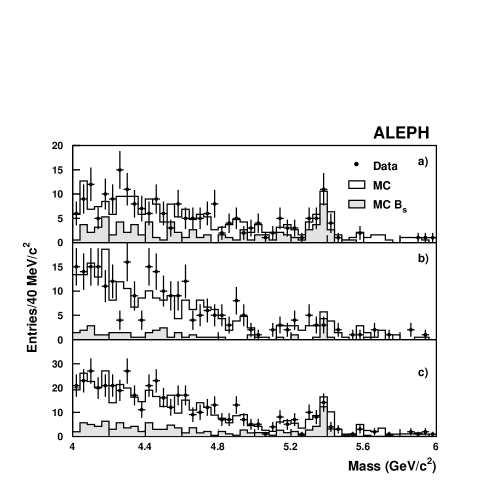
This analysis is performed on a selected sample of , , and decays, where and the meson decays into , , or . The resolution of the reconstructed mass is about 20 MeV/, and the selection efficiency ranges from 5% to 20%, depending on the decay channel.
The signal-to-background discrimination is largely improved by the reconstruction of the photons and neutral pions emitted in the decays with a or a ; otherwise, such decays would be reconstructed with a significantly lower mass and a much poorer mass resolution.
The selected candidates are 80, and their mass spectrum is shown in Figure 1. The composition of the sample in terms of signal events, events with other b hadrons and lighter quark events, is estimated on an event-by-event basis as a function of the helicity angle or the invariant mass of the candidate with a standard discrimination variable technique. The estimated signal purity is in average about 36% but can reach 80% for some events.
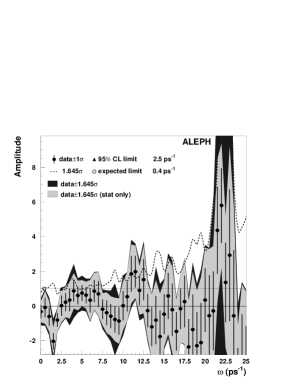
The main interest of this analysis resides in the very precise measurement of the decay proper time, due mainly to the fact that all the decay particles are measured and therefore the momentum is accurately known, at the percent level. The error on the measured decay length is around 180 m, and the error on the proper time is about 0.08 ps. This results in a relatively slower degradation of the amplitude error at increasing test frequencies, and allows this analysis to give a significant contribution to the combined amplitude spectrum at high frequencies, despite its very low sensitivity (Figure 1).
2.3 Analysis of Pairs
The second analysis discussed here relies on the reconstruction of decays, with the meson decaying in one of the following hadronic and semileptonic decay modes:
| (5) |
Compared with a similar analysis previously published , it takes advantage from an improved estimation and tracking performance, a general reoptimization of the selection cuts and a better background discrimination.
As the neutrino from the decay (and the one from the decay, if any) is undetected, its energy is estimated from the missing energy in the hemisphere . This results in an average relative uncertainty on the momentum of about 11%. The decay length uncertainty is about 240 m and it is worse than for the fully exclusive analysis due to the smaller angle among the decay particles in the laboratory system.
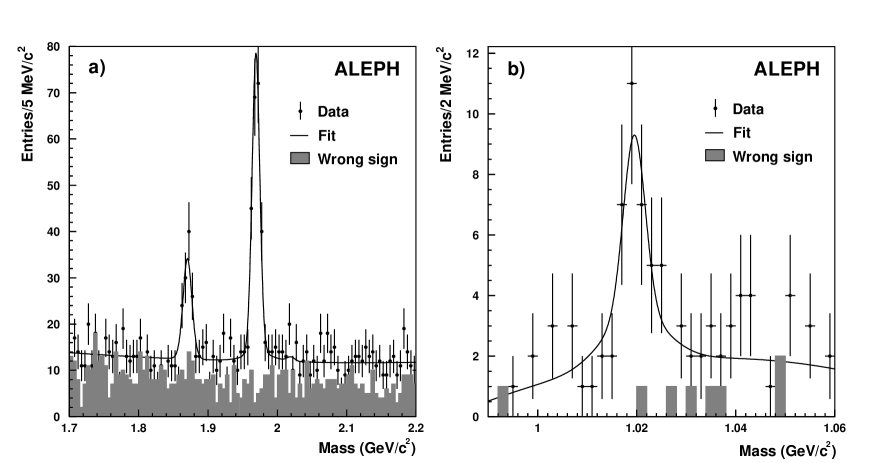
The candidates selected are 333; a major source of background to the event selection comes from decays, which can be discriminated from the signal by the differences in shape of the distributions of the lepton momentum, the invariant mass, the estimated momentum and the number of charged particles forming a good vertex with the lepton. The fraction of combinatorial background is estimated from a fit to the () mass spectra for the hadronic (semileptonic) decays, shown in Figure 2. The signal purity depends strongly on the decay mode, and is 47% in average.
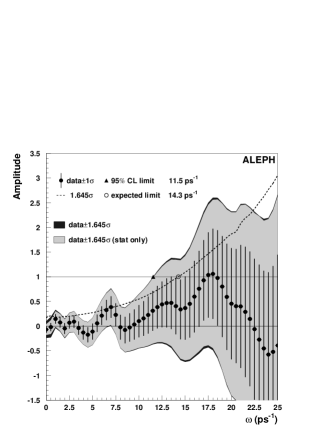
The result of the fit to the amplitude of the oscillation term is shown in Figure 3.
2.4 Inclusive Semileptonic Analysis
This analysis is based on a sample of inclusively selected semileptonic decays, and supersedes a similar analysis . Event hemispheres with a lepton having a large transverse momentum relative to the nearest jet are selected, and the charmed particle from the b-hadron decay is reconstructed by means of a topological algorithm. The inclusion in the secondary vertex fit of a “B track” together with the lepton and the charmed particle, and the reconstruction of photons from the decay of the charmed particle, allow to improve the decay length measurement precision up to 22%.
In average, the decay length resolution is about 370 m; however, the statistical significance of the data sample is greatly enhanced by parameterizing the decay length resolution as a function of several quantities, mostly related to the topology of the decay and the quality of the vertex reconstruction. The momentum is estimated using the lepton energy, the neutrino energy, and the energy of a jet clustered around the charged particles coming from the D vertex. The momentum resolution is parameterized event-by-event, and is about 12% in average.
The fraction of events in the selected sample is enlarged by the use of a b-tagging algorithm, and a neural network is used to discriminate direct decays with respect to cascade decays (), exploiting the differences between them in terms of lepton kinematics and vertex topology. Finally, the abundance of decays compared to other b hadron species is estimated as a function of the total charge and the charged multiplicity of the tertiary vertex, and of the presence of kaons coming from the fragmentation and the decay of the charmed particle. After the selection, 74026 candidates remain, of which 87% contain decays, and 10% are decays.
The results of the amplitude fit performed on this sample are visible in Figure 3. It is worth to stress that, compared with the previous version of this analysis, the event statistics is more that two times larger, and the description of the proper time resolution and the signal purity is much more detailed, resulting in an increase in the sensitivity from 9.6 ps-1 to 14.3 ps-1.
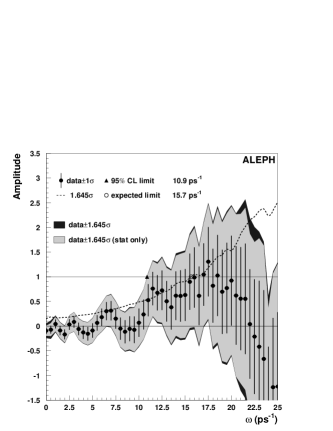
2.5 Combined Result
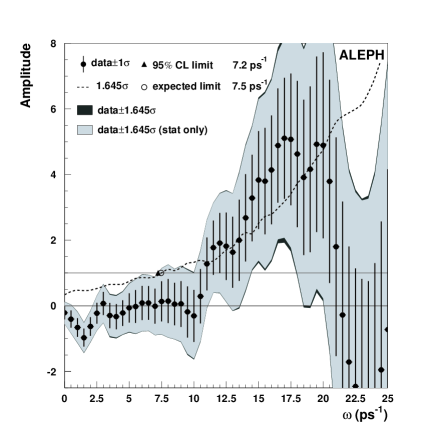
The amplitude spectra for all three analyses have been combined and the result is shown in Figure 4. It can be seen that a 95% C.L. lower limit of 10.9 ps-1 can be put on the oscillation frequency, compared to a sensitivity of 15.7 ps-1. This is, presently, the highest sensitivity reached by a single experiment.
3 Present Status of the Measurements
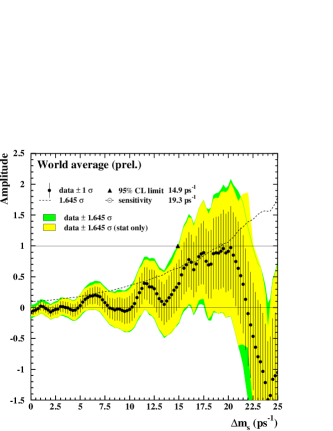
The new ALEPH results have been combined with all the available results from other experiments (some of which still preliminary) , and the amplitude spectrum for the combination is shown in Figure 4. The 95% C.L. lower limit on is 14.9 ps-1, and the sensitivity reaches 19.3 ps-1. These numbers are within the range allowed by a global fit on the unitarity triangle parameters , which gives ps-1.
It is clear that the final sensitivity to be reached by all the analyses from the LEP collaborations and SLD combined together, cannot be far from its present value. On the other hand, the Tevatron Run II data is expected to allow CDF and D0 to reach, by the 2002 summer, a sensitivity of several tens of ps-1, well beyond the value given by the indirect measurement quoted above.
References
References
- [1] D. Abbaneo et al, hep-ex/0112021.
- [2] M. Ciuchini et al, JHEP 07, 013 (2001).
- [3] H.-G. Moser and A. Roussarie, Nucl. Instrum. Methods A 384, 491 (1997).
- [4] D. Abbaneo and G. Boix, JHEP 08, 004 (1999).
- [5] A. Heister et al, CERN-EP-2002-016, submitted to Eur. Phys. J. C.
- [6] D. Décamp et al, Nucl. Instrum. Methods A 294, 121 (1990).
- [7] D. Buskulic et al, Nucl. Instrum. Methods A 360, 481 (1995).
- [8] D. Buskulic et al, Phys. Lett. B 377, 205 (1996).
- [9] A. Heister et al, Phys. Lett. B 512, 30 (2001).
- [10] R. Barate et al, Eur. Phys. J. C 7, 553 (1999).
- [11] http://lepbosc.web.cern.ch/LEPBOSC/.
- [12] F. Parodi et al, http://ckm-workshop.web.cern.ch/ckm-workshop/.