DETERMINATIONS OF AT = 14 TO 44 GEV
USING RESUMMED CALCULATIONS
The strong coupling constant is determined using recently re-analysed annihilation data collected by the JADE experiment at =14 to 44 GeV. The measurements are based on +NLLA predictions for various event shape observables. The calculations are found to describe reliably data at the lowest energies of the continuum where non-perturbative contributions become important. The results for are in good agreement with the QCD expectation for the running of the strong coupling constant. This is the first determination of at = 14 and 22 GeV based on resummed QCD predictions.
1 Introduction
Tests of Quantum Chromodynamics (QCD) substantially benefit from annihilation experiments at lower centre-of-mass energies since the characteristic energy evolution of the theory is expected to become more manifest towards decreasing . The re-analysis of data collected by the JADE experiment , as counterpart to the LEP data, has been shown to be a valuable effort. Recently, data at energies down to = 14 GeV could be employed in state-of-the-art QCD studies due to the successful resurrection of the original JADE simulation and event reconstruction software.
In the last decade, significant progress has been made in the theoretical calculations of event shape observables serving as powerful tools to investigate perturbative and non-perturbative aspects of QCD particularly at PETRA energies. This analysis focuses on determinations based on resummed calculations for event shapes which are applied here for the first time at = 14 and 22 GeV. Event shape data have also been used to assess the performance of various QCD event generators tuned to LEP data.
2 Data Samples and MC Simulation
The JADE detector was operated from 1979 to 1986 at the PETRA collider. It was designed as a hybrid -detector to measure charged and neutral particles. The studies presented here are based on multihadronic data samples (with number of events in brackets) at = 14.0 (1734), 22.0 (1390), 34.6 (14372, data taken 1981-82), 35.0 (20688, data taken 1986), 38.3 (1587) and 43.8 GeV (3940). Simulated data were generated using the QCD event generators Pythia 5.7, Ariadne 4.08 and Herwig 5.9 combined with the JADE detector simulation. We adopted the parameter sets used by the OPAL experiment to describe data at = . We also considered a predecessor version Jetset 6.3 used in former JADE studies since it was shown to describe hadronic final states. Comparisons of the simulated and measured distributions of various integral and spectral quantities generally gave a good description of the measured data. So the simulation can be used to correct for detector effects.
3 Event Shapes at PETRA Energies
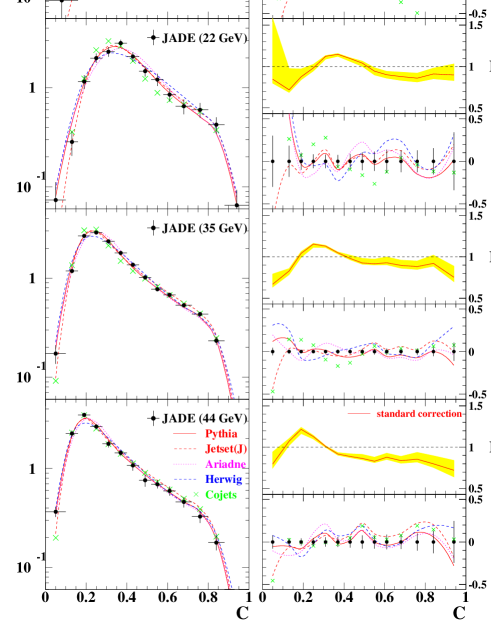
From the data passing the multihadronic selection criteria , the distributions of the event shape observables thrust , heavy jet mass , total and wide jet broadening and , parameter and the differential 2-jet rate based on the Durham scheme are calculated (cf. ). The distributions are corrected for the limited acceptance and resolution of the detector and for initial state photon radiation effects using Pythia for the standard correction. Since mass effects due to the electroweak decay of heavy b-hadrons faking gluon activity in the 3-jet region are crucial at = 14 and 22 GeV, we take the contribution as an additional background to be subtracted from the distributions.
As an example, the resulting hadron level data distributions for are represented by Fig. 1. For comparison, the respective distributions predicted by the QCD models based on u-, d-, s- and c-flavoured events are shown. In case of Pythia, there is generally a good agreement between the data and the model over the whole kinematic range of the observables. The performance of Ariadne and Herwig is more moderate at 14 GeV and improves at increasing c.m.s. energies. Herwig significantly underestimates the peak region of the distributions. In contrast, the JADE-based Jetset version fits the 14 GeV data but increasingly deviates from the data at higher energies. The prediction of Cojets is clearly disfavoured by the lower energy data and remains worse also at higher energies. Thus we do not consider this model for our studies.
4 Measurements of
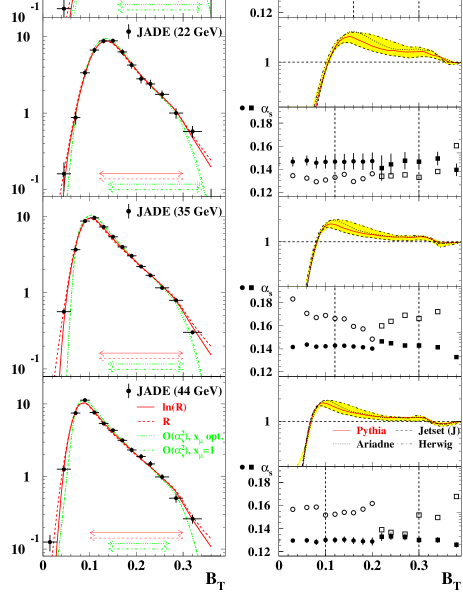
The determination of is based on a combination of an exact QCD matrix element calculation intended to describe the 3-jet region of phase space and a next-to-leading-logarithmic approximation (NLLA) valid in the 2-jet region where multiple radiation of soft and collinear gluons from a system of two hard back-to-back partons dominate. We perform -fits of the theoretical predictions corrected for hadronisation effects. For the main results, we use the -matching for the perturbative prediction with the renormalisation scale factor = 1 and Pythia for the estimation of non-perturbative contributions. As an example, Fig. 3 shows the fitted predictions for . We generally observe stable fits and good agreement with the data at all c.m.s. energies with ranging from about 0.2 to 2.0. In case of , a significant excess of the theory over the data in the 3-jet region of the distributions is present.
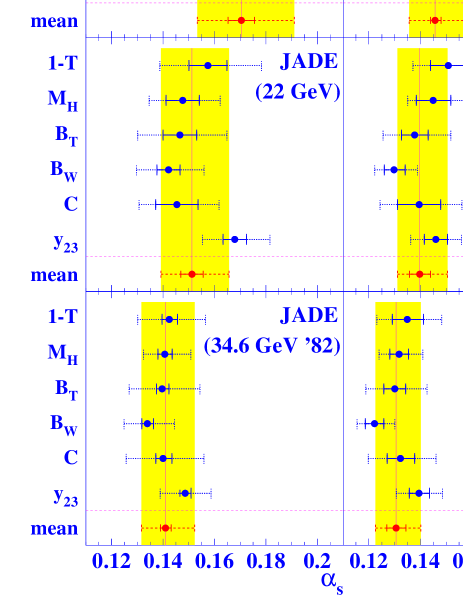
In principle we follow the procedure in to estimate experimental and theoretical systematic errors but include additional MC modelling uncertainties. Hadronisation effects and uncertainties increase significantly at 14 GeV. Experimental errors are under control for all data samples. On the basis of fit and experimental errors, the individual results are consistent with each other within 1-2 standard deviations. For each c.m.s. energy, the -results of the six observables were combined using the weighted mean method . The final results obtained are listed in Tab. 1. The total errors are dominated by higher order uncertainties. At = 14 and 22 GeV, hadronisation uncertainties are very large but still of the same order as the renormalisation scale uncertainties.
5 Conclusions
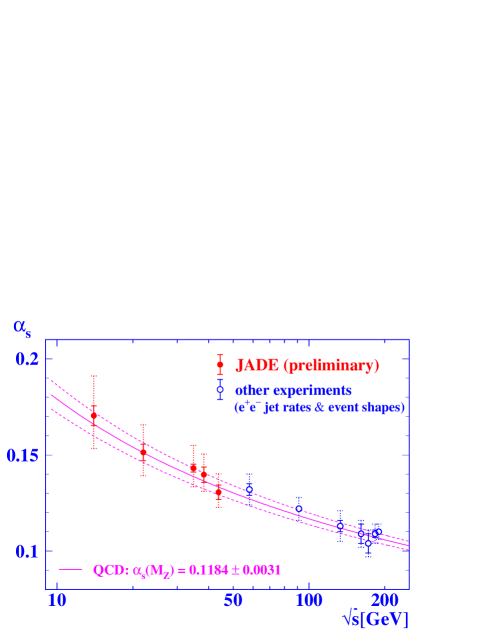
Resummed QCD theory fits event shape data measured with JADE well down to = 14 GeV and allow consistent determinations of . The values obtained at the lowest energies are affected by large hadronisation uncertainties. The LEP-tuned Pythia Monte Carlo used for the estimation of non-perturbative effects is surprisingly well capable of describing many aspects of hadronic final states at PETRA energies. The results obtained here as well as in similar analyses at higher energies based on resummed event shapes (Fig. 4) agree well with the QCD expectation for the running coupling . A fit of the prediction to these values taking only experimental errors into account yields = with =. Even considering total errors, the hypothesis of a constant value of is disfavoured by a fit probability of . The JADE data significantly improve the verification of QCD on basis on data.
| () | fit | exp. | hadr. | higher ord. | total | |
|---|---|---|---|---|---|---|
| 14.0 | ||||||
| 22.0 | ||||||
| 34.6 (’82) | ||||||
| 35.0 (’86) | ||||||
| 38.3 | ||||||
| 43.8 | ||||||
References
References
- [1] P.A. Movilla Fernández et al., Eur. Phys. J. C1 (1998) 461; O. Biebel, P.A. Movilla Fernández, S. Bethke and the JADE Coll., Phys. Lett. B459 (1999) 326.
- [2] P.A. Movilla Fernández et al., Eur. Phys. J. C22 (2001) 1; S. Kluth, P.A. Movilla Fernández, S. Bethke et al., ibid. C21 (2001) 199; P. Pfeifenschneider et al., ibid. C17 (2000) 19; M. Blumenstengel et al., Phys. Lett. B517 (2001) 37.
- [3] JADE Coll., W. Bartel et al., Phys. Lett. B88 (1979) 171; JADE Coll., W. Bartel et al., ibid. B129 (1983) 145; JADE Coll., S. Bethke et al., ibid. B213 (1988) 235.
- [4] L. Lönnblad, Comp. Phys. Comm. 71 (1992) 15; G. Marchesini et al., ibid. 67 (1992) 465; T. Sjöstrand, ibid. 82 (1994) 74.
- [5] OPAL Coll., G. Alexander et al., Z. Phys. C69 (1996) 543; OPAL Coll., K. Ackerstaff et al., Eur. Phys. J. C1 (1998) 479; OPAL Coll., M.Z. Akrawy et al., Z. Phys. C47 (1990) 505. For a survey of tunes to LEP data see: I.G. Knowles et al., “QCD Event Generators” (1995), hep-ph/9601212.
- [6] T. Sjöstrand, Comp. Phys. Comm. 39 (1986) 347; T. Sjöstrand et al., ibid. 43 (1987) 367.
- [7] R. Odorico, Comp. Phys. Comm. 72 (1992) 238; P. Mazzanti et al.,Nucl. Phys. B394 (1993) 267.
- [8] R.K. Ellis, D.A. Ross and A.E. Terrano, Nucl. Phys. B178 (1981) 421.
- [9] S. Catani et al., Nucl. Phys. B407 (1993) 3; S. Catani et al., Phys. Lett. B295 (1992) 269; G. Dissertori and M. Schmelling, ibid. B361 (1995) 167; S. Catani and B.R. Webber, ibid. B427 (1998) 377; Y.L. Dokshitzer, A. Lucenti, G. Marchesini and G.P. Salam, JHEP 01 (1998) 11.
- [10] S. Bethke, J. Phys. G26 (2000) R27.