Precise measurement of the decay
Abstract
The decay rate of has been measured with the NA48 detector at the CERN SPS. A total of candidates have been observed with a residual background of . The branching ratio is determined to be and the vector coupling constant . This result suggests that the CP-violation effects are dominating in the decay. An upper limit for the decay rate in the two photon mass region is also given.
, , , , ††thanks: Present address: KEK, Tsukuba, Ibaraki, 305-0801, Japan. , ††thanks: Present address: EP Division, CERN, 1211 Genève 23, Switzerland. , ††thanks: Based at Rutherford Appleton Laboratory, Chilton, Didcot, OX11 0QX, U.K. , , , ††thanks: Present address: NIKHEF, PO Box 41882, 1009 DB Amsterdam, The Netherlands. , , , ††thanks: Funded by the U.K. Particle Physics and Astronomy Research Council. , , , , , , , , , , , , , , , , ††thanks: Present address: Sezione dell’INFN di Firenze, I-50125 Firenze, Italy. , ††thanks: Present address: SLAC, Stanford, CA 94309, USA. , ††thanks: On leave from Österreichische Akademie der Wissenschaften, Institut für Hochenergiephysik, A-1050 Wien, Austria. , , , , ††thanks: On leave from JINR, Dubna,141980, Russian Federation , , , , , , , , , , , , , , , , , , , ††thanks: Dipartimento di Fisica dell’Università di Modena e Reggio Emilia, I-41100, Modena, Italy , , , , ††thanks: Istituto di Fisica Università di Urbino, Italy , , , , , , , , , , , , , , , , , , ††thanks: Funded by the German Federal Minister for Research and Technology (BMBF) under contract 7MZ18P(4)-TP2. , , , , , ††thanks: Funded by Institut National de Physique des Particules et de Physique Nucléaire (IN2P3), France , , , , , , , , , , , , , , , , , , , , , , , , , , , ††thanks: Funded by the German Federal Minister forResearch and Technology (BMBF) under contract 056SI74. , , , , , , , , , , ††thanks: Supported by the KBN grants 5P03B101120 and SPUB-M/CERN/P03/DZ210/2000 and using computing resources of the Interdisciplinary Center for Mathematical and Computational Modelling, University of Warsaw. , , , , , , , ††thanks: Funded bythe Austrian Ministery for Traffic and Research under the contract GZ 616.360/2-IV GZ 616.363/2-VIII, and by the Fonds für Wissenschaft und Forschung FWF Nr. P08929-PHY
1 Introduction
The measurement of the decay is useful to constrain the CP conserving amplitude of the decay via two photon exchange. Previous measurements of the decay [1, 2, 3, 4] have been compared with calculations performed in the framework of the Chiral Perturbation Theory (), the effective theory of the Standard Model at low energy in the hadronic sector. These predictions are best described in terms of the two amplitudes A and B (referring to angular momentum states and of the two photons respectively) in the Lorentz invariant expression for the double differential decay rate [5]:
| (1) |
with and the kaon mass and momentum, and the two photon momenta and the kinematic bound for the variable, given by:
The leading calculation predicts B=0,
in qualitative agreement with the experimental observation of a
spectrum peaked at high values, but underestimates the
branching ratio by about a factor of three [6].
At the rate and the spectrum can be
reproduced by adding a contribution from the VMD
mechanism [5, 7, 8], via the coupling constant
[9, 10, 11].
The VMD mechanism could enhance the state for the two photons,
hence allowing a sizeable CP conserving contribution which is
not helicity suppressed for the decay [12].
In this paper we present a new measurement
of the branching ratio and decay spectrum of the decay ,
based on data collected
in the years 1998 and 1999 with the apparatus of the NA48 experiment.
Quantitative information on the VMD contribution is obtained
from the spectrum at low z values.
2 Experimental set-up
The events are collected using the NA48 detector located at the
CERN-SPS and primarily devoted to measure the parameter
which characterises direct CP violation
in neutral Kaon decays into two pions [15][16].
Neutral Kaons are produced in interactions of 450 GeV/
protons on a beryllium target during 2.4 seconds every 14.4 seconds.
A system of sweeping magnets and collimators defines a
neutral beam of per burst and
divergence of mrad.
A fraction of the non interacting protons are redirected by channelling
in a bent crystal, to a second target, 120 metres downstream of the
first, to generate a beam [17].
In order to tag decays, the protons before hitting this target are
detected by an array of scintillation counters (tagger).
The two beams converge with an angle of mrad at the calorimeter,
120 metres downstream of the final collimators.
The decay region is contained in an evacuated cylindrical vessel 89 metres
long separated from the NA48 detector volume by a thin
Kevlar window of a radiation length ().
The neutral beam traverses the detector inside a 16 cm diameter vacuum pipe.
A scintillation counter (AKS) placed on the beam defines the
upstream edge of the fiducial region for decays from that beam.
The most important detector element for this analysis is the quasi-homogeneous
liquid Krypton electro-magnetic calorimeter (LKr) structured in 13212 readout
tower cells deep [18]. The ionization signal from each of
the cells is integrated, amplified, shaped and digitised by 10-bit FADCs at
40 MHz sampling frequency.
The energy resolution can be parameterised as:
with E in GeV. The spatial and time resolutions are better than mm and ps,
respectively, for photons with energy greater than 20 GeV.
Seven ring shaped counters (AKL), consisting of plastic scintillator and iron
converters, surround the decay and spectrometer region in order to veto events
with photons outside the calorimeter acceptance. Their efficiency has been
estimated to be around .
The charged particles are reconstructed by a magnetic spectrometer consisting of
four drift chambers (DCH) and a magnetic dipole.
The space resolution for each projection
is m and the average efficiency is better than per plane. For
this analysis the spectrometer is used to veto events with
reconstructed tracks.
3 Data taking
Events of the decay channel and of the channel , used for normalisation, are collected by the same trigger, since their final states appear identical in all detector elements. The trigger decision is based on quantities which are derived from the sums of the energy deposited in the LKr calorimeter in groups of cells corresponding to 64 horizontal and 64 vertical slices [19]. The trigger requirements are:
-
1)
at maximum 5 peaks in each projection;
-
2)
total energy larger than 50 GeV;
-
3)
centre of gravity of the event, computed from the first moments of the energy peaks in the projections to be within 15 cm from the beam axis;
-
4)
proper time of the decay, computed from the second moments, less than from the beginning of the decay region.
The trigger efficiency has been checked to be better than [16]
using a minimum bias sample triggered by a scintillating fibre
hodoscope placed in the LKr volume at a depth of .
During the experimental runs roughly 180 Terabytes of raw data were recorded
and pre-selected by an on-line software filter, whose criteria are
subsequently tightened in the off-line analysis.
4 Analysis
The first step is to reconstruct the showers in the liquid krypton calorimeter summing the energies of the cells in a circle of cm radius from a local maximum. The time and the position of the shower are derived from the most energetic cells and from the centre of gravity of the energy. A partial overlap between two showers is resolved using the shower profile obtained from simulation. The shower energy is corrected for:
-
i)
the residual 0.4% non-uniformity in the calibration electronics chain, comparing energy and momentum of electrons from events as a function of the hit cell. The uniformity is improved to the 0.15% level;
-
ii)
the 1% peak-to-peak modulation of the response as a function of the impact point in the LKr cell due to the effects of a mm gap between electrodes in the vertical direction and to the finite integration time in the horizontal one;
-
iii)
the energy-leakage in the beam pipe at small radius, the material before the active volume and the presence of not properly working cells;
-
iv)
the small (0.1%) non-linearity.
Since the event is characterised by four clusters with the only
constraint of two showers coming from a decay,
all the events with at least four clusters are considered.
Each cluster must be located well inside the calorimeter
volume, i.e. within an octagon of 113 cm apothem, with 15 cm inner radius.
It must be at a distance larger than 2 cm from any non working cell
and separated from another cluster by
at least cm. The cluster energy must be between 3 GeV and
100 GeV and the time within 3 ns of
the event time, defined as the average of the cluster times.
The total energy of the clusters must be in the 70-170 GeV interval.
The two photon invariant mass is:
| (2) |
where are the cluster energies, with and the horizontal and vertical positions of the i-th cluster at the LKr front face. The longitudinal coordinate of the decay vertex, , is computed from the electro-magnetic calorimeter information assuming the nominal kaon mass for the parent particle:
| (3) |
where is the longitudinal coordinate of the LKr front face.
The overall energy scale is fixed by the fit of the position of AKS
counter, that vetoes all decays occurring upstream [15].
We only consider events for which there is no proton detected in the
tagger in time (within ns) with the event;
this rejects [16] of the
decays, due to accidental coincidences with a proton in the tagger.
Because of the small branching ratio, the signal is subject to large
backgrounds such as decays, with missing and/or overlapping photons,
mis-reconstructed decays with conversion in the
spectrometer and events generated by accidental pile up of particles
from two different events.
We distinguish two classes of cuts in the analysis:
rejection and rejection.
4.1 rejection.
Three different combinations of pairs can be formed from four showers. A variable is defined:
| (4) |
where are the resolutions of measured
from the data and parametrised as a function of the lowest photon energy,
typically MeV/ and
MeV/.
In order to select a candidate the best combination is
required to have , while the
events are selected with .
We retain for further analysis all combinations that give a photon
pair (that we call ) within 3 MeV/ from
and the other pair (corresponding to ) outside the
window MeV/.
The background concentrates in the most interesting region
for the determination of , namely at low
value ( MeV/) where the
signal is smaller. Due to mis-reconstructions
one of the may be reconstructed with a wrong mass.
This can happen in case of a -conversion or
Dalitz decay with one electron outside the
calorimeter acceptance that biases the photon energy reconstruction.
We use the first three drift chambers as a veto against conversions
and Dalitz decays if there are hits in coincidence,
ns, with the event time.
In addition we reject events with an overflow condition in the readout
of more than one plane of the drift chambers.
This condition is defined by the occurrence of more than seven hits
in a DCH plane in any 100 ns time interval.
In this case the front-end readout buffers are reset
and the DCH information cannot be used reliably.
The remaining background is reduced requiring
MeV/, where is the transverse momentum
to the kaon direction
of , which is the lowest-energy photon of the non-
pair of photons.
The variable is on average smaller for events than
for events and even lower when the photon energy is
underestimated.
Although this requirement reduces the acceptance for
at high and low , it does not degrade the sensitivity
to the amplitude as the
factor in equation 1 is already small.
4.2 rejection.
In order to reduce the background from decays,
we require the event to have only four clusters in-time, within 3 ns,
and no activity in the AKL veto counters in coincidence with the event.
As most of the background
events have one or two photons outside the LKr acceptance, the
reconstructed
according to formula (3) moves downstream the beam axis by at
least 6 metres.
Therefore, the fiducial volume is restricted to the first metres
of the decay region.
Events with missing energy are also reduced by requiring the
center of gravity, computed from the first momenta of the clusters (), to be less than cm from the beam axis.
The simulation of events
shows that after applying these cuts the background is composed of events with missed photons:
of the sample has two missing photons,
while of the sample results from one
photon missing the detector and two showers overlapping in the LKr.
The remaining events have all the six photons inside
the calorimeter but only four reconstructed because of two overlaps.
The corresponding showers are broader than for a single
isolated photon.
Events with missed photons are rejected on the basis of a variable,
, designed to estimate, for these events, the true kaon decay vertex
position. The same estimate, when
applied to signal events, produces an unphysical result, with a
distribution showing many events in the region upstream of the final
collimator. The distribution of this variable is shown in
figure 1.
A condition m rejects almost of
the background while retaining of the signal.
The procedure to define is based on the analysis of the possible
topologies of events with missed photons, as shown in the following
figure:
![[Uncaptioned image]](/html/hep-ex/0205010/assets/x1.png)
-
a can be reconstructed and the true vertex coordinate is obtained using equation (2) with . There are five possible combinations, other than the one of the reconstructed , but we consider only those that have smaller than ( m). We call the vertex estimate which is closest to this limit. -
one has a missing photon and two photons from the other ’s overlap. Starting from the hypothesys of two s which share a photon, we compute, for each group of three photons, the vertex coordinate , assuming each photon in turn to be the superposition of two photons with the same position in the calorimeter. For example if photons 1, 2 and 3 come from two s and photon 2 is overlapped, then is computed as:(5) Out of the twelve possible combinations we consider only the triplets with an invariant mass below and the vertex estimate closest to, but smaller than, .
For each event we define the variable .

The residual background originates from two overlaps of photons such that the is reconstructed unbiased, but the shape of one or two showers is different from that of a single isolated photon. As estimator of the cluster width we use the RMS of its energy profile in and :
| (6) |
where is the distance in the direction of the -th cell from the center of gravity of the cluster energy. An energy-dependent cut is applied to the width of each cluster. The value of the cut is defined in terms of the average and the standard deviation of the distribution of measured in photons from good . We require on the photons of and on the photons of . The signal reduction is at the level of .
5 Background evaluation
The candidates that survive all the above selections are
2558 in the signal region defined as MeV/. For 345 of these events more than one combination
satisfies the cut and therefore the mass assignment is ambiguous.
We estimate the contamination from decays and pile-up
processes directly from the data. To quantify the
background we rely on Monte Carlo.
We study the background in the signal region using
decays from different data samples: the proton tagged sample, collected
concurrently with the data, and a special high intensity run () taken in 1999.
In the case of the tagged sample we ask for a tight coincidence
within ns between the tagger and the LKr signals.
In this way we enrich the number of events contributing to
the background. Conversely the only contribution to in this
sample comes from the contamination due to accidental
coincidences in the tagger, which is estimated to be with the
cut used.

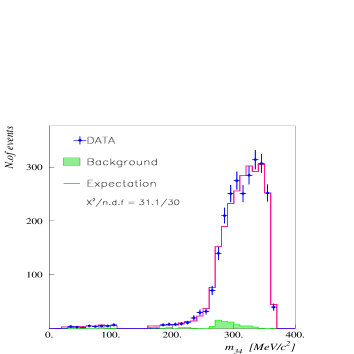
After applying the selection criteria, the
invariant mass distribution is shown in
figure 2 for events in the tagged sample
compared to the original mass distribution scaled by the
contamination factor.
The background is estimated from the tiny excess of tagged
events measured where the signal is smaller,
namely for MeV/ while for
MeV/ it is linearly estrapolated from
control regions on the sidebands of the peak
( MeV/ or MeV/).
This procedure leads to a background evaluation of
events.
Here the systematic error is related to the
subtraction of the contamination and to the fact that
events have a distribution of the decay vertex populated
only in the region between 6 and 18 metres.
The high intensity data sample provides about % of the
tagged statistic with negligible component.
The number of background events found
is in agreement with the previous estimate.
The cuts applied to reduce the background are mainly of
geometrical nature and can safely be simulated. The most critical cut
is the one on the cluster width, for which an accurate description of the LKr
response for overlapping showers is needed.
For this last variable we compare data and Monte Carlo distributions
in figure 3.
The simulation describes the data within both in shape and
quantity being normalised to the Kaon flux.
After the cut the estimated residual background is events, where the systematic uncertainty comes from the non-Gaussian
tail of the calorimeter response mainly due to photo-hadron reactions.
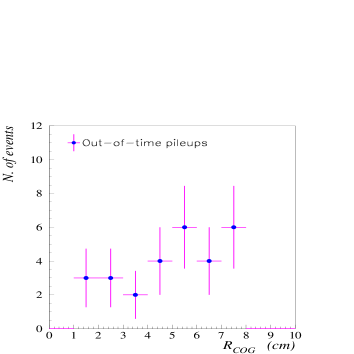
Finally, the pile-up events, which could originate for example from
two overlapped in-time kaon decays, can be quantified comparing the normalised
distributions of the center of gravity at the LKr for candidates
and for a good data sample.
An excess at cm is found in the distribution,
after having subtracted the background (figure 4).
When the excess is linearly extrapolated under the signal
we obtain a pile-up background level of events.
The choice of extrapolation function is dominating the systematic
error; however the linear one is expected from a uniform center of
gravity distribution and is confirmed by the distribution
for events with out-of-time clusters.

In Table 1 is reported the summary of the background
evaluation in the signal region and, as
cross-check, in
the control regions defined above.
| sample | Pile-up | Total bck | % | |||
|---|---|---|---|---|---|---|
| signal | 2558 | 70.210.7 | 4.12.1 | 8.15.3 | 82.412.1 | 3.2 |
| sidebands | 44 | 30.6 5.9 | 2.11.6 | 4.83.5 | 37.5 7.0 | - |
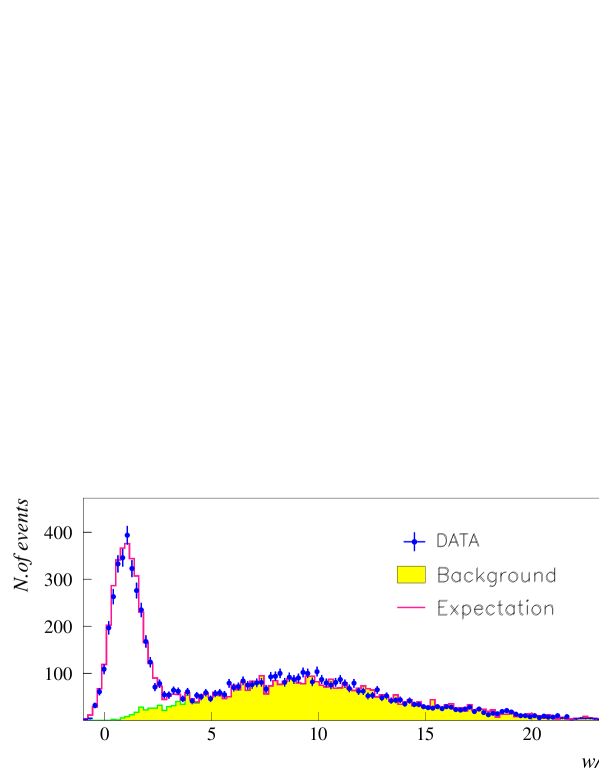
The overall background is . The invariant mass distributions and are shown in figure 5.

The background estimate is in agreement with that found in the two control regions where 44 background events are observed in the data with an expectation of .
6 Results and discussion
As confirmed by the Monte Carlo, most of the events in the low mass region shown in figure 5 are genuine events which suffer from the wrong combination of photons. Events with an ambiguous assignment for have a flat distribution in the mass region which will inflate the amount of events in the low-mass Mev/ region. To extract a value for the vector coupling constant we exclude events with ambiguous mass assignment. The events in the low-mass region are thus reduced by . In Table 2 we report the numbers of candidate, background and acceptance in the 20 bins of the MeV interval.
| n-a events | background events | acceptance | |
|---|---|---|---|
| 0 | 0.0 | 0.018 | |
| 0 | 1.0 | 0.060 | |
| 1 | 0.8 | 0.076 | |
| 3 | 0.2 | 0.073 | |
| 3 | 1.9 | 0.069 | |
| 2 | 0.6 | 0.062 | |
| 0 | 0.0 | 0.000 | |
| 0 | 0.0 | 0.000 | |
| 2 | 1.3 | 0.041 | |
| 9 | 2.1 | 0.040 | |
| 12 | 1.0 | 0.044 | |
| 23 | 1.9 | 0.054 | |
| 53 | 0.5 | 0.060 | |
| 184 | 16.6 | 0.062 | |
| 405 | 23.9 | 0.065 | |
| 465 | 10.6 | 0.064 | |
| 514 | 4.6 | 0.063 | |
| 498 | 0.6 | 0.077 | |
| 39 | 0.7 | 0.093 | |
| 0 | 0.0 | 0.000 |
We perform a fit of the bidimensional distribution of the two relevant kinematic variables and , defining a likelihood function as follows:
| (7) |
where is the measured number of events in the -th bin while is the corresponding expectation value given by the simulated plus the estimated background. The model adopted for the simulation of the process is described in [9] and it is normalised to the total number of decays in the fiducial volume. The uncertainty of the parameterisation of the vertex [13] is included in the systematic error. The best fit, with a of for degrees of freedom, gives:
The systematic error includes the following contributions: 0.02 from
the uncertainty in the parameters of the theoretical model, 0.03
from the uncertainty of the acceptance evaluation and 0.02 from
background evaluation and subtraction.
In figure 6 we show the distribution together with
the evaluated background and the
expectation for the fitted value of the vector meson exchange parameter
in the three low-mass regions a) MeV/,
b) MeV/ and c) MeV/.
Our data clearly disfavour .


The branching ratio is obtained from the number of candidates, including those with ambiguous mass assignment, normalising to the number of events observed in the same sample of decays and selected by the same cuts, in order to minimise the uncertainty in the acceptance corrections and is found to be:
Both the correction due to the Dalitz decay difference between the
normalisation mode and the
decay and the one due to the
interference in decays [16] are taken into account.
The uncertainty related to the experimental knowledge of the
branching ratio [21] is quoted separately.
The computed average value of the acceptance for the
process is and for the is .
The uncertainty related to this computation
is the main source of the systematic error in the branching
ratio measurement since, as shown in Table 2, it has sharp
variations. The residual background estimation, the
uncertainty in and the exclusion of the ambiguous events each
gives less than 1% variation on the branching ratio value.
As shown in figure 6 there is no evidence for a signal
in the invariant mass region
where we count 9 candidates and
() background events.
Using events with in 5 bins of between and
MeV/, we compute a model-independent upper limit [20]:
For this calculation we use the acceptance computed from events generated according to phase space, in a restricted region where it is almost uniform. Given the negligible contribution of the amplitude , our measurement of the vector coupling constant allows the CP-conserving component of the decay [12][14] to be predicted as:
This suggests that the CP-violation effects dominate in the mechanism.
ACKNOWLEDGEMENT
It is a pleasure to thank the technical staff of the participating laboratories, universities and affiliated computing centres for their efforts in the construction of the NA48 apparatus, in the operation of the experiment, and in the processing of data. We also grateful to G.D’Ambrosio and G.Valencia for useful discussions.
References
- [1] G.D. Barr et al., Phys. Lett. B 242 (1990) 523.
- [2] G.D. Barr et al., Phys. Lett. B 284 (1992) 440.
- [3] V. Papadimitriou et al., Phys. Rev. D 44 (1991) 573.
- [4] A. Alavi-Harati et al., Phys. Rev. Lett. 83 (1999) 917.
- [5] G. D’Ambrosio and J. Portoles, Nucl. Phys. B 492 (1997) 417.
- [6] G. Ecker, A. Pich and E. De Rafael, Phys. Lett. B 189 (1987) 363.
- [7] G. Ecker, A. Pich and E. De Rafael, Phys. Lett. B 237 (1990) 481.
- [8] P. Heiliger and L.M. Sehgal, Phys. Rev. D 47 (1993) 4920.
- [9] A.G. Cohen, G. Ecker and A. Pich, Phys. Lett. B 304 (1993) 347.
- [10] L. Cappiello, G. D’Ambrosio and M. Miragliuolo, Phys. Lett. B 298 (1993) 423.
- [11] J. Kambor and B.R. Holstein, Phys. Rev. D 49 (1994) 2346.
- [12] J.F. Donoghue and F. Gabbiani, Phys. Rev. D 51 (1995) 2187.
- [13] J. Kambor,J. Missimer and D. Wyler, Phys. Lett. B 261 (1991) 496.
- [14] F. Gabbiani and G. Valencia, Phys. Rev. D 64, 094008 (2001)
- [15] V. Fanti et al., Phys. Lett. B 465 (1999) 335.
- [16] A. Lai et al., Eur. Phys. J. C 22 (2001) 231.
- [17] N. Doble et al., Nucl. Instr. Meth. B 119 (1996) 181.
- [18] G. Unal for the NA48 coll., Proc. 9th Int. Conf. on Calorimetry in High Energy Physics, Annecy, France, 9-14 October 2000, HEP-ex-0012011.
- [19] G. Fischer et al., Nucl. Instr. Meth. A 419 (1998) 695.
- [20] G.J. Feldman et al., Phys. Rev. D 57 (1998) 3873.
- [21] D.E. Groom et al., Eur. Phys. J. 15 (2000) 1.