\docnumCERN–EP/2002–028
{Authlist}
The NA48 Collaboration
A. Lai, D. Marras
Dipartimento di Fisica dell’Università e Sezione dell’INFN di Cagliari, I-09100 Cagliari, Italy.
J.R. Batley, A. Bevan11footnotemark: 1, R.S. Dosanjh, T.J. Gershon22footnotemark: 2, B. Hay33footnotemark: 3, G.E. Kalmus, C. Lazzeroni, D.J. Munday, M.D. Needham44footnotemark: 4, E. Olaiya, M.A. Parker, T.O. White, S.A. Wotton
Cavendish Laboratory, University of Cambridge, Cambridge, CB3 0HE, U.K.55footnotemark: 5.
G. Barr, G. Bocquet, A. Ceccucci, T. Cuhadar-Dönszelmann, D. Cundy, G. D’Agostini, N. Doble, V. Falaleev, W. Funk, L. Gatignon, A. Gonidec, B. Gorini, G. Govi, P. Grafström, W. Kubischta, A. Lacourt, M. Lenti66footnotemark: 6, S. Luitz77footnotemark: 7, J.P. Matheys, I. Mikulec88footnotemark: 8, A. Norton, S. Palestini, B. Panzer-Steindel, D. Schinzel, G. Tatishvili99footnotemark: 9, H. Taureg, M. Velasco, O. Vossnack, H. Wahl
CERN, CH-1211 Genève 23, Switzerland.
C. Cheshkov, A. Gaponenko1010footnotemark: 10, P. Hristov, V. Kekelidze, D. Madigojine, N. Molokanova, Yu. Potrebenikov, A. Tkatchev, A. Zinchenko
Joint Institute for Nuclear Research, Dubna, Russian Federation.
I. Knowles, V. Martin, H. Parsons, R. Sacco, A. Walker
Department of Physics and Astronomy, University of Edinburgh, Edinburgh, EH9 3JZ, U.K.55footnotemark: 5.
M. Contalbrigo, P. Dalpiaz, J. Duclos, P.L. Frabetti1111footnotemark: 11, A. Gianoli, M. Martini, F. Petrucci, M. Savrié, M. Scarpa
Dipartimento di Fisica dell’Università e Sezione dell’INFN di Ferrara, I-44100 Ferrara, Italy.
A. Bizzeti1212footnotemark: 12, M. Calvetti, G. Collazuol, G. Graziani, E. Iacopini, F. Martelli1313footnotemark: 13, M. Veltri1313footnotemark: 13
Dipartimento di Fisica dell’Università e Sezione dell’INFN di Firenze, I-50125 Firenze, Italy.
H.G. Becker, H. Blümer, D. Coward, M. Eppard, H. Fox, A. Hirstius, K. Holtz, A. Kalter, K. Kleinknecht, U. Koch, L. Köpke, P. Lopes da Silva, P. Marouelli, I. Pellmann, A. Peters, S.A. Schmidt, V. Schönharting, Y. Schué, R. Wanke, A. Winhart, M. Wittgen
Institut für Physik, Universität Mainz, D-55099 Mainz, Germany1414footnotemark: 14.
J.C. Chollet, S. Crépé, L. Fayard, L. Iconomidou-Fayard, J. Ocariz, G. Unal, I. Wingerter-Seez
Laboratoire de l’Accélérateur Linéaire, IN2P3-CNRS,Université de Paris-Sud, 91898 Orsay, France1515footnotemark: 15.
G. Anzivino, P. Cenci, E. Imbergamo, P. Lubrano, A. Mestvirishvili, A. Nappi, M. Pepe, M. Piccini
Dipartimento di Fisica dell’Università e Sezione dell’INFN di Perugia, I-06100 Perugia, Italy.
L. Bertanza, A. Bigi, P. Calafiura, R. Carosi, R. Casali, C. Cerri, M. Cirilli1616footnotemark: 16, F. Costantini, R. Fantechi, S. Giudici, I. Mannelli, G. Pierazzini, M. Sozzi
Dipartimento di Fisica, Scuola Normale Superiore e Sezione dell’INFN di Pisa, I-56100 Pisa, Italy.
J.B. Cheze, J. Cogan, M. De Beer, P. Debu, F. Derue, A. Formica, R. Granier de Cassagnac, E. Mazzucato, B. Peyaud, R. Turlay, B. Vallage
DSM/DAPNIA - CEA Saclay, F-91191 Gif-sur-Yvette, France.
I. Augustin, M. Bender, M. Holder, A. Maier, M. Ziolkowski
Fachbereich Physik, Universität Siegen, D-57068 Siegen, Germany1717footnotemark: 17.
R. Arcidiacono, C. Biino, N. Cartiglia, R. Guida, F. Marchetto, E. Menichetti, N. Pastrone
Dipartimento di Fisica Sperimentale dell’Università e Sezione dell’INFN di Torino, I-10125 Torino, Italy.
J. Nassalski, E. Rondio, M. Szleper, W. Wislicki, S. Wronka
Soltan Institute for Nuclear Studies, Laboratory for High Energy Physics, PL-00-681 Warsaw, Poland1818footnotemark: 18.
H. Dibon, G. Fischer, M. Jeitler, M. Markytan, G. Neuhofer, M. Pernicka, A. Taurok, L. Widhalm
Österreichische Akademie der Wissenschaften, Institut für Hochenergiephysik, A-1050 Wien, Austria1919footnotemark: 19.
To be published in Physics Letters B
A Measurement of the Lifetime
1 Introduction
Precise measurements of the basic physics parameters defining the neutral kaon system, such as the masses and mean lifetimes of the and states, are important not only in their own right but also as essential inputs to many kaon physics analyses such as studies of indirect and direct CP violation or precision tests of CPT invariance.
The lifetime is presently known with a relative precision of about 0.1% [1], dominated by measurements from the NA31 experiment at CERN [2] and from the E731 and E773 experiments at Fermilab [3, 4]. Here we present a measurement of the lifetime from the NA48 experiment at the CERN-SPS, based on the same data samples as used for the precise determination of the direct CP violation parameter [5]. The lifetime is measured using an analysis technique introduced by NA31, namely a fit to the ratio of decay time distributions reconstructed in nearly collinear and beams. This gives a result which is essentially independent of the detector acceptance and therefore with reduced systematic errors; the beam is in effect used to determine the detection efficiency for decays.
The analysis method is described in more detail in the next section, followed in Sections 3 and 4 by a brief summary of the main features of the NA48 experiment and of the reconstruction and selection of decays; further details can be found in [5]. The fit used to extract the lifetime is described in Section 5 and the estimation of the systematic errors on the fitted lifetime is considered in Section 6.
2 The Method
A defining principle of the NA48 experiment is the simultaneous recording of decays occurring within a common decay region traversed by two almost collinear beams of neutral kaons. The relative target positions for each beam, one far upstream of the decay region and the other much closer, ensure that kaon decays in the two beams are due dominantly to the or to the component, respectively. Assuming equal detection efficiencies for decays from the and beams, the ratio of decay rates observed in each beam as a function of the longitudinal position can be expressed as
| (1) |
where is the kaon energy, is a normalisation function which depends on the relative beam intensities and are the proper lifetimes for kaon decays in the or beams. The functions are given by
| (2) |
where and are the and mean lifetimes, is the mass difference between the and states, and are the modulus and phase of the ratio of decay amplitudes, and the dilutions reflect the initial admixture of and in each beam. In practice, in place of , it is convenient to analyse the longitudinal distribution of decay vertices in terms of the variable which measures the decay proper lifetime relative to the upstream edge of the decay region, defined by the position, , of a set of scintillation counters.
Except for the beam at higher energies, where the interference term contributes appreciably, the functions and are dominated by the exponential terms and , respectively. Hence the ratio is approximately of the form
Since , the ratio is primarily sensitive to the lifetime . The lifetime is determined by fitting a function of the form given in Equations (1) and (2) to the ratio of decays reconstructed in the two beams. Besides the lifetime itself, the normalisation and the dilutions are also taken as free parameters in the fit, while the remaining physics parameters in equation (2) are taken from published measurements. Small acceptance differences between and decays are corrected using Monte Carlo, and background to the samples is subtracted using the data. The and decay modes are analysed separately and the results subsequently combined.
The ratio is reconstructed in 20 bins of energy of width GeV covering the range GeV and in lifetime bins of width . The fit to determine the lifetime is carried out in the lifetime range . The lower lifetime limit of largely avoids detector resolution effects associated with the start of the decay region at while the upper limit at is dictated by the trigger requirements. The choice of lifetime range approximately minimises the total error on the measured lifetime.
3 The NA48 experiment
The and beams in the NA48 experiment are derived from 450 GeV protons incident on separate targets positioned 126 m and 6 m upstream of the decay region, respectively [6]. The target is located 72 mm above the axis of the beam. The target and collimator system is aligned along an axis directed slightly downwards such that the and beams subtend an angle of 0.6 mrad and intersect at the centre of the detector, 120 m downstream of the target.
The beginning of the decay volume is accurately defined by a anti-counter (AKS) located at the exit of the collimator. The AKS is composed of a photon convertor followed by three scintillator counters and is used to veto all upstream decays in the beam. To minimise interactions of beam particles with air and material, the decay region itself is contained in a 90 m long evacuated tank terminated by a thin composite polyamide (Kevlar) window of thickness. The tank is followed by the NA48 detector, the principal components of which are a magnetic spectrometer for charged particle detection, a liquid krypton calorimeter for photon and electron detection, an iron-scintillator hadron calorimeter, and muon counters consisting of three planes of scintillator shielded by 80 cm thick iron walls.
The charged particle spectrometer [7] consists of two drift chambers (DCH1 and DCH2) located before, and two drift chambers (DCH3 and DCH4) located after, a central dipole magnet. Each chamber has an area of 4.5 m2 and is made up of four sets of two staggered sense wire planes oriented along four directions (horizontal, vertical, ). Track positions are reconstructed with a precision of 100 m per view, while the momentum resolution is (GeV/)%.
The liquid krypton calorimeter (LKr) [8] consists of 13000 cells, each of cross section about 2 cm 2 cm and depth 27 radiation lengths. For the average photon energy of 25 GeV, the transverse spatial resolution for photon showers is 1 mm and the energy resolution is 0.8%. The energy response is linear to about 0.1% in the range 5100 GeV. The photon time resolution is 500 ps and the event time is known with a precision of 220 ps.
An evacuated beam pipe of radius 8 cm running along the full length of the detector on its central axis transports undecayed beam particles through each of the detector components. The beam tube and DCH drift chambers are aligned along the bisector of the converging and beams in order to equalise the acceptance for and decays. Undecayed neutral kaons in the beam are largely confined within a transverse beam profile of radius cm at the position of the NA48 detector. The beam has a larger beam divergence and a correspondingly larger transverse profile of about 5 cm radius. Due to scattering in the beam collimators, both the and beams have an associated halo of particles extending to larger radii from the beam axis.
The trigger for decays [9] requires that the total energy deposited in the LKr calorimeter be greater than 50 GeV, that the kaon impact point at the calorimeter (had it not decayed) be within 15 cm of the beam axis, that the decay vertex be less than 5 lifetimes from the beginning of the decay volume, and that each of the horizontal and vertical projections of the LKr energy distribution contain at most five peaks. The trigger operates with negligible deadtime and high efficiency, %, with no significant difference between and decays. The first level of the trigger [10] is based on signals from a scintillator hodoscope positioned in front of the LKr calorimeter and on the hit multiplicity in DCH1, and also requires a total energy in the LKr and hadron calorimeters of at least 35 GeV. The second level trigger is based on tracks reconstructed using the information from DCH1, 2 and 4, and includes requirements that the decay vertex be less than 4.5 lifetimes from the beginning of the decay volume and that the reconstructed mass be larger than 0.95 . The efficiency of the first and second level triggers is about 99.5% and 98.3%, respectively, again with no significant difference between and decays. The trigger introduces a deadtime of about 1.1 %.
4 Event Selection
decays are reconstructed and selected using the same procedures and selection requirements as for the analysis [5]. The level of background remaining in the selected samples, and the correction for acceptance differences between and decays, are also evaluated using similar techniques to those in [5]. For the determination of the lifetime, it is the lifetime dependence of these corrections which is of importance, rather than their energy dependence or their overall normalisation.
4.1 The sample
The reconstruction of events is based entirely on data from the LKr calorimeter. Any group of four showers, each reconstructed within 5 ns of their average time, is considered. The energy of each shower is required to lie between 3 and 100 GeV, and showers close to the edges of the calorimeter (within 11 cm of the outer edge or within 15 cm of the central axis) or within 2 cm of a defective cell are excluded. The transverse distance between any pair of showers must be greater than 10 cm. The position of the centre of gravity of the event is defined as the energy-weighted average of the four shower positions. The radial distance, , of the centre of gravity from the detector axis is required to be less than 10 cm to suppress events due to the decay of particles in the beam halo.
The kaon energy is estimated simply as the sum of the four shower energies. The longitudinal decay vertex position is reconstructed from the energies and positions of the four showers, under the assumption that they come from the decay of a particle with the kaon mass, , moving along the beam axis. A resolution of -60 cm is achieved on the vertex position, depending on the kaon energy and decay point. The shower pairing which best represents two decays is inferred using a variable constructed from the sum, , and difference, , of the two candidate masses and a parameterisation of the resolutions on .
Background from decays is suppressed by requiring no additional showers with energy greater than 1.5 GeV within ns around the event time, and by requiring (which corresponds to 3.7 on the resolution). All other potential sources of background to the sample are negligibly small.
The level of background remaining in the sample is estimated using a control region at large values of , , dominated by background. Genuine signal events populating this control region are first subtracted using the data, for which background is negligible. Small differences in the shape of the distribution for and decays are taken into account by applying a correction derived from Monte Carlo. The background in the signal region, , is estimated by extrapolating uniformly from the control region, with an additional factor derived from Monte Carlo simulation. The background estimation is carried out separately for each bin of kaon energy and proper lifetime. At low energy and at low lifetime, the fraction of background in the sample is negligibly small, but rises with both energy and lifetime, reaching about 3 % for GeV and . An increase of the background fraction with lifetime is to be expected since, when only four photons are detected in the LKr calorimeter, the reconstructed vertex position for a decay is shifted downstream from its true position, while decays occuring upstream of the decay region are largely removed by the beam collimators.
4.2 The sample
events are reconstructed from oppositely charged pairs of tracks found in the magnetic spectrometer. Each track is required to have momentum greater than 10 GeV and to lie at least 12 cm from the centre of each DCH. Each track is also required to lie within the acceptance of the LKr calorimeter and the muon counters after extrapolation downstream. The momentum-weighted average of the track positions after extrapolation to the LKr calorimeter is used to define the position of the centre of gravity of the event. Its radial distance, , from the detector axis is required to be less than 10 cm.
The separation between the two tracks at their point of closest approach after extrapolation upstream from the spectrometer is required to be less than 3 cm. The point midway between the tracks at their closest approach is used to define the decay vertex position. The resolution on the longitudinal position of the decay vertex is in the range -50 cm, while the transverse resolution is about 2 mm. The kaon momentum is computed from the opening angle of the two tracks and from the ratio of their momenta, assuming that the event corresponds to a decay. Thus the reconstruction of both the decay vertex position and the kaon momentum, and hence also of the proper time for the decay, depend only on the geometry of the detector.
Background to the sample from decays is reduced to a negligible level by applying an energy dependent upper cut on the track momentum asymmetry . This cut also serves to remove events with tracks at low radius to the beam axis in a way which depends only on the momentum ratio of the two tracks. Background from e () decays is suppressed by requiring to be less than 0.8 for each track, while () decays are suppressed by rejecting events where one or both of the tracks is associated with a signal in the muon counters within ns. Additional suppression of both and decays is obtained by requiring that the invariant mass, , be compatible with the kaon mass to within 3 of the (energy-dependent) mass resolution, and by requiring a small missing transverse momentum, MeV2/, where is the component of the kaon momentum perpendicular to the line joining the production target (identified from the vertical position of the decay vertex, as described below) and the point where the kaon trajectory crosses the plane of the first drift chamber. The quantity has approximately the same resolution for decays in both the and beams.
The level of background remaining in the sample is estimated by extrapolating an exponential fitted to the distribution in a control region, MeV2/, dominated by background, into the signal region MeV2/. Due to limited statistics, the lifetime bin width was increased from to for this procedure. The fraction of background in the sample is found to be about , and no significant dependence of the background fraction on lifetime is observed in any bin of energy. An appreciable lifetime dependence is not expected in this case since both the signal and background are observed in the detector as two-track final states with configurations which vary in similar fashion with the decay vertex longitudinal position.
4.3 tagging
For decays, the good resolution on the transverse position of the decay vertex allows a clean separation of decays from the and beams; decays with a vertex position more than 4 cm above the beam axis after extrapolation of the reconstructed parent kaon trajectory back to the position of the AKS counter were classed as belonging to the beam (“vertex tagging”). For decays, only the longitudinal position of the decay vertex can be reconstructed. In this case, the identification of decays from the beam is accomplished using a tagging station (Tagger) traversed by the proton beam during transport to the target and consisting of two scintillator ladders (one horizontal, one vertical) [11]. Each scintillator counter has a time resolution of 140 ps, and a proton crosses at least two counters. A decay is classed as belonging to the beam if a signal is observed in the Tagger within ns of the reconstructed event time. A small fraction, , of decays are mistagged as belonging to the beam due to Tagger detection inefficiencies. A larger fraction, %, of decays are mistagged as belonging to the beam due to accidental proton signals in the Tagger in time with the event. The values of and were inferred from studies of the mistagging fractions and for vertex tagged decays, combined with studies of and decays to determine the small differences in mistagging rates between charged and neutral modes.
4.4 Event samples
Applying the selection cuts above to the data recorded by NA48 during 1998 and 1999 yielded samples of 13.2M , 12.2M , 3.1M and 2.8M events with reconstructed lifetimes in the range , where the number of events has been corrected for - mistagging.
Samples of simulated events corresponding to about 3-5 times the data statistics were also available for analysis. The Monte Carlo included a detailed modelling of the and beams (including the beam halo) and used the GEANT package [12] for particle tracking and the simulation of processes such as multiple scattering, photon conversion, and secondary interactions. Simulation of the LKr calorimeter response was based on a library of electromagnetic and hadronic showers generated using GEANT. The simulated events were passed through the same reconstruction and selection code as the data. Asymmetric non-Gaussian tails in photon shower energies due to hadron photoproduction in the liquid krypton, which arise in about of cases, were modelled using a parameterisation which was applied to the reconstructed shower energies in the Monte Carlo events.
4.5 Acceptance correction
Since the and beams are almost collinear, and since and decays are recorded simultaneously using a common trigger, the acceptances for and decays as a function of energy and position are equal to good approximation, and the detector acceptance essentially cancels in the ratio of lifetime distributions from the two beams. For the decay mode, effects due to decay in flight of the charged pions also cancel in the ratio.
Small acceptance differences arise due to the different divergences and transverse profiles of the and beams and the consequent differences in illumination of the detector. Also, the different definition of the upstream edge of the decay region for the two beams introduces large acceptance differences at low values of the reconstructed lifetime. The AKS veto requirement effectively represents a cut on the true lifetime of decays in the beam while the upstream acceptance for decays extends smoothly into the region . This difference is clearly seen in Figure 1 where examples of the uncorrected reconstructed lifetime distributions for the and beams are plotted.
Acceptance differences for and decays were accounted for by dividing the ratio observed in the data by the acceptance ratio predicted by the Monte Carlo. The acceptance correction also took detector resolution effects (smearing) into account by defining the and acceptances as the ratio of the number of simulated events passing the selection cuts in a bin of reconstructed energy and lifetime to the number of generated events in the corresponding bin defined using the true energy and lifetime.
Resolution induced acceptance differences due to the AKS veto requirement are largely eliminated by restricting the lifetime range considered to the region . A small (up to %) residual variation of the acceptance correction remains for events at low energy and lifetime, but the correction for events is otherwise independent of lifetime within the errors due to Monte Carlo statistics. For events, the acceptance ratio is independent of lifetime at lower energies, but falls significantly (by up to %) with increasing lifetime at higher energies. This is not due to an intrinsic difference between the and acceptances, but rather to a slow decrease of the acceptance with increasing radial distance of the decay vertex from the beam axis, convoluted with the larger transverse size of the beam. The fall in acceptance with increasing radius is due dominantly to the geometrical cuts and to the cut on the track momentum asymmetry, and can be reliably modelled and checked by comparing the relevant reconstructed distribution in data and Monte Carlo. Similarly, the modelling of the transverse beam profiles is checked by comparing the reconstructed distributions in data and Monte Carlo.
5 Results
The ratio is computed in two-dimensional bins of energy and lifetime of width GeV and , and corrected bin-by-bin for residual background in the and samples and for small differences in the and acceptances, as described above. For the mode, the ratio is also corrected for - mistagging. Examples of the dependence of the corrected ratio on the reconstructed proper lifetime are shown in Figure 1. The shapes of the separate and lifetime distributions change appreciably with energy, due largely to changes in the lifetime dependences of the and acceptances, but the corrected ratio is approximately independent of energy.


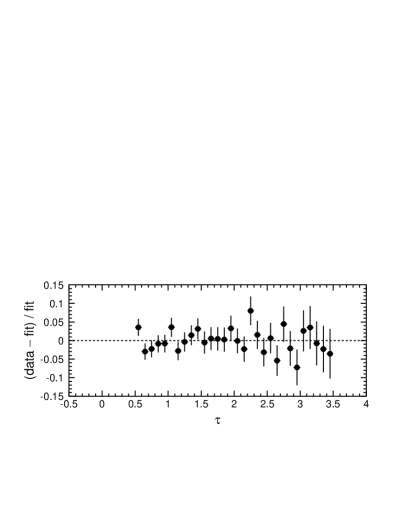

The lifetime is determined by fitting a function of the form given in Equations (1) and (2) to the ratio over the lifetime range and energy range GeV. The following quantity is minimised in the fit:
where is the central energy of the ’th bin of energy, is the central value of the ’th bin of proper lifetime, is the corrected ratio from the data, is the statistical error on , and is the expected ratio. The normalisation parameters are allowed to vary in the fit. At low energies, GeV, the values of the dilutions and appearing in the interference terms in the functions and are fixed using measurements of the dilution by the NA31 experiment [13]. The dilutions and rise from about 0.2 at GeV to about 0.35 at GeV and differ slightly because of the different kaon production angles (4.2 mrad and 2.4 mrad) used to define the and beams; small corrections are applied to the NA31 measurements to account for the different production angles used in this experiment. At high energies, GeV, where the interference term contributes significantly to the ratio , the values of the dilution are allowed to vary in the fit, neglecting the small differences between the and dilutions. The remaining physics parameters appearing in the functions are taken from the PDG averages of existing published measurements, except the lifetime which is a free parameter in the fit.
The fit was carried out separately for the and samples from each year of data taking. The values of the lifetime from each fit are summarised in Table 1. The errors are statistical only and include the contribution from finite Monte Carlo statistics. The minimum value of the fit is also given in Table 1 and corresponds in all cases to an acceptable fit probability. Examples of the fit results and the fit quality for the and data samples from the 1999 run are shown in Figure 1. The effect of the interference terms in the fit function is visible in the plots for the high energy bin as a slight curvature of the lines representing the fit result.
| s | /dof | s | /dof | |
|---|---|---|---|---|
| 1998 | 628.2/573 | 551.0/573 | ||
| 1999 | 601.2/573 | 543.5/573 | ||
Consistent values of the fitted lifetime , and of the fitted normalisation and dilution parameters and , were found for the charged and neutral modes and for the samples from the different years of data taking. The fitted values of the dilution within the energy range GeV were also consistent with the published NA31 measurements.
6 Systematic errors
Various sources of systematic error on the measured lifetime were considered, including uncertainties in the reconstruction of the energy and distance scales for the charged and neutral decay modes, and uncertainties due to the background subtraction, the tagging correction, the Monte Carlo acceptance correction, and the external physics parameters used in the fitting function.
As noted in Section 4.2, the energy and distance scales for reconstructed events are determined largely by the detector geometry, especially of DCH1 and DCH2. The systematic error due to uncertainties in detector geometry was estimated by considering a variation of mm in the longitudinal separation of DCH1 and DCH2 and a variation of m/m in the relative transverse scale of the two chambers. The position of the upstream edge of the decay vertex distribution was found to be consistent within these tolerances with the nominal position of the AKS counter. In addition, the momentum scale for reconstructed tracks was varied by %, as determined from the consistency of the reconstructed invariant mass with the kaon mass, . In each case, the kaon decay reconstruction was redone for all events in the data using the modified track positions or momenta, and the lifetime analysis repeated. The resulting change in the fitted lifetime was taken as the estimate of the corresponding systematic error.
The systematic error due to uncertainties in the reconstruction of events was estimated by varying the energy scale of reconstructed showers by % and by varying the linearity and uniformity of the calorimeter response by modifying the reconstructed shower energy by an amount , where is the radial distance of the shower from the central detector axis. The allowed variation in the neutral energy scale is determined from a comparison of the position of the edge of the decay vertex distribution with the nominal position of the AKS counter. The allowed ranges of the constants , and are determined from studies of , and decays, and of and decays in special runs with beams.
The uncertainty due to the background subtraction was assessed by conservatively assigning a systematic error equal to % of the change in the fitted lifetime when the background subtraction was removed. The systematic error associated with the background subtraction was estimated by varying the extrapolation factor within the range .
| Source | Variation | |||
|---|---|---|---|---|
| DCH1 radial scale | m/m | |||
| DCH1 position | mm | |||
| Momentum scale | ||||
| LKr Energy scale | ||||
| Energy loss () | MeV | |||
| Non-linearity () | GeV-1 | |||
| Non-uniformity () | cm-1 | |||
| LKr radial scale | ||||
| Charged background | % | |||
| Neutral background | ||||
| Collimator scattering | % | |||
| MC: beam posn | mm | |||
| MC: beam posn | mm | |||
| MC: beam halo | % | |||
| MC: non-Gaussian tails | % | |||
| MC: statistics | ||||
| s | ||||
| , | ||||
| , | , | |||
| s-1 | ||||
| Fit method | ||||
| Total systematic error | ||||
| Statistical error | ||||
The and samples contain a small fraction of events arising from the genuine decay of neutral kaons produced by scattering in (dominantly) the final collimator of the beam. In the charged mode, collimator scattered events are largely removed by the cut on and contribute a fraction less than to the sample. This contribution is already included in the charged background estimate described in Section 4.2, and no additional systematic error is warranted. Studies of events with large transverse momentum ( MeV2/) showed that the lifetime distribution of collimator scattered events corresponds approximately to an exponential decay characterised by the , rather than , lifetime, and that their energy distribution is similar to that of unscattered decays. The high events were also used to estimate the fraction, [14], of collimator scattered events in the sample, where no transverse momentum cut is possible. For the mode, the effect of collimator scattering on the lifetime measurement was studied by modifying the fit function to be of the form where is the proper lifetime of the decay relative to the position of the final collimator and is a constant which is adjusted to give the above fraction of collimator scattered events in the sample. This fraction was assumed to be independent of energy. The resulting systematic error was conservatively estimated as % of the change in the lifetime due to inclusion of the collimator scattering component in the fit.
The systematic error associated with uncertainties in the acceptance correction was estimated by varying the assumed vertical position of the and beams in the Monte Carlo within a range mm around their nominal positions. In addition, the sensitivity to the transverse beam profile was studied by switching off the simulation of the beam halo in the Monte Carlo. In each case, the resulting change in the fitted lifetime was taken as the systematic error. The sensitivity of the acceptance correction to the modelling of the detector resolution was assessed by removing the simulation of non-Gaussian tails from the reconstructed photon shower energies, and a systematic error of % of the effect on the fitted lifetime was assigned. The effect of possible non-Gaussian tails in the reconstructed drift chamber hit positions was also studied in the Monte Carlo, but found to have a negligible effect on the fitted lifetime. Finally, the component of the overall statistical error on the fitted lifetime arising from the finite Monte Carlo statistics was extracted, and classified as a separate systematic error.
The external physics parameters , , , , and appearing in the functions were each varied in turn within a range given by the error on the PDG average value. The mistagging fractions and were varied within the uncertainties given in Section 4.3. The value of the dilutions in the energy range GeV was varied by twice the error on the NA31 measurements [13]. The extra factor of two conservatively takes into account uncertainties in correcting the NA31 measurements to the NA48 experiment.
The fitting procedure itself was tested by applying the fit to the generated inclusive energy and lifetime distributions of parent kaons from the Monte Carlo samples. No significant bias was observed on the fitted lifetime, and the statistical precision of the test was assigned as a systematic error.
The systematic errors on the lifetime from each of the above sources for the 1998 and 1999 data combined are summarised in Table 2. For comparison, the effect of the background subtraction is to increase the fitted lifetime for the mode by s, while the acceptance correction from the Monte Carlo changes the lifetime by s and s for the and modes, respectively.
The analyses carried out for each year of data taking and for each decay mode are combined taking into account any correlations between the separate analyses. The total systematic error is obtained by summing the individual errors in quadrature. The measured values of the lifetime for each decay mode and for the two decay modes combined are:
where the first error is statistical and the second systematic.
Various cross-checks were performed to verify the integrity and stability of the result. No significant dependence of the fitted lifetime was found on the lifetime or energy range used in the fit, or on the energy range within which was allowed to vary in the fit. The effect of varying the main selection cuts used in the analysis was also studied, namely the cuts on , , the momentum asymmetry , and the minimum radii of tracks and clusters in DCH1 and the LKr calorimeter. In each case, either no statistically significant variation in the fitted lifetime was found, or the observed variation was found to be within the systematic errors assigned. The stability of the analysis was also tested by dividing the data sample into topologies for which the positive and negative tracks initially curve towards or away from each other in the spectrometer magnetic field; consistent values of the fitted lifetime were found for the two topologies. Similarly, selecting either of the two polarities of the spectrometer magnetic field setting gave consistent results. Other tests involved dividing the data samples according to the primary data-taking periods, the event time within the SPS spill, and the azimuthal orientation of the decay. For the charged mode, separating and decays using the Tagger in place of vertex tagging gave no significant change in the result.
7 Summary
The lifetime has been measured using and decays recorded by the NA48 experiment in 1998 and 1999. The combined result for the and decay modes, s, has a precision better than that of the current PDG average [1] of existing measurements, and lies about 1.7 standard deviations above it.
References
- [1] Particle Data Group, E. Phys. J. C15 (2000) 1-878
- [2] L. Bertanza et al., Z. Phys. C73 (1997) 629-632.
- [3] L. K. Gibbons et al., Phys. Rev. Lett. 70 (1993) 1199-1202.
- [4] B. Schwingenheuer et al., Phys. Rev. Lett. 74 (1995) 4376-4379.
- [5] A. Lai et al., E. Phys. J. C22 (2001) 231-254.
- [6] C. Biino et al., CERN-SL-98-033 (EA) and Proceedings of the EPAC, Stockholm 1998, IoP, 2100-2102 (1999).
-
[7]
D. Béderède et al., Nucl. Inst. Meth. A367 (1995) 88-91;
I. Augustin et al., Nucl. Inst. Meth. A403 (1998) 472-480. -
[8]
G.D. Barr et al., Nucl. Inst. Meth. A370 (1996) 413-424;
B. Hallgren et al., Nucl. Inst. Meth. A419 (1998) 680-685;
G. Unal for the NA48 Collaboration, International Conference on Calorimetry, October 2000, Annecy, France, hep-ex/0012011. - [9] G.D. Barr et al., “The trigger for decays of the NA48 experiment at CERN”, CERN-EP/2001-079 (Nov. 2001), to be published in Nucl. Inst. Meth..
- [10] S. Anvar et al., Nucl. Inst. Meth. A419 (1998) 686-694.
- [11] H. Bergauer et al., Nucl. Inst. Meth. A419 (1998) 623-631.
- [12] GEANT Detector Description and Simulation Tool, CERN Program Library Long Write-up W5013 (1994).
- [13] R. Carosi et al., Phys. Lett. B237 (1990) 303-312.
- [14] The collimator scattering background fraction of determined in ref. [5] refers to decays which have been weighted according to their reconstructed proper lifetime.