START-UP OF THE NEMO 3 EXPERIMENT
The NEMO collaboration is looking to measure neutrinoless double beta decay down to a lower limit of 0.1 eV for the effective neutrino mass. The NEMO 3 detector is now operating in the Fréjus Underground Laboratory. The expected performance and the data of the first runs are presented here.
1 Introduction
The recent discovery of neutrino oscillations is proof that the neutrino is a massive particle. However, the oscillation experiments are only sensitive to the difference in the square of the masses of two eigenstates of the neutrino. One method for measuring the absolute mass scale of neutrinos is through a careful investigation of the end point energy of single beta decay. Another method is through neutrinoless double beta decay() which is the mission of the NEMO 3 detector. This process has not yet been observed to date . The process is the decay of an (A,Z) nucleus to an (A,Z+2) nucleus by simultaneous emission of two electrons without neutrino emission. The non-conservation of lepton number is a signature of physics beyond the Standard Model. Different ways are possible for this decay in the SU(2)L U(1)Y, SU(2)L SU(2)R U(1)Y or supersymmetric models . The simplest one is to have a light neutrino Majorana exchange in the SU(2)L U(1)Y model. In this case, the half-life depends on the effective neutrino mass. In 1989, the NEMO (Neutrinoless Experiment with Molybdenum) CollaborationaaaCEN-Bordeaux-Gradignan, France; CFR-Gif/Yvette, France; CRN-Strasbourg, France; Department of Physics-Jyvaskyla, Finland; FNSPE-Prague, Czesch. Republic; INEEL, Idaho Falls, USA; INR-Kiev, Ukraine; ITEP-Moscow, Russia; JINR-Dubna, Russia; LAL-Orsay, France; LPC-Caen, France; MHC-South Hadley, USA; Saga University, Japan. started a R&D program to build a detector which would be able to study the effective neutrino mass down to about 0.1 eV by looking for the 0 decay process. The NEMO 3 detector is now operating in the Fréjus Underground Laboratory (4800 m.w.e.). A brief description and the expected performance of the detector are presented in this article as well as the first events.
2 The NEMO 3 detector
2.1 Description
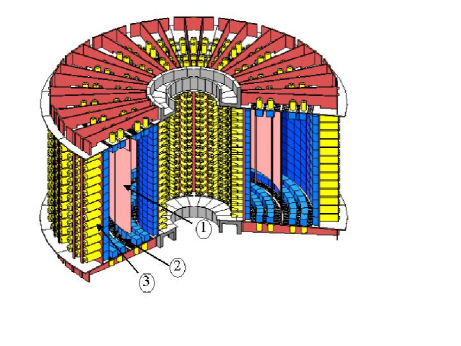
The detector is cylindrical in design and divided into 20 equal sectors (Fig. 1). A thin (40-60 mg/cm2) cylindrical source foil of emitters has been constructed from either a metal film or powder bound by an organic glue to mylar strips. The detector houses up to 10 kg of these isotopes.
The source hangs between two concentric cylindrical tracking volumes consisting of open octagonal drift cells operating in Geiger mode. These cells run vertically and are staged in a 4, 2, and 3 row pattern to optimize track reconstruction. The design of the drift cells calls for 50 m anode and cathode wires to prevent rapid aging. The tracking volume is filled with a mixture of 96% helium + 4% ethanol. The radial and longitudinal resolution are 0.5 mm (1 ) and 1 cm (1 ), respectively. Consequently, the precision of the position of the emission vertex of the two electrons is 0.6 and 1.8 cm in the transverse and longitudinal directions, respectively.
The external walls of these tracking volumes are covered by calorimeters made of large blocks of plastic scintillator coupled to very low radioactivity 3” and 5” Hammamatsu PMTs. The energy resolution depends on the scintillator shape and the associated PMT. It ranges from 11% to 14.5% (FWHM) for 1 MeV electrons. The time resolution is 250 ps (1 ) at 1 MeV. A laser calibration system permits daily checks on the stability of the energy and time calibration parameters. The detector contains 6180 Geiger cells and 1940 scintillators.
Additionally, a solenoid surrounds the detector and produces a field of 30 Gauss to reject pair production events. Finally, external shielding first in the form of 20 cm of low activity iron reduces the gamma ray flux and then 30 cm of water suppresses the flux of neutrons. All the materials used in the detector were selected for their high radiopurity by -ray spectroscopy via Germanium detectors.
The detector is able to identify electrons, positrons, -rays and delayed- particles. This allows the detector to measure the internal contamination of the source by electron-, electron- or electron-- channels and to reject the external background.
2.2 The sources
Several sources were placed in the detector which not only study 0) decay but also measure other process such as the 2) decay, the Majoron decay mode and the external backgrounds. Table 1 summarizes the list of the isotopes with their total mass and decay modes of interest. Note that the 100Mo, 82Se and 116Cd isotopes search for 0) decay, 2) decay to the ground and excited states, and Majoron emission decay 0).
The other enriched isotopes (130Te, 150Nd, 96Zr and 48Ca) were installed to measure the 2) half-life for comparison with the predictions of different nuclear matrix element calculations. Another interest in these sources is to measure the contamination after enrichement, chemical purification and source foil production for future improvements in NEMO 3. For 100Mo, 105 2) events per year will be recorded giving high statistics for the angular distribution between the two emitted electrons and the single electron energy spectrum.
The natural tellurium and copper are very pure, so the events on these sources in the 3 MeV region are only induced by the external -rays flux.
| Isotope | Mass (g) | Intended Studies |
|---|---|---|
| 100Mo | 7200 | 0), 2), 0) |
| 82Se | 1000 | 0), 2), 0) |
| 116Cd | 600 | 0), 2), 0) |
| 130Te | 1300 | 2) |
| 150Nd | 48 | 2) |
| 96Zr | 20 | 2) |
| 48Ca | 10 | 2) |
| natTe | 800 | External background |
| Cu | 600 | External background |
For the 100Mo and 82Se isotopes, the 0) signal is expected to be centered around 3 MeV ( 3.034 and 2.993 MeV, respectively). In this energy region the two electron background can be divided in two components:
- the internal background is produced by the decay of 208Tl (Qβ=4.99 MeV) and 214Bi (Qβ=3.27 MeV) and by the high energy tail of the 2) spectrum given the energy resolution of NEMO 3.
- the external background is produced by interactions of high energy -rays created by radiative capture of neutrons inside the detector or by muons via bremstrahlung.
After chemical or physical purification, the contamination levels of 208Tl and 214Bi were measured by -ray spectroscopy. The contamination levels for the 100Mo and 82Se sources are given in Table 2. Only limits have been obtained for 100Mo. In the case of 82Se, this source was measured in the NEMO 2 detector and the contamination was found to correspond to “hot spots” which can be removed by cuts in the data related to the position of an event’s vertex.
| Isotope | 208Tl | 214Bi |
|---|---|---|
| 100Mo | 0.02 | 0.3 |
| 82Se | 0.4 0.1 | 1.2 0.5 |
2.3 First data with 20 sectors
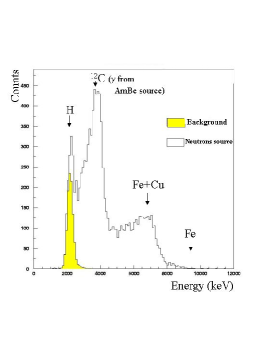
In March of 2002 the data acquisition started without shielding to measure external backgounds and to obtain data with a neutron source. The most sensitive channel to see the effect of neutrons inside the detector is the one-crossing-electron channel corresponding to Compton electrons created in a scintillator and then crossing the detector. This kind of event is distinguished from the two electron events emitted from the source by time-of-flight measurements. Fig. 2 shows the recorded spectrum of crossing electrons with a neutron source and no shielding. The main contribution of -rays comes from radiative captures of neutrons in the copper and iron and the 4.43 MeV -rays emitted by the Am-Be neutron source. The Compton peak at 1.8 MeV corresponds to the 2.2 MeV -rays from neutron capture on hydrogen. The grey region, represents the normalized background for crossing electron events without the neutron source, it will be suppressed by a factor of 100 by a 20 cm iron shield.
3 Prospect and conclusion
The number of background events has been calculated by a Monte-Carlo simulation using the GEANT 3.21 CERN program. The contribution of the internal background is less than 1 event per year for the 100Mo and the 82Se sources in the [2.8-3.2] MeV region. In the case of 82Se, if the “hot spots” are rejected, the internal background is effectively zero events because the 2) half-life is 10 times longer than that for 100Mo. In five years, no events are expected from the external background . Thus, in five years the sensitivity in terms of limits at the 90 % confidence level for the effective neutrino mass is 0.2 - 0.7 eV and 0.6 - 1.2 eV for 7.2 kg of 100Mo and 1 kg of 82Se, respectively. The range in the neutrino mass is due to the uncertainties in the nuclear matrix elements.
Data collection with a full shield (iron + neutron shielding) will start this summer.
References
References
- [1] R. N. Mohapatra and P. B Pal. Massive Neutrinos in Physics and Astrophysics (World scientific, 1997).
- [2] Aalseth C.E et al, hep-ex/0202018
- [3] Ch. Marquet et al, Nucl. Instrum. Methods A 457, 2000 (487-498)
- [4] R. Arnold et al, Nucl. Instrum. Methods A 474, 2001 (93-100)