Measurement of the and energy dependence of diffractive interactions at HERA
DESY-02-029
March 2002
Abstract
Diffractive dissociation of virtual photons, , has been studied in interactions with the ZEUS detector at HERA. The data cover photon virtualities GeV2 and GeV2 with GeV, where is the mass of the hadronic final state. Diffractive events were selected by two methods: the first required the detection of the scattered proton in the ZEUS leading proton spectrometer (LPS); the second was based on the distribution of . The integrated luminosities of the low- and high- samples used in the LPS-based analysis are pb-1 and pb-1, respectively. The sample used for the -based analysis corresponds to an integrated luminosity of pb-1. The dependence of the diffractive cross section on , the virtual photon-proton centre-of-mass energy, and on is studied. In the low- range, the energy dependence is compatible with Regge theory and is used to determine the intercept of the Pomeron trajectory. The dependence of the diffractive cross section exhibits no significant change from the low- to the high- region. In the low- range, little dependence is found, a significantly different behaviour from the rapidly falling cross section measured for GeV2. The ratio of the diffractive to the virtual photon-proton total cross section is studied as a function of and . Comparisons are made with a model based on perturbative QCD.
The ZEUS Collaboration
S. Chekanov,
D. Krakauer,
S. Magill,
B. Musgrave,
A. Pellegrino,
J. Repond,
R. Yoshida
Argonne National Laboratory, Argonne, Illinois 60439-4815 n
M.C.K. Mattingly
Andrews University, Berrien Springs, Michigan 49104-0380
P. Antonioli,
G. Anzivino1,
G. Bari,
M. Basile,
L. Bellagamba,
D. Boscherini,
A. Bruni,
G. Bruni,
G. Cara Romeo,
M. Chiarini,
L. Cifarelli,
F. Cindolo,
A. Contin,
M. Corradi,
S. De Pasquale,
P. Giusti,
G. Iacobucci,
G. Levi,
A. Margotti,
T. Massam,
R. Nania,
C. Nemoz2,
F. Palmonari,
A. Pesci,
G. Sartorelli,
Y. Zamora Garcia3,
A. Zichichi
University and INFN Bologna, Bologna, Italy e
G. Aghuzumtsyan,
D. Bartsch,
I. Brock,
J. Crittenden4,
S. Goers,
H. Hartmann,
E. Hilger,
P. Irrgang,
H.-P. Jakob,
A. Kappes,
U.F. Katz5,
R. Kerger6,
O. Kind,
E. Paul,
J. Rautenberg7,
R. Renner,
H. Schnurbusch,
A. Stifutkin,
J. Tandler,
K.C. Voss,
A. Weber
Physikalisches Institut der Universität Bonn,
Bonn, Germany b
D.S. Bailey8,
N.H. Brook8,
J.E. Cole,
B. Foster,
G.P. Heath,
H.F. Heath,
S. Robins,
E. Rodrigues9,
J. Scott,
R.J. Tapper,
M. Wing
H.H. Wills Physics Laboratory, University of Bristol,
Bristol, United Kingdom m
R. Ayad10,
M. Capua,
L. Iannotti11,
A. Mastroberardino,
M. Schioppa,
G. Susinno
Calabria University,
Physics Department and INFN, Cosenza, Italy e
J.Y. Kim,
Y.K. Kim,
J.H. Lee,
I.T. Lim,
M.Y. Pac12
Chonnam National University, Kwangju, Korea g
A. Caldwell,
M. Helbich,
X. Liu,
B. Mellado,
S. Paganis,
W.B. Schmidke,
F. Sciulli
Nevis Laboratories, Columbia University, Irvington on Hudson,
New York 10027 o
J. Chwastowski,
A. Eskreys,
J. Figiel,
K. Olkiewicz,
M.B. Przybycień13,
P. Stopa,
L. Zawiejski
Institute of Nuclear Physics, Cracow, Poland i
B. Bednarek,
I. Grabowska-Bold,
K. Jeleń,
D. Kisielewska,
A.M. Kowal,
M. Kowal,
T. Kowalski,
B. Mindur,
M. Przybycień,
E. Rulikowska-Zarȩbska,
L. Suszycki,
D. Szuba,
J. Szuba14
Faculty of Physics and Nuclear Techniques,
University of Mining and Metallurgy, Cracow, Poland p
A. Kotański15,
W. Słomiński16
Department of Physics, Jagellonian University, Cracow, Poland
L.A.T. Bauerdick17,
U. Behrens,
K. Borras,
V. Chiochia,
D. Dannheim,
M. Derrick18,
G. Drews,
J. Fourletova,
A. Fox-Murphy, U. Fricke,
A. Geiser,
F. Goebel,
P. Göttlicher19,
O. Gutsche,
T. Haas,
W. Hain,
G.F. Hartner,
S. Hillert,
U. Kötz,
H. Kowalski20,
H. Labes,
D. Lelas,
B. Löhr,
R. Mankel,
M. Martínez17, M. Moritz,
D. Notz,
I.-A. Pellmann,
M.C. Petrucci,
A. Polini,
U. Schneekloth,
F. Selonke21,
B. Surrow22,
H. Wessoleck,
R. Wichmann23,
G. Wolf,
C. Youngman,
W. Zeuner
Deutsches Elektronen-Synchrotron DESY, Hamburg, Germany
A. Lopez-Duran Viani,
A. Meyer,
S. Schlenstedt
DESY Zeuthen, Zeuthen, Germany
G. Barbagli,
E. Gallo,
C. Genta,
P. G. Pelfer
University and INFN, Florence, Italy e
A. Bamberger,
A. Benen,
N. Coppola,
P. Markun,
H. Raach,
S. Wölfle
Fakultät für Physik der Universität Freiburg i.Br.,
Freiburg i.Br., Germany b
M. Bell, P.J. Bussey,
A.T. Doyle,
C. Glasman,
S. Hanlon,
S.W. Lee,
A. Lupi,
G.J. McCance,
D.H. Saxon,
I.O. Skillicorn
Department of Physics and Astronomy, University of Glasgow,
Glasgow, United Kingdom m
I. Gialas
Department of Engineering in Management and Finance, Univ. of
Aegean, Greece
B. Bodmann,
T. Carli,
U. Holm,
K. Klimek,
E. Lohrmann,
M. Milite,
H. Salehi,
S. Stonjek24,
K. Wick,
A. Ziegler,
Ar. Ziegler
Hamburg University, Institute of Exp. Physics, Hamburg,
Germany b
C. Collins-Tooth,
C. Foudas,
R. Gonçalo9,
K.R. Long,
F. Metlica,
D.B. Miller,
A.D. Tapper,
R. Walker
Imperial College London, High Energy Nuclear Physics Group,
London, United Kingdom m
P. Cloth,
D. Filges
Forschungszentrum Jülich, Institut für Kernphysik,
Jülich, Germany
M. Kuze,
K. Nagano,
K. Tokushuku25,
S. Yamada,
Y. Yamazaki
Institute of Particle and Nuclear Studies, KEK,
Tsukuba, Japan f
A.N. Barakbaev,
E.G. Boos,
N.S. Pokrovskiy,
B.O. Zhautykov
Institute of Physics and Technology of Ministry of Education and
Science of Kazakhstan, Almaty, Kazakhstan
H. Lim,
D. Son
Kyungpook National University, Taegu, Korea g
F. Barreiro,
O. González,
L. Labarga,
J. del Peso,
I. Redondo26,
J. Terrón,
M. Vázquez
Departamento de Física Teórica, Universidad Autónoma
Madrid,Madrid, Spain l
M. Barbi,
A. Bertolin,
F. Corriveau,
A. Ochs,
S. Padhi,
D.G. Stairs,
M. St-Laurent
Department of Physics, McGill University,
Montréal, Québec, Canada H3A 2T8 a
T. Tsurugai
Meiji Gakuin University, Faculty of General Education, Yokohama, Japan
A. Antonov,
V. Bashkirov27,
P. Danilov,
B.A. Dolgoshein,
D. Gladkov,
V. Sosnovtsev,
S. Suchkov
Moscow Engineering Physics Institute, Moscow, Russia j
R.K. Dementiev,
P.F. Ermolov,
Yu.A. Golubkov,
I.I. Katkov,
L.A. Khein,
I.A. Korzhavina,
V.A. Kuzmin,
B.B. Levchenko,
O.Yu. Lukina,
A.S. Proskuryakov,
L.M. Shcheglova,
N.N. Vlasov,
S.A. Zotkin
Moscow State University, Institute of Nuclear Physics,
Moscow, Russia k
C. Bokel, J. Engelen,
S. Grijpink,
E. Koffeman,
P. Kooijman,
E. Maddox,
S. Schagen,
E. Tassi,
H. Tiecke,
N. Tuning,
J.J. Velthuis,
L. Wiggers,
E. de Wolf
NIKHEF and University of Amsterdam, Amsterdam, Netherlands h
N. Brümmer,
B. Bylsma,
L.S. Durkin,
J. Gilmore,
C.M. Ginsburg,
C.L. Kim,
T.Y. Ling
Physics Department, Ohio State University,
Columbus, Ohio 43210 n
S. Boogert,
A.M. Cooper-Sarkar,
R.C.E. Devenish,
J. Ferrando,
G. Grzelak,
T. Matsushita,
M. Rigby,
O. Ruske28,
M.R. Sutton,
R. Walczak
Department of Physics, University of Oxford,
Oxford United Kingdom m
R. Brugnera,
R. Carlin,
F. Dal Corso,
S. Dusini,
A. Garfagnini,
S. Limentani,
A. Longhin,
A. Parenti,
M. Posocco,
L. Stanco,
M. Turcato
Dipartimento di Fisica dell’ Università and INFN,
Padova, Italy e
L. Adamczyk29,
E.A. Heaphy,
B.Y. Oh,
P.R.B. Saull29,
J.J. Whitmore30
Department of Physics, Pennsylvania State University,
University Park, Pennsylvania 16802 o
Y. Iga
Polytechnic University, Sagamihara, Japan f
G. D’Agostini,
G. Marini,
A. Nigro
Dipartimento di Fisica, Università ’La Sapienza’ and INFN,
Rome, Italy
C. Cormack,
J.C. Hart,
N.A. McCubbin
Rutherford Appleton Laboratory, Chilton, Didcot, Oxon,
United Kingdom m
E. Barberis31,
C. Heusch,
W. Lockman,
J.T. Rahn,
H.F.-W. Sadrozinski,
A. Seiden,
D.C. Williams
University of California, Santa Cruz, California 95064 n
I.H. Park
Seoul National University, Seoul, Korea
N. Pavel
Fachbereich Physik der Universität-Gesamthochschule
Siegen, Germany
H. Abramowicz,
S. Dagan,
A. Gabareen,
S. Kananov,
A. Kreisel,
A. Levy
Raymond and Beverly Sackler Faculty of Exact Sciences,
School of Physics, Tel-Aviv University,
Tel-Aviv, Israel d
T. Abe,
T. Fusayasu,
T. Kohno,
K. Umemori,
T. Yamashita
Department of Physics, University of Tokyo,
Tokyo, Japan f
R. Hamatsu,
T. Hirose,
M. Inuzuka,
S. Kitamura32,
K. Matsuzawa,
T. Nishimura
Tokyo Metropolitan University, Deptartment of Physics,
Tokyo, Japan f
M. Arneodo33,
N. Cartiglia,
R. Cirio,
M. Costa,
M.I. Ferrero,
L. Lamberti34,
S. Maselli,
V. Monaco,
C. Peroni,
M. Ruspa,
R. Sacchi,
A. Solano,
A. Staiano
Università di Torino, Dipartimento di Fisica Sperimentale
and INFN, Torino, Italy e
R. Galea,
T. Koop,
G.M. Levman,
J.F. Martin,
A. Mirea,
A. Sabetfakhri
Department of Physics, University of Toronto, Toronto, Ontario,
Canada M5S 1A7 a
J.M. Butterworth, C. Gwenlan,
R. Hall-Wilton,
T.W. Jones,
J.B. Lane,
M.S. Lightwood,
J.H. Loizides35,
B.J. West
Physics and Astronomy Department, University College London,
London, United Kingdom m
J. Ciborowski36,
R. Ciesielski37,
R.J. Nowak,
J.M. Pawlak,
B. Smalska38,
J. Sztuk39,
T. Tymieniecka40,
A. Ukleja40,
J. Ukleja,
J.A. Zakrzewski,
A.F. Żarnecki
Warsaw University, Institute of Experimental Physics,
Warsaw, Poland q
M. Adamus,
P. Plucinski
Institute for Nuclear Studies, Warsaw, Poland q
Y. Eisenberg,
L.K. Gladilin41,
D. Hochman,
U. Karshon
Department of Particle Physics, Weizmann Institute, Rehovot,
Israel c
D. Kçira,
S. Lammers,
L. Li,
D.D. Reeder,
A.A. Savin,
W.H. Smith
Department of Physics, University of Wisconsin, Madison,
Wisconsin 53706 n
A. Deshpande,
S. Dhawan,
V.W. Hughes,
P.B. Straub
Department of Physics, Yale University, New Haven, Connecticut
06520-8121 n
S. Bhadra,
C.D. Catterall,
S. Fourletov,
S. Menary,
M. Soares,
J. Standage
Department of Physics, York University, Ontario, Canada M3J
1P3 a
1 now at Università di Perugia, Dipartimento di
Fisica, Perugia, Italy
2 now at E.S.R.F., Grenoble, France
3 now at Inter American Development Bank, Washington DC, USA
4 now at Cornell University, Ithaca, NY, USA
5 on leave of absence at University of
Erlangen-Nürnberg, Germany
6 now at Ministère de la Culture, de L’Enseignement
Supérieur et de la Recherche, Luxembourg
7 supported by the GIF, contract I-523-13.7/97
8 PPARC Advanced fellow
9 supported by the Portuguese Foundation for Science and
Technology (FCT)
10 now at Temple University, Philadelphia, PA, USA
11 now at Consoft Sistemi, Torino, Italy
12 now at Dongshin University, Naju, Korea
13 now at Northwestern Univ., Evanston, IL, USA
14 partly supported by the Israel Science Foundation and
the Israel Ministry of Science
15 supported by the Polish State Committee for Scientific
Research, grant. no. 2P03B 09322
16 member of Dept. of Computer Science, supported by the
Polish State Committee for Sci. Res., grant no. 2P03B 06116
17 now at Fermilab, Batavia, IL, USA
18 on leave from Argonne National Laboratory, USA
19 now at DESY group FEB
20 on leave of absence at Columbia Univ., Nevis Labs.,
N.Y., USA
21 retired
22 now at Brookhaven National Lab., Upton, NY, USA
23 now at Mobilcom AG, Rendsburg-Büdelsdorf, Germany
24 supported by NIKHEF, Amsterdam, NL
25 also at University of Tokyo
26 now at LPNHE Ecole Polytechnique, Paris, France
27 now at Loma Linda University, Loma Linda, CA, USA
28 now at IBM Global Services, Frankfurt/Main, Germany
29 partly supported by Tel Aviv University
30 on leave of absence at The National Science Foundation,
Arlington, VA, USA
31 now at Lawrence Berkeley National Laboratory, Berkeley,
CA, USA
32 present address: Tokyo Metropolitan University of
Health Sciences, Tokyo 116-8551, Japan
33 also at Università del Piemonte Orientale, Novara, Italy
34 now at Università di Torino, Dipartimento di
Medicina Interna, Torino, Italy
35 supported by Argonne National Laboratory, USA
36 also at Łódź University, Poland
37 supported by the Polish State Committee for
Scientific Research, grant no. 2 P03B 07222
38 supported by the Polish State Committee for
Scientific Research, grant no. 2 P03B 00219
39 Łódź University, Poland
40 sup. by Pol. State Com. for Scien. Res., 5 P03B 09820
and by Germ. Fed. Min. for Edu. and Research (BMBF), POL 01/043
41 on leave from MSU, partly supported by
University of Wisconsin via the U.S.-Israel BSF
| a | supported by the Natural Sciences and Engineering Research Council of Canada (NSERC) |
|---|---|
| b | supported by the German Federal Ministry for Education and Research (BMBF), under contract numbers HZ1GUA 2, HZ1GUB 0, HZ1PDA 5, HZ1VFA 5 |
| c | supported by the MINERVA Gesellschaft für Forschung GmbH, the Israel Science Foundation, the U.S.-Israel Binational Science Foundation, the Israel Ministry of Science and the Benozyio Center for High Energy Physics |
| d | supported by the German-Israeli Foundation, the Israel Science Foundation, and by the Israel Ministry of Science |
| e | supported by the Italian National Institute for Nuclear Physics (INFN) |
| f | supported by the Japanese Ministry of Education, Science and Culture (the Monbusho) and its grants for Scientific Research |
| g | supported by the Korean Ministry of Education and Korea Science and Engineering Foundation |
| h | supported by the Netherlands Foundation for Research on Matter (FOM) |
| i | supported by the Polish State Committee for Scientific Research, grant no. 620/E-77/SPUB-M/DESY/P-03/DZ 247/2000-2002 |
| j | partially supported by the German Federal Ministry for Education and Research (BMBF) |
| k | supported by the Fund for Fundamental Research of Russian Ministry for Science and Education and by the German Federal Ministry for Education and Research (BMBF) |
| l | supported by the Spanish Ministry of Education and Science through funds provided by CICYT |
| m | supported by the Particle Physics and Astronomy Research Council, UK |
| n | supported by the US Department of Energy |
| o | supported by the US National Science Foundation |
| p | supported by the Polish State Committee for Scientific Research, grant no. 112/E-356/SPUB-M/DESY/P-03/DZ 301/2000-2002, 2 P03B 13922 |
| q | supported by the Polish State Committee for Scientific Research, grant no. 115/E-343/SPUB-M/DESY/P-03/DZ 121/2001-2002, 2 P03B 07022 |
1 Introduction
The properties of high-energy hadron-hadron cross sections, notably the energy dependence of the total and elastic cross sections, are described successfully by Regge phenomenology in terms of the exchange of the Pomeron trajectory, , where is the squared four-momentum carried by the exchange [1]. The intercept and slope of the trajectory were found to be and GeV-2, respectively, by Donnachie and Landshoff [2] using the energy dependence of the hadron-hadron total and elastic cross sections. Such a Pomeron trajectory is referred to as “the soft Pomeron”. At high energies, hadron-hadron total cross sections, including the total cross section, can be expressed in terms of this trajectory as
where is the virtual photon-proton centre-of-mass energy.
Measurements of the diffractive dissociation of photons have shown that, for quasi-real photons (, photoproduction, where is the exchanged photon virtuality), the value of is compatible with the expectations based on soft-Pomeron exchange [3, 4]. The study of diffractive processes in collisions at large virtualities has opened up the possibility of investigating the Pomeron in a regime where perturbative QCD (pQCD) is applicable [5]. In this regime, the exchange of the Pomeron trajectory may be described, at lowest order, as two-gluon exchange in the channel so that the cross section is proportional to the square of the gluon density in the proton. Since the gluon distribution rises steeply at small Bjorken (or, equivalently, for large values of ), a possible signature of the transition from the soft non-perturbative regime to the hard perturbative regime is a change to a -dependence of the cross section steeper than that from the exchange of a soft-Pomeron trajectory. The value of the Pomeron intercept, , measured in the deep inelastic scattering (DIS) regime ( a few GeV2) is larger than that of the soft Pomeron [6, 7], which suggests that pQCD effects have become important.
In analogy with the usual DIS formalism for the proton structure function, , one can introduce a diffractive structure function, . Studies of photon diffractive-dissociation have shown that, for GeV2, has only a weak, logarithmic, dependence on [6, 7]. However, conservation of the electromagnetic current requires that both and must behave like as .
In this paper, the inclusive diffractive dissociation of virtual photons, , is investigated by studying the reaction at HERA both in the perturbative region ( GeV2) and in the transition region between the non-perturbative () and perturbative regions. The measurements are presented as a function of and . The Pomeron intercept is determined through the measurement of the energy dependence of the diffractive cross section in the transition region, which has not previously been explored in diffraction. The and behaviour of the diffractive cross section and of the virtual photon-proton total cross section, , are compared by studying their ratio as a function of and .
Diffractive events were selected by two methods. The first required the detection of the scattered proton in the ZEUS leading proton spectrometer (LPS) and is referred to as the “LPS method”. Although statistically limited because of the small acceptance of the LPS, this method permits the selection of events with negligible background from the double-dissociative reaction, , where the proton also diffractively dissociates into a state of mass that escapes undetected in the beam pipe. The LPS method also gives access to higher values of , the mass of the hadronic final-state system, , and allows the measurement of the squared four-momentum transfer at the proton vertex, . The second method, henceforth referred to as the “ method” [7], is based on the characteristics of the distribution of . The sample selected with the method contains a background contribution from the double-dissociative events.
This paper presents results in the region GeV2, obtained with both methods, and in the region GeV2 using only the LPS. The measurements cover the region GeV. Results in the DIS region obtained using the method have been previously reported [7].
2 Kinematic variables and cross sections
Inclusive diffractive dissociation of virtual photons in positron-proton collisions, , can be described by the kinematic variables , , , and . The differential cross section for is related to the cross section for the reaction by [8]
| (1) |
where
is the virtual photon flux, is the fine-structure constant, is the fraction of the positron energy transferred to the proton in its rest frame, and is the square of the positron-proton centre-of-mass energy.
In analogy with the formalism of inclusive deep inelastic scattering, the diffractive cross section for the reaction can also be expressed in terms of diffractive structure functions [9]:
| (2) |
where the diffractive structure function and the ratio of the cross sections for longitudinal and transverse photons, , have been introduced.
The variables and are related to , , and by
where is the proton mass. The variables and can be interpreted, assuming the -channel exchange of a Pomeron with partonic structure, as the fraction of the proton momentum carried by the Pomeron and the fraction of the Pomeron momentum carried by the struck parton, respectively.
Equations (1) and (2) can be combined to give
| (3) |
where has been assumed and and have been neglected [10]. An analogous expression holds for the three-fold differential diffractive structure function, , obtained by integrating over . Equation (3) is the diffractive analogue of the expression which holds for inclusive scattering at high .
3 Experimental set-up
The measurements were performed at the HERA collider at DESY between 1995 and 1997 using the ZEUS detector. At that time, HERA operated at a proton energy of 820 GeV and a positron energy of 27.5 GeV.
A detailed description of the ZEUS detector can be found elsewhere [11]. A brief outline of the components most relevant for this analysis is given below.
Charged particles are tracked by the central tracking detector (CTD) [12], which operates in a magnetic field of 1.43 T provided by a thin superconducting coil. The CTD consists of 72 cylindrical drift-chamber layers, organised in 9 superlayers covering the polar-angle111 The ZEUS coordinate system is a right-handed Cartesian system, with the axis pointing in the proton-beam direction, referred to as the “forward direction”, and the axis pointing left towards the centre of HERA. The coordinate origin is at the nominal interaction point. The pseudorapidity is defined as , where the polar angle, , is measured with respect to the proton-beam direction. region . The relative transverse-momentum resolution for full-length tracks is , with in GeV.
The high-resolution uranium-scintillator calorimeter (CAL) [13] consists of three parts: the forward (FCAL), the barrel (BCAL) and the rear (RCAL) calorimeters. Each part is subdivided transversely into towers and longitudinally into one electromagnetic section (EMC) and either one (in RCAL) or two (in FCAL and BCAL) hadronic sections (HAC). The smallest subdivision of the calorimeter is called a cell. The CAL relative energy resolutions, as measured under test-beam conditions, are for electrons and for hadrons ( in GeV).
Low- events ( GeV2) were tagged by requiring the identification of the scattered positron in the beam pipe calorimeter (BPC) [14, 15]. The BPC was a tungsten-scintillator sampling calorimeter, located close to the beam pipe, 3 m downstream of the interaction point in the positron-beam direction. The relative energy resolution from test-beam results was ( in GeV). Each scintillator layer consisted of 8 mm-wide strips. Using the logarithmically weighted shower position, the impact position of the scattered positron could be measured with an accuracy of about 1 mm. For events with GeV2, the impact point of the scattered positron was determined with the small-angle rear tracking detector (SRTD) [16] or the CAL. The SRTD is attached to the front face of the RCAL and consists of two planes of scintillator strips, 1 cm wide and 0.5 cm thick, arranged in orthogonal orientations and read out via optical fibres and photomultiplier tubes. It covers a region of about cm2 in and , excluding a cm2 hole at the centre for the beam pipe.
The LPS [17] detected positively charged particles scattered at small angles and carrying a substantial fraction, , of the incoming proton momentum; these particles remain in the beam pipe and their trajectory was measured by a system of silicon microstrip detectors that can be inserted very close (typically a few mm) to the proton beam. The detectors were grouped in six stations, S1 to S6, placed along the beam line in the direction of the proton beam, between m and 90.0 m from the interaction point. The track deflections induced by the magnets of the proton beam-line allow a momentum analysis of the scattered proton. For the present measurements, only stations S4, S5 and S6 were used. The resolutions were better than 1% on the longitudinal momentum and 5 MeV on the transverse momentum. The effective transverse-momentum resolution is, however, dominated by the intrinsic transverse-momentum spread of the proton beam at the interaction point, which is about 40 MeV in the horizontal plane and about 100 MeV in the vertical plane.
4 Reconstruction of the kinematic variables
Different methods have been used for the reconstruction of the kinematic variables and , depending on the range of the measurement. At low , GeV2 (hereafter referred to as the “BPC region”), the energy, , and angle, , of the scattered positron measured in the BPC were used (“electron method”) to determine the kinematic variables from
where and represent the proton and positron beam energies, respectively. For GeV2 (the “DIS region”), and were reconstructed with the double angle method [18] using the energy depositions in the CAL.
For the reconstruction of the mass of the diffractive system , the energy deposits in the CAL and the track momenta measured in the CTD were clustered to form energy-flow objects (EFOs) [7, 19]. The EFOs thus include the information from both neutral and charged particles in an optimal way. The mass, , was then obtained from the EFOs via
where the subscript denotes an individual EFO; the EFOs associated with the scattered positron are excluded from the sums.
The momentum of those scattered protons detected in the LPS, , was measured, along with its component perpendicular (parallel) to the beam direction, (). From these quantities, the fractional momentum of the scattered proton, , and were determined via
Two quantities, and , the sum of over all final-state particles in the event, were used in the event selection. The former was reconstructed either using the electron method (and denoted by ) or from the EFOs using the Jacquet-Blondel estimator [20] as
where the sum is over all EFOs, excluding those assigned to the scattered positron. Energy and momentum conservation require to be twice the positron beam energy for a completely measured final state and neglecting resolution effects.
5 Monte Carlo simulation
Monte Carlo (MC) generators were used to determine the acceptance of the apparatus. The reaction was simulated in the BPC region with the EPSOFT2.0 [7, 21, 22] MC generator interfaced to HERACLES4.6 [23], which simulates initial- and final-state QED radiation. For the description of the diffractive dissociation of virtual photons, , EPSOFT uses the triple-Regge formalism [1], in which the inclusive diffractive cross section can be expressed in terms of three trajectories. If all the trajectories are Pomerons (), the cross-section is approximately proportional to . If one of the trajectories is a Reggeon (), the cross-section falls as . EPSOFT also simulates exclusive vector-meson production, , where , or , and non-diffractive interactions, . Production of mesons has negligible effects on the acceptance and was not considered. EPSOFT was also used to simulate the double-dissociative reaction, , where the proton diffractively dissociates into the state .
The second generator, used for the DIS region, was RAPGAP2.06 [24], where, for the diffractive structure function, a factorisable expression was assumed based on the model of Ingelman and Schlein [25]. In particular, a superposition of non-interfering Pomeron and sub-leading trajectories was used (“fit B”, as determined by the H1 Collaboration [6]) together with the “fit 3” Pomeron parton density functions [6]. Again, initial- and final-state QED radiation were simulated using HERACLES.
All generated events were passed through the standard ZEUS detector simulation, based on the GEANT3.13 program [26], and the trigger-simulation package.
6 Identification of the scattered positron
For the BPC sample, the events were selected in the trigger by requiring the presence of a scattered positron in the BPC. A positron with energy greater than 7 GeV was required in the offline analysis [14, 15]. The following cuts were applied to reduce the contamination from photoproduction events, radiative events, and beam-related background:
-
•
;
-
•
GeV;
-
•
cm, where is the coordinate of the reconstructed vertex.
For the DIS sample, the events used for the analysis were selected in the trigger by requiring the presence of a scattered positron in the CAL. Offline, a positron in the RCAL with energy greater than 10 GeV was required. A positron finder based on a neural-network was used [27]. The following cuts were applied to reduce the contamination from photoproduction events, radiative events, and beam-related background:
-
•
;
-
•
;
-
•
GeV;
-
•
cm.
7 The LPS method
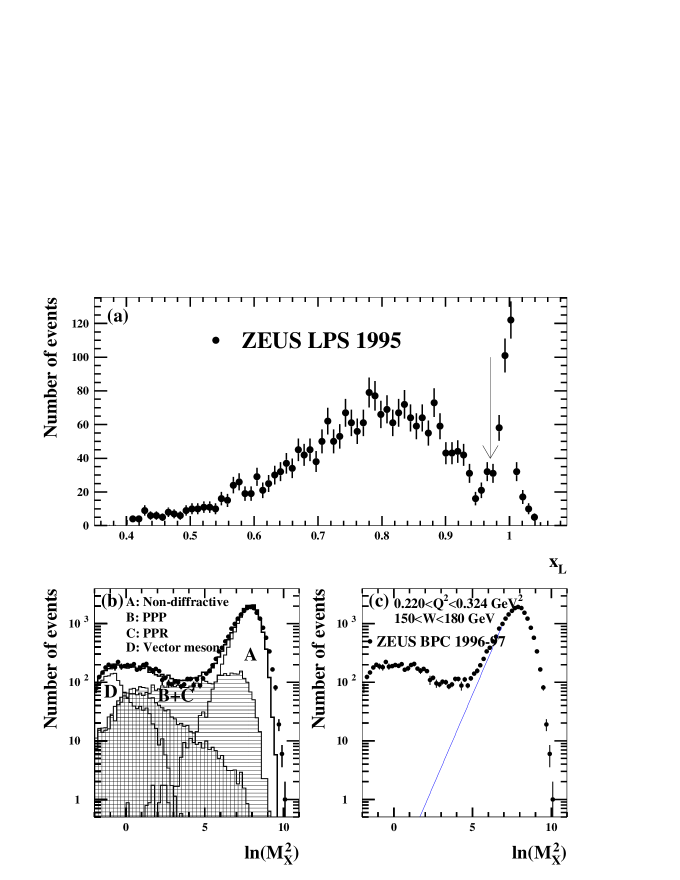
Diffractive events are characterised by a final state proton scattered at very small angle and with energy nearly equal to that of the incoming proton. In the LPS method, diffractive events are then defined as those having a proton detected in the LPS with . Figure 1(a) shows the measured spectrum, uncorrected for acceptance. The diffractive peak is clearly visible for values of close to unity. For the present analysis, was required. Previous studies [28] indicate that the double-dissociative contribution to such events is negligible.
Two data samples, collected in 1995, were analysed with the LPS method. The BPC sample, corresponding to a luminosity of pb-1, covers the range GeV2 and GeV. The DIS sample covers the region GeV2 and GeV, and corresponds to a luminosity of pb-1. The analysis was limited to the range GeV for the BPC sample and GeV for the DIS sample.
The candidate proton was tracked along the proton beam line and was rejected if, at any point, the reconstructed minimum distance of approach to the beam pipe, , was less than m or if the distance to the edge of the sensitive region of any LPS station, , was smaller than m. These cuts reduce the sensitivity of the acceptance to the uncertainty in the position of the beam-pipe apertures and of the detector edges. In addition, was required to be in the region GeV2, where the LPS acceptance is well understood [17]. Beam-halo background results from a scattered proton, with energy close to that of the beam, originating from an interaction of a beam proton with the residual gas or with the beam collimators. In this case, the proton measured in the LPS is uncorrelated with the activity in the central ZEUS detector. This background was suppressed by the requirement that the sum of the energy and the longitudinal component of the total momentum measured in the CAL, the BPC and the LPS be less than the kinematic limit of : GeV. This cut takes into account the resolution of the measurement of . A residual beam-halo background of approximately 8%, remaining after the cut, was subtracted statistically.
In the BPC analysis, the measured number of diffractive events was corrected bin-by-bin. From this acceptance-corrected number of events, the cross section for the diffractive dissociation of virtual photons, , was determined taking into account the integrated luminosity, bin widths, and bin-centring corrections.
In the DIS analysis, the cross section for the diffractive dissociation of virtual photons at a given point within a bin was obtained from the ratio of the measured number of diffractive events to the number of events in that bin predicted from the MC simulation, multiplied by the cross section calculated at that point by the Monte Carlo generator. Both the acceptance and the bin-centring corrections were thus taken from the MC simulation.
In both the BPC and DIS analyses, the diffractive cross-section was directly measured only in the region GeV2 and extrapolated to the full range using the dependence assumed in the Monte Carlo generator. In the region covered by the present measurements, this is roughly equivalent to carrying out an integration over assuming an exponential dependence on , , with GeV-2.
8 The method
Diffractive photon dissociation, , is characterised by the exchange of a colourless object, the Pomeron, between the virtual photon and the proton. This suppresses QCD radiation, and hence the production of hadrons, in the rapidity region between the hadronic system and the scattered proton, yielding a forward rapidity gap, a characteristic feature of diffractive interactions. This feature is reflected in the dependence of the cross section on , , i.e. approximately flat as a function of . In contrast, for non-diffractive events, large rapidity gaps are exponentially suppressed by QCD radiation, which populates the region between the struck quark and the coloured proton remnant. In this case, under the assumption of uniform, random and uncorrelated particle emission in rapidity, the distribution falls exponentially towards low values. The different properties of the distribution for diffractive and non-diffractive events are exploited in the method [7].
The method was used to analyse BPC data taken in 1996-97, corresponding to an integrated luminosity of pb-1. The kinematic range used was GeV2, GeV and GeV.
8.1 Selection of the diffractive signal
Figure 1(b) shows a representative distribution of for data222The data shown in Figs. 1(b,c) result from the cuts discussed in Section 8.2. in the bin GeV2 and GeV, compared to the distribution of the simulated events generated with EPSOFT. Also shown are the four individual contributions generated with EPSOFT for non-diffractive events, for the and contributions (shown combined in the figure), which lead to the diffractive dissociation of the photon, and for vector-meson production. Diffractive events dominate the region of low , while non-diffractive events exhibit a large peak at high and a steep exponential fall-off towards lower values. The relative weights of the four subprocesses are obtained from fits to the distribution of the data. The resulting sum of the MC events (open histogram) from the various subprocesses provides a reasonably good description of the data in the region of interest, .
In the region , the diffractive contribution to the events in Fig. 1(b) depends only weakly on . The expression
| (4) |
was therefore fitted to the data and the parameters , and were determined for each (,) region. The exponential term (with ), ascribed to non-diffractive events, was subtracted statistically to obtain the diffractive contribution. The parameter was thus not used directly to determine the diffractive cross section. The exponential term resulting from the fit to the data of Fig. 1(b) is shown in Fig. 1(c).
The cross-section measurement was restricted to the range , corresponding to GeV. The lower limit on suppresses the contribution from diffractive vector-meson production, while the upper bound was chosen such that the non-diffractive contribution to the higher- bins was always less than 50%.
8.2 Proton-dissociative contribution
The diffractive sample of events selected with the method as discussed in Section 8.1 contains a contribution from the double-dissociative reaction . The system escapes undetected through the forward beam pipe, unless the proton dissociates into a state of sufficiently high mass, in which case some of the particles from the system have transverse momenta large enough that they are detected in the FCAL region around the forward beam pipe. The contribution of the double-dissociative reaction was simulated and studied with EPSOFT.
Energy deposits in the FCAL, arising from the proton-dissociative remnant, give rise to a measured value of considerably higher than the true value. In such events, there is a gap in rapidity between the FCAL deposits from the proton remnant at high and the system at lower , and the invariant mass of the low- system is small with respect to the measured (apparent) . Exploiting these features, events were rejected if they fulfilled all of the following three conditions:
-
•
the maximum () of the EFOs was greater than 2.5;
-
•
the maximum rapidity gap between adjacent EFOs was greater than 3.5;
-
•
the mass reconstructed from EFOs with was less than .
These cuts rejected approximately 10% of the data sample. The simulations using the EPSOFT MC program indicate that about 45% of these rejected events are from the double-dissociative reaction, , and the events that survive the cuts consist of photon-dissociative events as well as events from the double-dissociative reaction with GeV.
The measured number of events in each bin was corrected for acceptance to determine the number of produced events by means of the Singular Value Decomposition (SVD) method [29], which allows the evaluation of error correlations between adjacent bins. The number of events thus obtained was divided by the luminosity and the bin-widths to evaluate the average three-fold differential cross section for each (, , ) bin. From this, the cross section was obtained using Eq. (1), integrated over and evaluated at the logarithmic centre of the bin. The residual double-dissociative contribution in the data leads to an overestimation of the cross section for the diffractive dissociation of virtual photons, ; it was evaluated using the LPS data and subtracted as discussed in Section 10.
9 Systematic uncertainties
The main sources of systematic uncertainty can be classified into three groups: the positron measurement in the BPC or the CAL; the measurement of the hadronic final state in the CAL; and the measurement of the scattered proton in the LPS:
-
•
measurement of the scattered positron:
-
–
for the BPC samples, the effects of the uncertainty in the absolute BPC energy scale [15] (%), the positron-selection criteria and the alignment of the BPC result in an uncertainty in the cross section that is typically 7% and always smaller than 20%;
-
–
for the DIS sample, the 10 GeV cut on the scattered-positron energy was changed by GeV [28]. The parameters of the neural-network positron finder were modified. To check the acceptance at low , which is determined by the positron position in the SRTD, the fiducial region around the impact point of the positron was changed. The resulting systematic uncertainty is typically 7% and always smaller than 25%.
-
–
-
•
for the determination of the uncertainties related to the hadronic final state for the method, the effect of the uncertainty in the CAL energy scale (%) was studied and the parameters in the algorithm that forms EFOs were varied. The non-diffractive slope ( in Eq. (4)) was varied between 1.42 and 1.46. It was checked that a different choice for the functional form of the diffractive contribution in Eq. (4) does not significantly affect the final number of diffractive events. The resulting uncertainty is typically 8% and always smaller than 12%;
-
•
the systematic uncertainties in the measurement of the scattered proton in the LPS were estimated as follows:
-
–
to estimate the sensitivity of the LPS acceptance to the uncertainties in the positions of the beam-line apertures, the lower limits on the distance of closest approach to any of the beam-line elements and to the edge of the sensitive region of each detector were raised from 400 m to 1000 m and from 200m to 300 m, respectively;
-
–
the window was varied by ;
-
–
the uncertainty in the subtraction of the beam-halo events was estimated by removing the cut.
The resulting systematic uncertainty arising from the LPS measurement is typically 10% and always smaller than .
-
–
In addition, the , and dependences in EPSOFT and RAPGAP were varied within the limits allowed by the data, yielding changes in the cross section negligible with respect to all other uncertainties. The relative fraction of vector meson production in EPSOFT was varied by up to , again with negligible effects on the results.
All the above contributions were summed in quadrature to give the final systematic uncertainties. The normalisation uncertainty due to the luminosity determination is 1% for the 1995 data and 1.5% for the 1996-97 data and was not included in the sum.
The value of was assumed to be zero throughout the analysis. Given the absence of experimental information on , no attempt was made to quantify the systematic uncertainty entailed by this assumption.
10 Cross-section measurements and comparison of the and LPS methods
The values of and extracted with the LPS method are given in Tables 1 and 2, respectively. The results obtained with the method are presented in Table 3. All results are corrected to the Born level.
As discussed in Section 8.2, the sample from the method contains a double-dissociative contribution. Since the sample selected with the LPS method has a negligible proton-dissociative background [28], the contamination in the BPC sample was estimated by directly comparing the results from the two analysis methods.
To achieve this, the ratio, , of the average cross section measured with the method and that measured with the LPS method was determined in a single kinematic region corresponding to the bins given in Table 3. The value obtained, (stat.), is attributed to a substantial contribution from the double-dissociative reaction to the cross section measured with the method. In terms of the ratio of the number of double-dissociative events to the total number of events in the sample, , the estimated value of corresponds to . This is consistent with a previous estimate at higher of )% [7].
The results obtained with the method presented in this paper were corrected for the residual double-dissociative background using the measured value of . The correction was assumed to be independent of and , in agreement with the hypothesis of vertex factorisation [30]. The values of extracted with the method for each (, , ) bin are given in Table 3. The subtraction of the double-dissociative background entails a 21% uncertainty in the normalisation of the cross sections obtained with the method.
11 Results and discussion on the dependence of the diffractive and total cross sections
The energy dependence of the photon-dissociative cross sections can be successfully described by a power of , both for photoproduction [3, 4] and for DIS [6, 7] – at least in the region of small values where the exchange of subleading Regge trajectories can be neglected. Although the experimental uncertainties are large, the value of this power is different for the two regimes. This is analogous to the behaviour observed for the dependence of the virtual photon-proton total cross section, [15, 31]: the slow rise of at high observed in photoproduction becomes faster at high ; the transition takes place for GeV2. In this section, the dependence of the photon-dissociative cross section, , is studied in this transition region and is compared to the dependence of by considering the ratio of to .
11.1 The dependence of the diffractive cross section
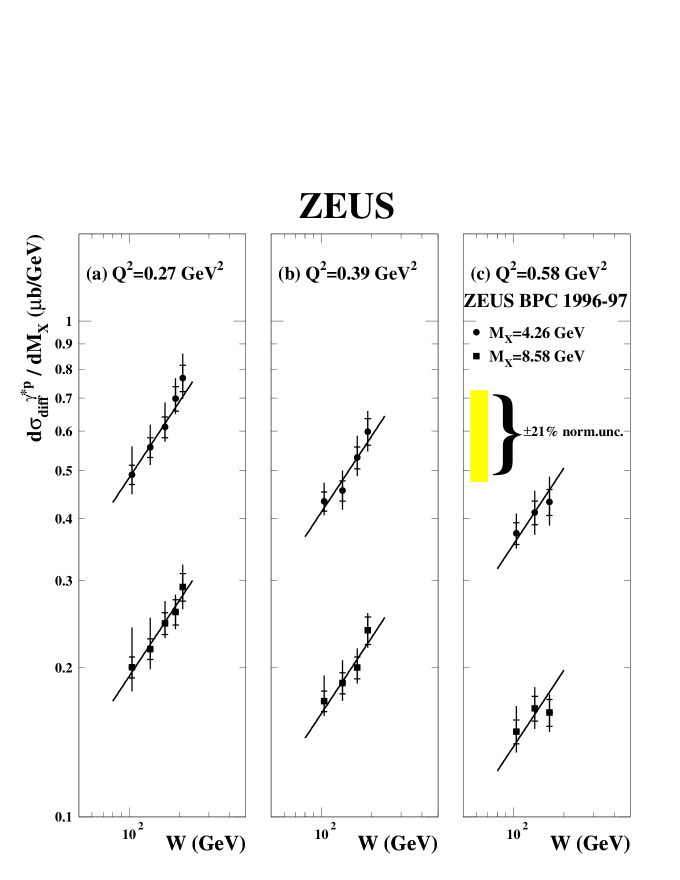
Figure 2 shows the values of the diffractive cross sections extracted with the method in the BPC region as a function of for three and two bins. The form
| (5) |
was fitted to these data, where is a global parameter and the normalisation parameters were left free to vary for each (,) bin. The results of the fit, taking into account the correlations between adjacent bins, are shown in Fig. 2; they give a good description of the data (, calculated using the statistical uncertainties only). The fitted value of the power of is
Expressing the dependence of the cross section in terms of an effective Pomeron intercept [1], , as
the fitted value of corresponds to
This value of can, in turn, be related to the Pomeron intercept, , via
where is the mean value of . The value of , obtained assuming GeV-2 and using GeV2 [28, 32], is ; it is shown in Fig. 3 together with the values determined from photoproduction and from higher- measurements [3, 4, 6, 7]. The quoted systematic uncertainty does not include the uncertainty on , which was also not included in the other results presented in Fig. 3. The value of from the present measurement at low does not differ significantly from the values at higher .
Equation (5) was also fitted to the data allowing different values for the parameter in the three bins of the measurement; the three resulting values of are compatible with the global value. The data used in the fit have values of typically much smaller than 0.01, with the exception of the bin with lowest and highest values, which receives contributions from values up to . It was assumed that Pomeron exchange dominates in this region, and no attempt was made to include secondary Reggeon exchange in the fit. Finally, it should be noted that a possible dependence of the double-dissociative fraction would affect the extracted value of .
Figure 3 also shows as obtained from the ALLM97 parameterisation [33] of the total cross section, which gives a good representation of the inclusive data for the entire range. The value of from ALLM97 is consistent with the present determination from the diffractive data in the BPC region, whereas in the DIS region it is higher than the H1 and ZEUS diffractive measurements [6, 7].
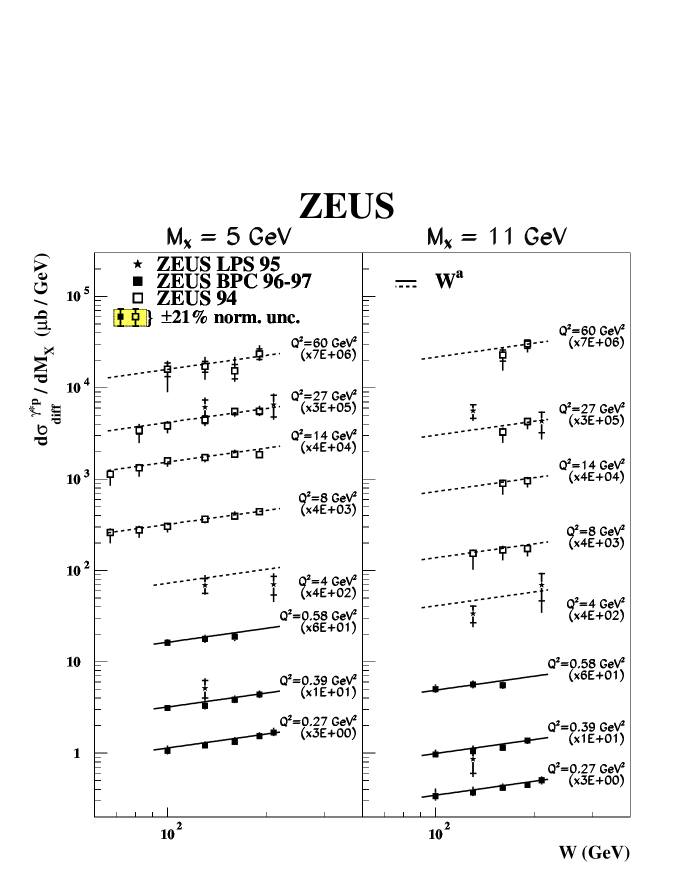
The LPS cross sections are presented in Fig. 4; they are in agreement with the previous ZEUS measurements at large and with the present BPC data obtained with the method. The previous ZEUS data [7] obtained by the method have also been corrected for the residual double-dissociative background using the value of given in Section 10; to make a direct comparison with the earlier data, the BPC cross sections from Table 3 have been interpolated to and 11 GeV using bin-centring corrections based on EPSOFT. The solid lines in Fig. 4 correspond to the fit of Eq. (5) to the BPC data alone, which also provides a good description of the DIS data (dashed lines). Figures 3 and 4 thus show that the dependence of the inclusive diffractive cross section exhibits no significant changes from the BPC to the DIS region.
11.2 Comparison of the dependence of the diffractive and the total cross sections
The dependences of the diffractive and total cross sections were directly compared by studying their ratio
This ratio is plotted as a function of in Fig. 5, where the values of the diffractive cross sections shown in Fig. 4 were divided by the corresponding values of the total cross section, [15, 34]. The lines denote the fit shown in Fig. 4 divided by the corresponding values of the ALLM97 parameterisation for . The lines give a good representation of all the data. While there is a clear increase in as a function of for GeV2, for higher the distribution is flat in .
The form was fitted to the BPC data measured with the method; here, is a global parameter and the normalisation parameters, , were left free to vary for each () bin. The fit gives a good description (not shown) of the data with , where the uncertainty is derived from the fit, consistent with the expectation [7] from Regge theory that
This result suggests a different behaviour from that found in the DIS region, where the value [7] indicates that the diffractive and inclusive cross sections have the same dependence, contrary to the expectations of Regge theory.
In summary, in the BPC region the dependence of the diffractive cross section is compatible with that expected from Regge phenomenology. The ratio between diffractive and total cross sections grows with at a rate consistent with Regge theory. This is in contrast to the DIS region, where the expectations of Regge theory for the ratio of diffractive and total cross sections are not fulfilled, since the ratio is flat as a function of . This difference in the dependence of the ratio is reflected in the fact that the values of extracted from the diffractive cross section and from are similar in the BPC region, but not in the DIS region.
12 Results and discussion on the dependence of diffractive and total cross sections
The dependence of has been observed to change around GeV2 [15]: compared to the approximate scaling behaviour found at high , data at GeV2 exhibit a weaker dependence, with being nearly independent of at the lowest values measured. This is consistent with the expectation from the conservation of the electromagnetic current that approaches a constant or, equivalently, that vanishes like as .
In this section, the dependence of the diffractive cross section, , is studied and the question is addressed of whether and where a transition similar to that observed for occurs for the diffractive dissociation of virtual photons.
12.1 The dependence of the diffractive cross section
Figure 6 shows the diffractive cross sections, , as a function of in bins of and . The present measurements are plotted together with previous ZEUS results [7], obtained with the method in the DIS region, and H1 results [35], obtained with the rapidity-gap method in photoproduction for 1.6 GeV and GeV2; bin-centring corrections based on EPSOFT, analogous to those described in Section 11.1, were applied, where necessary, to both ZEUS and H1 results. No further corrections were applied to the H1 data; notably, no attempt was made to correct for the double-dissociative background.
In Fig. 6, a change in the dependence of as increases is apparent and is similar to that observed in the data: at low , the data do not exhibit a strong dependence, while at larger , the cross section falls rapidly for increasing . Figure 7 shows as a function of for fixed and ; while at large the data do not exhibit a strong dependence, falls by a factor of about ten between GeV2 and GeV2.
12.2 Discussion
The diffractive dissociation of the virtual photon can be described by perturbative QCD (pQCD) since the photon’s virtuality, , provides a hard scale. In particular, in the proton rest frame, the reaction can be viewed as a sequence of three successive processes [5, 36]: the photon fluctuates into a (or ) state, the dipole scatters off the proton target and, finally, the scattered pair produces the final state. At high centre-of-mass energies of the system, these processes are widely separated in time. The fluctuation is described in terms of the photon wave-function derived from QCD. The interaction of the dipole with the proton is mediated, in lowest order, by the exchange of two gluons in a colour-singlet state.
The present results have been compared to the model of Bartels et al. (BEKW) [37]. In this model, neglecting the contribution of longitudinally polarised photons, the dominant (leading-twist) contributions to the diffractive structure function in the kinematic domain of the present measurement come from the fluctuations of the photon into either a pair () or a state (). The spectra of these two components are determined by rather general properties of the photon wave-function: behaves like and like , where = 3.9 [7, 37]. At large , production dominates over production, while, at small , production becomes dominant. has no dependence; is of order and has a logarithmic dependence of the type , where the scale parameter is taken to be 1 GeV2. The model does not fix the dependence of and , but assumes for both a power-like behaviour , where the exponent is determined from fits to the data.
A comparison of the BEKW parameterisation with the present data is shown in Figs. 6 and 7. The values of the parameters, including the normalisation of the and components, were taken from a fit to the previous ZEUS results [7], with the exception of the exponent, for which a constant value corresponding to , determined from Eq. (5), was used. The DIS data at high constrain the parameterisation of the dependence of (dashed lines) at low and of (dotted lines) at high . The logarithmic dependence of is probed only in the highest- region and is less well constrained.
The dependence of becomes crucial in the transition to low . In fact, as decreases from the DIS into the BPC region, for a given value of , also decreases: the BPC data in Figs. 6 and 7 correspond to values of that are typically two orders of magnitude smaller than those in the DIS data and thus, in the BPC region, the contribution from the fluctuation of the photon into a system becomes dominant. While extrapolating the BEKW parameterisation to low may not be formally justified, it is interesting to note that, in , conservation of the electromagnetic current is assured by the fact that vanishes like as . The transition from the linear behaviour at low to the logarithmic behaviour at higher is controlled by the scale parameter ; the choice GeV2 successfully describes the BPC data.
12.3 Comparison of the dependence of the diffractive and the total cross sections
Figure 8 shows the ratio as a function of for different and bins. At low , the dependence of the diffractive cross section is similar to that of . In the DIS regime, decreases with more rapidly than . This is more evident for small values of . In addition, the ratio appears to increase between the BPC and the DIS regions.
Also shown in the figure are the results of the BEKW parameterisation of the diffractive cross-section , shown in Fig. 6, divided by the values of given by the ALLM97 parameterisation [33]. There is reasonable agreement between these parameterisations and the data, indicating that the data may be qualitatively described by an appropriate choice of the relative fractions of the and contributions.
13 Summary
The diffractive dissociation of virtual photons, , has been studied at HERA at low ( GeV2) and in deep inelastic scattering (DIS) ( GeV2). The diffractive signal has been selected either by requiring the detection of a final-state proton with at least 97% of the incoming proton-beam energy, or by exploiting the different properties of the distributions for diffractive and non-diffractive events.
The dependence of the low- cross-section data obtained with the method ( GeV) has been found to be compatible with a single power of , which corresponds to a Pomeron intercept of . This is consistent with that previously observed in the DIS regime. Thus, the significant change in the dependence exhibited by the total cross section in the transition from low to DIS is not visible in the diffractive cross section. To elucidate this difference, the dependence of the ratio, , of the diffractive cross section to the total cross section was studied at low and was found to rise with , , in agreement with the expectation from Regge theory. This is in contrast to the observation at higher that this ratio is independent of .
The dependence of the diffractive cross section changes as increases up to the DIS regime: while at low the data do not exhibit a strong dependence, at larger the cross section falls rapidly for increasing . This change of behaviour occurs for values of around 1 GeV2 and is analogous to that observed in the total cross section. The ratio of the diffractive cross section to the total cross section was studied as a function of . At low , the ratio shows little dependence on , indicating that the dependence of the diffractive cross section is similar to that of . The ratio increases between the BPC and the DIS regions. In the DIS regime for low , the ratio decreases with increasing , indicating that the diffractive cross section decreases with more rapidly than the total cross section.
The main features of the data, reproduced by a parameterisation based on the BEKW model, indicate that the framework in which the incoming virtual photon fluctuates into a quark-antiquark pair is, in general, adequate to describe diffractive processes in collisions from the BPC to the DIS region. At the same time, the data suggest the increasing importance of the contribution from states at low . It is interesting that the ratio of the diffractive cross section to the total cross section shows a change from a dependence for GeV2 to for GeV2. This complex behaviour of diffraction as a function of both and reveals a rich testing ground for future theoretical models.
Acknowledgements
We thank the DESY directorate for their encouragement, and acknowledge the support of the DESY computing and network services. We are especially grateful to the HERA machine group: collaboration with them was crucial to the successful installation and operation of the leading proton spectrometer. The design, construction and installation of the ZEUS detector have been made possible by the ingenuity and efforts of many people from DESY and home institutes who are not listed as authors. Finally, it is a pleasure to thank J. Bartels, K. Golec-Biernat, N.N. Nikolaev, M.G. Ryskin and M. Strikman for many useful discussions.
References
- [1] P.D.B. Collins, An Introduction to Regge Theory and High Energy Physics, Cambridge University Press, Cambridge (1977).
-
[2]
A. Donnachie and P.V. Landshoff, Nucl. Phys. B244, 322 (1984);
A. Donnachie and P.V. Landshoff, Phys. Lett. B296, 227 (1992);
see also:
J.R. Cudell, K. Kang and S.K. Kim, Phys. Lett. B395, 311 (1997);
Particle Data Group, D.E. Groom et al., Eur. Phys. J. C15, 1 (2000). - [3] H1 Collab., C. Adloff et al., Z. Phys. C74, 221 (1997).
- [4] ZEUS Collab., J. Breitweg et al., Z. Phys. C75, 421 (1997).
- [5] See, for example, H. Abramowicz, Int. J. Mod. Phys. A15S1, 495 (2000) and references therein.
- [6] H1 Collab., C. Adloff et al., Z. Phys. C76, 613 (1997).
- [7] ZEUS Collab., J. Breitweg et al., Eur. Phys. J. C6, 43 (1999).
- [8] L.N. Hand, Phys. Rev. 129, 1834 (1963).
-
[9]
G. Ingelman and K. Janson-Prytz, Proceedings of
the Workshop “Physics at HERA”, Volume 1, W. Buchmüller, G. Ingelman
(eds.), DESY (1992), p. 233;
G. Ingelman and K. Prytz, Z. Phys. C58, 285 (1993). - [10] M.F. McDermott and G. Briskin, Proceedings of the Workshop “Future Physics at HERA”, Volume 2, G.Ingelman, A. De Roeck and R. Klanner (eds.), DESY (1996), p. 691, and references therein.
-
[11]
ZEUS Collab., U. Holm (ed.), The ZEUS Detector,
Status Report, (unpublished), DESY (1993);
http://www-zeus.desy.de/bluebook/bluebook.html . -
[12]
N. Harnew et al., Nucl. Instr. and Meth. A279, 290 (1989);
B. Foster et al., Nucl. Phys. Proc. Suppl. B32, 181 (1993);
B. Foster et al., Nucl. Inst. and Meth. A338, 254 (1994). -
[13]
M. Derrick et al., Nucl. Instr. and Meth. A309,77 (1991);
A. Andresen et al., Nucl. Instr. and Meth. A309, 101 (1991);
A. Caldwell et al., Nucl. Instr. and Meth. A321, 356 (1992);
A. Bernstein et al., Nucl. Instr. and Meth. A336, 23 (1993). - [14] ZEUS Collab., J. Breitweg et al., Phys. Lett. B407, 432 (1997).
- [15] ZEUS Collab., J. Breitweg et al., Phys. Lett. B487, 53 (2000).
- [16] A. Bamberger et al., Nucl. Instr. and Meth. A382, 419 (1996).
- [17] ZEUS Collab., M. Derrick et al., Z. Phys. C73, 253 (1997).
-
[18]
S. Bentvelsen, J. Engelen and P. Kooijman, in Proceedings of the
Workshop on Physics at HERA, Oct. 1991, Volume 1, W. Buchmüller and G.
Ingelman (eds.), DESY (1992), p. 23;
K.C. Höger, ibid., p. 43. - [19] G. Briskin, PhD Thesis, Tel Aviv University (1998), DESY-Thesis-1998-036.
- [20] F. Jacquet and A. Blondel, Proceedings of the Workshop “Study for an Facility for Europe”, U. Amaldi (ed.), DESY 79-048 (1979), p. 391.
- [21] M. Kasprzak, PhD Thesis, Warsaw University (1996), DESY F35D-96-16.
- [22] M. Inuzuka, PhD Thesis, University of Tokyo (1999), KEK Report 99-9.
- [23] K. Kwiatkowski, H. Spiesberger and H.-J. Möhring, Comput. Phys. Commun. 69, 155 (1992).
- [24] H. Jung, DESY Report 93-182 (1993).
- [25] G. Ingelman and P. Schlein, Phys. Lett. B152, 256 (1985).
- [26] GEANT 3.13, R. Brun et al., CERN DD/EE/84-1 (1987).
- [27] H. Abramowicz, A. Caldwell and R. Sinkus, Nucl. Instr. and Meth. A365, 508 (1995).
- [28] ZEUS Collab., J. Breitweg et al., Eur. Phys. J. C1, 81 (1998).
- [29] A. Hoecker and V. Kartvelishvili, Nucl. Instr. and Meth. A372, 469 (1996).
-
[30]
See e.g.:
U. Amaldi, M. Jacob and G. Matthiae, Ann. Rev. Nucl. Sci. 26, 385 (1976);
G. Cohen-Tannoudji, D. Levy and M. Souza, Nucl. Phys. B129, 286 (1977);
G. Alberi and G. Goggi, Phys. Rep. 74, 1 (1981);
K. Goulianos, Phys. Rep. 101, 169 (1983);
M. Kamran, Phys. Rep. 108, 275 (1984);
N.P. Zotov and V.A. Tsarev, Sov. Phys. Uspekhi 31, 119 (1988);
G. Giacomelli, Int. J. Mod. Phys. A5, 223 (1990). - [31] ZEUS Collab., J.Breitweg et al., Eur. Phys. J. C7, 609 (1999).
- [32] ZEUS Collab., J. Breitweg et al., Eur. Phys. J. C2, 237 (1998).
- [33] H.Abramowicz and A.Levy, DESY Report 97-251 (1997).
- [34] ZEUS Collab., S. Chekanov et al., Eur. Phys. J. C21, 443 (2001).
- [35] H1 Collab., C. Adloff et al., Z.Phys. C74, 221 (1997).
-
[36]
M. Wüsthoff and A. D. Martin, J. Phys. G25, R309 (1999);
A. Hebecker, Phys. Rep. 331, 1 (2000); Acta Phys. Polon. B30 (1999) 3777;
K. Golec–Biernat and M. Wüsthoff, Eur. Phys. J. C20, 313 (2001). - [37] J. Bartels et al., Eur. Phys. J. C7, 443 (1999).
| (GeV2) | (GeV) | (GeV) | (b/GeV3) | ||||||
| 0.17 | 0.70 | 0.39 | 90 | 250 | 130 | 3.00 | 6.05 | 5 | |
| 90 | 250 | 130 | 6.05 | 12.20 | 11 | ||||
| 165 | 250 | 210 | 12.20 | 38.00 | 22 | ||||
| 3 | 9 | 4 | 80 | 165 | 130 | 3.00 | 6.05 | 5 | |
| 165 | 250 | 210 | 3.00 | 6.05 | 5 | ||||
| 80 | 165 | 130 | 6.05 | 12.20 | 11 | ||||
| 165 | 250 | 210 | 6.05 | 12.20 | 11 | ||||
| 165 | 250 | 210 | 12.20 | 33.00 | 22 | ||||
| 9 | 80 | 27 | 80 | 165 | 130 | 3.00 | 6.05 | 5 | |
| 165 | 250 | 210 | 3.00 | 6.05 | 5 | ||||
| 80 | 165 | 130 | 6.05 | 12.20 | 11 | ||||
| 165 | 250 | 210 | 6.05 | 12.20 | 11 | ||||
| 165 | 250 | 210 | 12.20 | 33.00 | 22 | ||||
| (GeV2) | (GeV) | (GeV) | (b/GeV) | ||||||
|---|---|---|---|---|---|---|---|---|---|
| 0.220 | 0.324 | 0.27 | 90 | 120 | 104 | 3.00 | 6.05 | 4.26 | |
| 120 | 150 | 134 | |||||||
| 150 | 180 | 164 | |||||||
| 180 | 200 | 190 | |||||||
| 200 | 220 | 210 | |||||||
| 0.220 | 0.324 | 0.27 | 90 | 120 | 104 | 6.05 | 12.20 | 8.58 | |
| 120 | 150 | 134 | |||||||
| 150 | 180 | 164 | |||||||
| 180 | 200 | 190 | |||||||
| 200 | 220 | 210 | |||||||
| 0.324 | 0.476 | 0.39 | 90 | 120 | 104 | 3.00 | 6.05 | 4.26 | |
| 120 | 150 | 134 | |||||||
| 150 | 180 | 164 | |||||||
| 180 | 200 | 190 | |||||||
| 0.324 | 0.476 | 0.39 | 90 | 120 | 104 | 6.05 | 12.20 | 8.58 | |
| 120 | 150 | 134 | |||||||
| 150 | 180 | 164 | |||||||
| 180 | 200 | 190 | |||||||
| 0.476 | 0.700 | 0.58 | 90 | 120 | 104 | 3.00 | 6.05 | 4.26 | |
| 120 | 150 | 134 | |||||||
| 150 | 180 | 164 | |||||||
| 0.476 | 0.700 | 0.58 | 90 | 120 | 104 | 6.05 | 12.20 | 8.58 | |
| 120 | 150 | 134 | |||||||
| 150 | 180 | 164 | |||||||