Modeling Deep Inelastic Cross Sections in the Few GeV Region
Abstract
We present preliminary results on simple modifications and corrections to GRV94 leading order parton distribution functions such that they can be used to model electron,muon and neutrino deep-inelastic scattering cross sections at low energies. (Presented by Arie Bodek at NuInt01, Dec. 2001, KEK, Tsukuba, Japan).
Data from atmospheric neutrino experiments [1] have been interpreted as evidence for oscillations with and . These neutrino data are in the few GeV region. Therefore, good modeling of and cross sections at low energies is needed. The modeling of and cross sections is even more important for the more precise next generation neutrino oscillations experiments.
These include MiniBooNE, MINOS, CNGS, and experiments in the new neutrino facility to be constructed at the JHF high intensity 50 GeV proton synchrontron in Japan.
The quark distributions in the proton and neutron are parametrized as Parton Distribution Functions (PDFs) obtained from global fits to various sets of data at very high energies. These fits are done within the theory of Quantum Chromodynamics (QCD) in either leading order (LO) or next to leading order (NLO). The most important data come from deep-inelastic e/ scattering experiments on hydrogen and deuterium, and and experiments on nuclear targets. In previous publications [2, 3, 5] we have compared the predictions of the NLO MRSR2 PDFs to deep-inelastic e/ scattering data [10] on hydrogen and deuterium from SLAC, BCMS and NMC. In order to get agreement with the lower energy SLAC data (down to GeV), and at the highest values of (), we find that the following modifications to the MRSR2 PDFs must be included.
- 1.
-
2.
Deuteron binding corrections need to be applied as discussed in ref. [2].
-
3.
The ratio of at high must be increased as discussed in ref. [2].
-
4.
Kinematic higher-twist originating from target mass effects [9] are very large and must be included.
- 5.
In addition, our analysis including QCD Next to NLO (NNLO) terms shows [3] that most of the dynamical higher-twist corrections that are needed to fit the data within a NLO QCD analysis originate from the missing NNLO higher order terms. A recent calculation [4] also shows that dynamic higher twist corrections are very small. If most of the higher-twist terms that are needed to obtain agreement with the low energy data actually originate from target mass effects and missing NNLO terms, then these terms should be the same in and e/ scattering. Therefore, low energy data should be described by the PDFs which are fit to high energy data and are modified to include target mass and higher-twist corrections to describe low energy e/ scattering data. With this idea in mind, we find what modifications are need to be applied to GRV94 [6] leading order PDFs such that the PDFs describe both high energy and low energy electron/muon data.
In order to describe low energy data down to the photoproduction limit (), and account for both target mass and higher twist effects, we find that the following modifications are required for the GRV94 LO PDFs.
-
1.
We increase the ratio at high as described in our previous analysis [2]. The corrections to the and distributions are described in detail in appendix A.
-
2.
Instead of the scaling variable we use the scaling variable (or =). This modification was used in early fits to SLAC data [7]. The parameter A provides for an approximate way to include target mass effects and higher twist effects at high , and the parameter B allows the fit to be used all the way down to the photoproduction limit (=0).
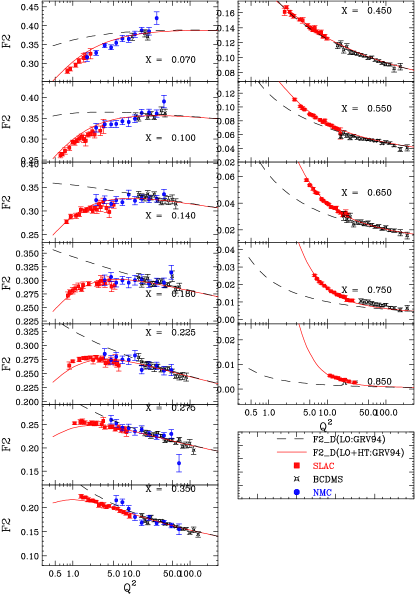
Figure 2: Electron and muon data on deuterons (SLAC, BCDMS and NMC) compared to the predictions with GRV94 PDFs (LO, dashed line) and the modified GRV94 PDFs (LO+HT, solid line). -
3.
In addition as was done in earlier non-QCD based fits [8] to low energy data, we multiply all PDFs by a factor / ( +C). This is done in order for the fits to describe both intermediate- data and data in the photoproduction limit, where the structure function is related to the photoproduction cross section according to
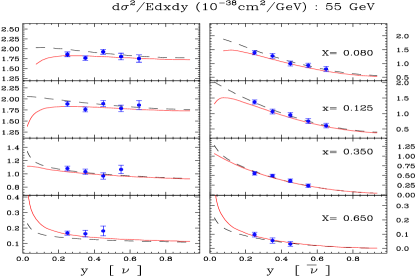
Figure 3: Comparison of representative CCFR and charged-current differential cross sections [11, 5] on iron at 55 GeV and the predictions of the GRV94 PDFs with (LO+HT, solid) and without (LO, dashed) our modifications. -
4.
Finally, we freeze the evolution of the GRV94 PDFs at a value of (for ), because the GRV94 PDFs are only valid down to GeV/.
In our analysis, the measured structure functions are corrected for the BCDMS systematic error shift and for the relative normalizations between the SLAC, BCDMS and NMC data [2, 3]. The deuterium data are also corrected for nuclear binding effects [2, 3].
A simultaneous fit to both proton and deuteron data yields A=1.735, B=0.624 and C=0.188. Figures 1 and 2 show the SLAC, BCDMS and NMC data as compared to the predictions of the standard leading GRV94 PDFs (LO, dashed line) and with our modifications (LO+HT, solid line).
Our value of C=0.188 is smaller than in other analyses [8] to low data. This is because we include both QCD evolution and higher twist in our fits, while QCD evolution is completely neglected in these other analyses [8]. We also compare the predictions with the standard GRV94 PDFs and with our modified GRV94 PDFs (LO+HT) to a few representative high energy CCFR and charged-current differential cross sections [11, 5] on iron (these were not included in our fit). In this comparison we use the PDFs to obtain and and correct for nuclear effects on iron [11, 5]. The parameterization for this nuclear effect is shown in appendix A of this article. The structure function is obtained by using the fit from reference [10], as discussed in appendix A. There is very good agreement with the neutrino data.
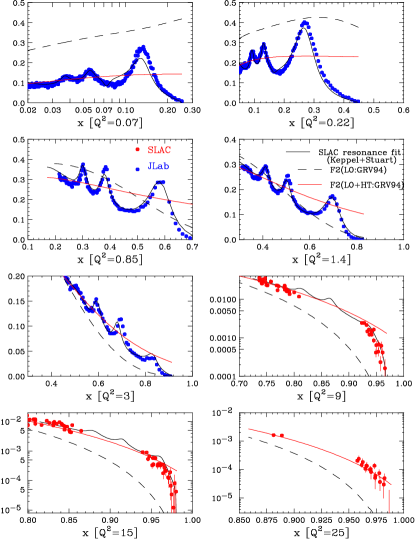
According to Bloom-Gilman [12] duality and if we use the scaling variable, the PDFs should also provide a reasonable description of the average value of the structure functions in the resonance region. Figure 4 shows a comparison between resonance data (from SLAC and Jefferson Lab, or parametrizations of these data [13]) and the predictions with the standard GRV94 PDFs (LO) and with our modified GRV94 PDFs (LO+HT). There is good agreement with SLAC and JLab resonance data down to (although these data were not included in our fit). In the limit, e.g. for GeV, the modified PDFs yield a photoproduction cross section of 0.122 0.3/0.188 = 0.18 mb, which is in good agreement with experimental data.
In order to have a full description of all charged current and processes, the contribution from quasielastic scattering [14] must be added separately at . One may chose to use these modified GRV94 PDFs (LO+HT) to provide a description of all remaining inelastic scattering processes, including the resonance region, or one may chose to use them only above a certain value of invariant mass , and add the lower mass resonances separately. Probably the best prescription is to use these fits above the first resonance (e.g. above =1.35 GeV) and add the contributions from quasielastic and first resonance [15] (=1.23 GeV) separately. In the resonance region at higher mass (e.g. =1.7 GeV) there is a significant contribution from the deep-inelastic continuum which is not well modeled by the existing fits [15] to neutrino resonance data (and using PDFs is better). Note that for nuclear targets, nuclear corrections must also be applied.
In conclusion, we present the result of a first attempt at modifying GRV94 PDFs (LO+HT) such that they provide a good description of e, and data both at low and high energies (including the average of the cross section in the resonance region). We have initiated a collaboration with scientists at Jefferson Lab to institute further improvements such as allowing for different higher twist parameters for u, d, s, c quarks (e.g. hydrogen versus deuterium and valence versus sea). In addition, one can multiply the PDFs by a modulating function [7] A(W,) to improve modeling in the resonance region and comparing to Jefferson lab data [13]. In addition, we plan to include data on deuterium and heavier nuclear targets. Note that because of the effects of experimental resolution and Fermi motion (for nuclear targets), a description of the average cross section in the resonance region may be sufficient for some neutrino experiments. It is expected that there are some differences between the form factors of resonances for and scattering. As a test of our approach, we will also compare our predictions for scattering to measured cross sections in the region of first resonance [15], where the largest differences are expected.
Appendix A Appendix
In leading order QCD (e.g. GRV94 LO PDFs), for the scattering of electrons and muons on proton (or neutron) targets is given by the sum of quark and anti-quark distributions (each weighted the square of the quark charges):
| (1) |
Thus, our modified to describe low energy data down to photoproduction limit is given by
| (2) |
where .
In neutrino scattering we use the same modified scaling variable and the same correction factor in and .
In the extraction of original GRV94 LO PDFs, no separate longitudinal contribution was included. The quark distributions were directly fit to data. A full modeling of electron and muon cross section requires also a description of . We use a non-zero longitudinal in reconstructing by using a fit of to measured data. Thus, is given by
| (3) |
In reality, a reconstruction of from the values of and in neutrino scattering is not as simple as in the case of charged lepton scattering (because of charm production). For charm production, the Bjorken scaling variable no longer represents the fractional momentum carried by the struck quark in the infinite momentum frame due to the non-zero heavy mass of the charm quark ( GeV). For charm production processes, the variable is replaced by the slow rescaling variable . Therefore, the structure functions for the charm production (cp) and non-charm production (ncp) components are given by the following expressions.
| (4) | |||||
| (5) | |||||
In this model, the fit [10] is used for and , is parameterized by:
| (6) | |||||
where .
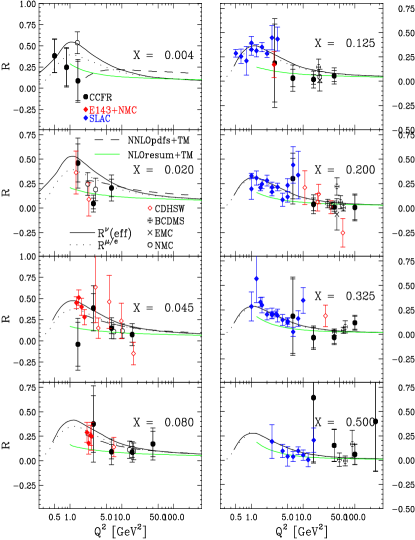
The function provides a good description of the world’s data in the and region (where most of the data are available). Fig 5 shows a comparison of all available data on and . is shown as the dotted line. Because of the effect of the charm quark final state mass in charm production in neutrino scattering, the effective for neutrino scattering in the very low region ( - solid line) is somewhat higher than (which is a fit to electron and muon scattering data). We use Eq. 4 and 5 to construct for neutrino scattering. However, this effect is not important at low neutrino energies (which are below charm production threshold). We include this effect because we want our formalism to be also correct at high energies (e.g. in the CCFR/NuTeV region).
Note that the function breaks down below . Therefore, we freeze the function at and introduce the following function for in the region. The new function provides a smooth transition from down to by forcing to approach zero at as expected in the photoproduction limit (while keeping a behavior at large and matching to at ).
| (7) | |||||
In neutrino scattering the value of is required to approach zero at only for the vector part of the interaction. However, the overall contribution from is expected to be small in this region. Therefore, it is reasonable to use Eq. 7 for in both the electron/muon and neutrino scattering cases.
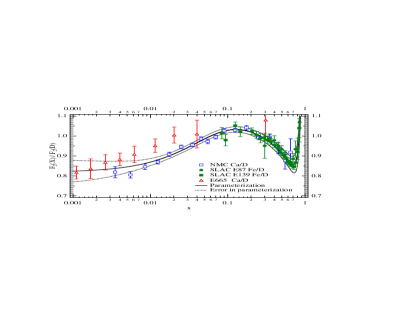
In the comparison with CCFR charged-current differential cross section on iron, a nuclear correction for iron targets is applied. We use the following parameterized function, (fit to experimental electron and muon scattering data for the ratio of iron to deuterium cross sections, shown in Fig 6), to convert deuterium structure functions to (isoscalar) iron structure functions [18];
| (8) | |||||
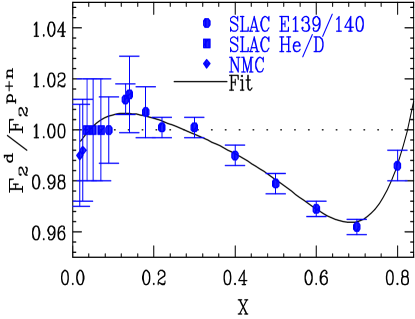
For the ratio of deuterium cross sections to cross sections on free nucleons we use the following function obtained from a fit to SLAC data on the nuclear dependence of electron scattering cross sections [5].
| (9) | |||||
This correction shown in Fig. 7 is only valid in the region. In neutrino scattering, we use the same nuclear correction factor for , and .
The correction for the GRV94 LO PDFs is obtained from the NMC data for . Here, Eq. 9 is used to remove nuclear binding effects in the NMC deuterium data. The correction term, is obtained by keeping the total valence and sea quarks the same.
| (10) | |||||
where the corrected ratio is . Thus, the modified and valence distributions are given by
| (11) | |||
| (12) |
The same formalism is applied to the modified and sea distributions. Accidently, the modified and sea distributions (based on NMC data) agree with the NUSEA data in the range of between 0.1 and 0.4. Thus, we find that any futher correction on sea quarks is not necessary.
References
- [1] S. Fukuda et al., Phys. Rev. Lett. 85, 3999 (2000); T. Toshito, hep-ex/0105023.
- [2] U. K. Yang and A. Bodek, Phys. Rev. Lett. 82, 2467 (1999).
- [3] U. K. Yang and A. Bodek, Eur. Phys. J. C13, 241 (2000).
- [4] J. Bluemlein and A. Tkabladze, Nucl. Phys. B553, 427 (1999).
-
[5]
U. K. Yang, Ph.D. thesis, Univ. of Rochester, UR-1583 (2001).
http:/hep.uchicago.edu/
ukyang/neutrino/thesis.ps. - [6] M. Gluck et al., Z. Phys. C67,433 (1995).
- [7] A. Bodek et al., Phys. Rev. D20, 1471 (1979).
- [8] A. Donnachie and P. V. Landshoff, Z. Phys. C 61, 139 (1994); B. T. Fleming et al.(CCFR), Phys. Rev. Lett. 86, 5430 (2001).
- [9] H. Georgi and H. D. Politzer, Phys. Rev. D14, 1829 (1976).
- [10] L. W. Whitlow et al. (SLAC-MIT), Phys. Lett. B282, 433 (1995); A. C. Benvenuti et al.(BCDMS), Phys. Lett. B237, 592 (1990); M. Arneodo et al. (NMC), Nucl. Phys. B483, 3 (1997).
- [11] U. K. Yang et al.(CCFR), Phys. Rev. Lett. 87, 251802 (2001).
- [12] E. D. Bloom and F. J. Gilman, Phys. Rev. Lett. 25, 1140 (1970).
- [13] C. S. Armstrong et al., Phys. Rev. D63, 094008 (2001).
- [14] T. Kitigaki et al., Phys. Rev. D28, 436 (1983).
- [15] D. Rein and L. M. Sehgal, Annals of Physics 133 79 (1981); R. Belusevic and D. Rein, Phys. Rev. D 46, 3747 (1992).
- [16] R. S. Thorne , Phys. Lett. B474, 372 (2000); A. M. Cooper-Sarkar, hep-ph/0102151 (Feb. 2001).
- [17] A. D. Martin et al., Eur. Phys. Jour. C18, 117 (2001).
- [18] W. G. Seligman, Ph.D. thesis, Columbia Univ., Nevis reports 292 (1997).