Improved Measurement of the -violating Asymmetry
Amplitude
The BABAR Collaboration
B. Aubert
D. Boutigny
J.-M. Gaillard
A. Hicheur
Y. Karyotakis
J. P. Lees
P. Robbe
V. Tisserand
A. Zghiche
Laboratoire de Physique des Particules, F-74941 Annecy-le-Vieux, France
A. Palano
A. Pompili
Università di Bari, Dipartimento di Fisica and INFN, I-70126 Bari, Italy
G. P. Chen
J. C. Chen
N. D. Qi
G. Rong
P. Wang
Y. S. Zhu
Institute of High Energy Physics, Beijing 100039, China
G. Eigen
I. Ofte
B. Stugu
University of Bergen, Inst. of Physics, N-5007 Bergen, Norway
G. S. Abrams
A. W. Borgland
A. B. Breon
D. N. Brown
J. Button-Shafer
R. N. Cahn
E. Charles
M. S. Gill
A. V. Gritsan
Y. Groysman
R. G. Jacobsen
R. W. Kadel
J. Kadyk
L. T. Kerth
Yu. G. Kolomensky
J. F. Kral
C. LeClerc
M. E. Levi
G. Lynch
L. M. Mir
P. J. Oddone
M. Pripstein
N. A. Roe
A. Romosan
M. T. Ronan
V. G. Shelkov
A. V. Telnov
W. A. Wenzel
Lawrence Berkeley National Laboratory and University of California, Berkeley, CA 94720, USA
T. J. Harrison
C. M. Hawkes
D. J. Knowles
S. W. O’Neale
R. C. Penny
A. T. Watson
N. K. Watson
University of Birmingham, Birmingham, B15 2TT, United Kingdom
T. Deppermann
K. Goetzen
H. Koch
B. Lewandowski
K. Peters
H. Schmuecker
M. Steinke
Ruhr Universität Bochum, Institut für Experimentalphysik 1, D-44780 Bochum, Germany
N. R. Barlow
W. Bhimji
N. Chevalier
P. J. Clark
W. N. Cottingham
B. Foster
C. Mackay
F. F. Wilson
University of Bristol, Bristol BS8 1TL, United Kingdom
K. Abe
C. Hearty
T. S. Mattison
J. A. McKenna
D. Thiessen
University of British Columbia, Vancouver, BC, Canada V6T 1Z1
S. Jolly
A. K. McKemey
Brunel University, Uxbridge, Middlesex UB8 3PH, United Kingdom
V. E. Blinov
A. D. Bukin
D. A. Bukin
A. R. Buzykaev
V. B. Golubev
V. N. Ivanchenko
A. A. Korol
E. A. Kravchenko
A. P. Onuchin
S. I. Serednyakov
Yu. I. Skovpen
A. N. Yushkov
Budker Institute of Nuclear Physics, Novosibirsk 630090, Russia
D. Best
M. Chao
D. Kirkby
A. J. Lankford
M. Mandelkern
S. McMahon
D. P. Stoker
University of California at Irvine, Irvine, CA 92697, USA
K. Arisaka
C. Buchanan
S. Chun
University of California at Los Angeles, Los Angeles, CA 90024, USA
D. B. MacFarlane
S. Prell
Sh. Rahatlou
G. Raven
V. Sharma
University of California at San Diego, La Jolla, CA 92093, USA
C. Campagnari
B. Dahmes
P. A. Hart
N. Kuznetsova
S. L. Levy
O. Long
A. Lu
M. A. Mazur
J. D. Richman
W. Verkerke
University of California at Santa Barbara, Santa Barbara, CA 93106, USA
J. Beringer
A. M. Eisner
M. Grothe
C. A. Heusch
W. S. Lockman
T. Pulliam
T. Schalk
R. E. Schmitz
B. A. Schumm
A. Seiden
M. Turri
W. Walkowiak
D. C. Williams
M. G. Wilson
University of California at Santa Cruz, Institute for Particle Physics, Santa Cruz, CA 95064, USA
E. Chen
G. P. Dubois-Felsmann
A. Dvoretskii
D. G. Hitlin
S. Metzler
J. Oyang
F. C. Porter
A. Ryd
A. Samuel
S. Yang
R. Y. Zhu
California Institute of Technology, Pasadena, CA 91125, USA
S. Jayatilleke
G. Mancinelli
B. T. Meadows
M. D. Sokoloff
University of Cincinnati, Cincinnati, OH 45221, USA
T. Barillari
P. Bloom
W. T. Ford
U. Nauenberg
A. Olivas
P. Rankin
J. Roy
J. G. Smith
W. C. van Hoek
L. Zhang
University of Colorado, Boulder, CO 80309, USA
J. Blouw
J. L. Harton
M. Krishnamurthy
A. Soffer
W. H. Toki
R. J. Wilson
J. Zhang
Colorado State University, Fort Collins, CO 80523, USA
T. Brandt
J. Brose
T. Colberg
M. Dickopp
R. S. Dubitzky
A. Hauke
E. Maly
R. Müller-Pfefferkorn
S. Otto
K. R. Schubert
R. Schwierz
B. Spaan
L. Wilden
Technische Universität Dresden, Institut für Kern- und Teilchenphysik, D-01062 Dresden, Germany
D. Bernard
G. R. Bonneaud
F. Brochard
J. Cohen-Tanugi
S. Ferrag
S. T’Jampens
Ch. Thiebaux
G. Vasileiadis
M. Verderi
Ecole Polytechnique, LLR, F-91128 Palaiseau, France
A. Anjomshoaa
R. Bernet
A. Khan
D. Lavin
F. Muheim
S. Playfer
J. E. Swain
J. Tinslay
University of Edinburgh, Edinburgh EH9 3JZ, United Kingdom
M. Falbo
Elon University, Elon University, NC 27244-2010, USA
C. Borean
C. Bozzi
L. Piemontese
Università di Ferrara, Dipartimento di Fisica and INFN, I-44100 Ferrara, Italy
E. Treadwell
Florida A&M University, Tallahassee, FL 32307, USA
F. Anulli
Also with Università di Perugia, I-06100 Perugia, Italy
R. Baldini-Ferroli
A. Calcaterra
R. de Sangro
D. Falciai
G. Finocchiaro
P. Patteri
I. M. Peruzzi
Also with Università di Perugia, I-06100 Perugia, Italy
M. Piccolo
Y. Xie
A. Zallo
Laboratori Nazionali di Frascati dell’INFN, I-00044 Frascati, Italy
S. Bagnasco
A. Buzzo
R. Contri
G. Crosetti
M. Lo Vetere
M. Macri
M. R. Monge
S. Passaggio
F. C. Pastore
C. Patrignani
E. Robutti
A. Santroni
S. Tosi
Università di Genova, Dipartimento di Fisica and INFN, I-16146 Genova, Italy
M. Morii
Harvard University, Cambridge, MA 02138, USA
R. Bartoldus
R. Hamilton
U. Mallik
University of Iowa, Iowa City, IA 52242, USA
J. Cochran
H. B. Crawley
J. Lamsa
W. T. Meyer
E. I. Rosenberg
J. Yi
Iowa State University, Ames, IA 50011-3160, USA
G. Grosdidier
A. Höcker
H. M. Lacker
S. Laplace
F. Le Diberder
V. Lepeltier
A. M. Lutz
S. Plaszczynski
M. H. Schune
S. Trincaz-Duvoid
G. Wormser
Laboratoire de l’Accélérateur Linéaire, F-91898 Orsay, France
R. M. Bionta
V. Brigljević
D. J. Lange
M. Mugge
K. van Bibber
D. M. Wright
Lawrence Livermore National Laboratory, Livermore, CA 94550, USA
A. J. Bevan
J. R. Fry
E. Gabathuler
R. Gamet
M. George
M. Kay
D. J. Payne
R. J. Sloane
C. Touramanis
University of Liverpool, Liverpool L69 3BX, United Kingdom
M. L. Aspinwall
D. A. Bowerman
P. D. Dauncey
U. Egede
I. Eschrich
G. W. Morton
J. A. Nash
P. Sanders
D. Smith
University of London, Imperial College, London, SW7 2BW, United Kingdom
J. J. Back
G. Bellodi
P. Dixon
P. F. Harrison
R. J. L. Potter
H. W. Shorthouse
P. Strother
P. B. Vidal
Queen Mary, University of London, E1 4NS, United Kingdom
G. Cowan
S. George
M. G. Green
A. Kurup
C. E. Marker
T. R. McMahon
S. Ricciardi
F. Salvatore
G. Vaitsas
University of London, Royal Holloway and Bedford New College, Egham, Surrey TW20 0EX, United Kingdom
D. Brown
C. L. Davis
University of Louisville, Louisville, KY 40292, USA
J. Allison
R. J. Barlow
J. T. Boyd
A. C. Forti
F. Jackson
G. D. Lafferty
N. Savvas
J. H. Weatherall
J. C. Williams
University of Manchester, Manchester M13 9PL, United Kingdom
A. Farbin
A. Jawahery
V. Lillard
J. Olsen
D. A. Roberts
J. R. Schieck
University of Maryland, College Park, MD 20742, USA
G. Blaylock
C. Dallapiccola
K. T. Flood
S. S. Hertzbach
R. Kofler
V. B. Koptchev
T. B. Moore
H. Staengle
S. Willocq
University of Massachusetts, Amherst, MA 01003, USA
B. Brau
R. Cowan
G. Sciolla
F. Taylor
R. K. Yamamoto
Massachusetts Institute of Technology, Laboratory for Nuclear Science, Cambridge, MA 02139, USA
M. Milek
P. M. Patel
McGill University, Montréal, QC, Canada H3A 2T8
F. Palombo
C. Vite
Università di Milano, Dipartimento di Fisica and INFN, I-20133 Milano, Italy
J. M. Bauer
L. Cremaldi
V. Eschenburg
R. Kroeger
J. Reidy
D. A. Sanders
D. J. Summers
University of Mississippi, University, MS 38677, USA
C. Hast
J. Y. Nief
P. Taras
Université de Montréal, Laboratoire René J. A. Lévesque, Montréal, QC, Canada H3C 3J7
H. Nicholson
Mount Holyoke College, South Hadley, MA 01075, USA
C. Cartaro
N. Cavallo
Also with Università della Basilicata, I-85100 Potenza, Italy
G. De Nardo
F. Fabozzi
C. Gatto
L. Lista
P. Paolucci
D. Piccolo
C. Sciacca
Università di Napoli Federico II, Dipartimento di Scienze Fisiche and INFN, I-80126, Napoli, Italy
J. M. LoSecco
University of Notre Dame, Notre Dame, IN 46556, USA
J. R. G. Alsmiller
T. A. Gabriel
Oak Ridge National Laboratory, Oak Ridge, TN 37831, USA
J. Brau
R. Frey
E. Grauges
M. Iwasaki
C. T. Potter
N. B. Sinev
D. Strom
University of Oregon, Eugene, OR 97403, USA
F. Colecchia
F. Dal Corso
A. Dorigo
F. Galeazzi
M. Margoni
M. Morandin
M. Posocco
M. Rotondo
F. Simonetto
R. Stroili
E. Torassa
C. Voci
Università di Padova, Dipartimento di Fisica and INFN, I-35131 Padova, Italy
M. Benayoun
H. Briand
J. Chauveau
P. David
Ch. de la Vaissière
L. Del Buono
O. Hamon
Ph. Leruste
J. Ocariz
M. Pivk
L. Roos
J. Stark
Universités Paris VI et VII, Lab de Physique Nucléaire H. E., F-75252 Paris, France
P. F. Manfredi
V. Re
V. Speziali
Università di Pavia, Dipartimento di Elettronica and INFN, I-27100 Pavia, Italy
E. D. Frank
L. Gladney
Q. H. Guo
J. Panetta
University of Pennsylvania, Philadelphia, PA 19104, USA
C. Angelini
G. Batignani
S. Bettarini
M. Bondioli
F. Bucci
E. Campagna
M. Carpinelli
F. Forti
M. A. Giorgi
A. Lusiani
G. Marchiori
F. Martinez-Vidal
M. Morganti
N. Neri
E. Paoloni
M. Rama
G. Rizzo
F. Sandrelli
G. Simi
G. Triggiani
J. Walsh
Università di Pisa, Scuola Normale Superiore and INFN, I-56010 Pisa, Italy
M. Haire
D. Judd
K. Paick
L. Turnbull
D. E. Wagoner
Prairie View A&M University, Prairie View, TX 77446, USA
J. Albert
P. Elmer
C. Lu
V. Miftakov
S. F. Schaffner
A. J. S. Smith
A. Tumanov
E. W. Varnes
Princeton University, Princeton, NJ 08544, USA
F. Bellini
G. Cavoto
D. del Re
Università di Roma La Sapienza, Dipartimento di Fisica and INFN, I-00185 Roma, Italy
R. Faccini
University of California at San Diego, La Jolla, CA 92093, USA
Università di Roma La Sapienza, Dipartimento di Fisica and INFN, I-00185 Roma, Italy
F. Ferrarotto
F. Ferroni
M. A. Mazzoni
S. Morganti
G. Piredda
M. Serra
C. Voena
Università di Roma La Sapienza, Dipartimento di Fisica and INFN, I-00185 Roma, Italy
S. Christ
R. Waldi
Universität Rostock, D-18051 Rostock, Germany
T. Adye
N. De Groot
B. Franek
N. I. Geddes
G. P. Gopal
S. M. Xella
Rutherford Appleton Laboratory, Chilton, Didcot, Oxon, OX11 0QX, United Kingdom
R. Aleksan
S. Emery
A. Gaidot
S. F. Ganzhur
P.-F. Giraud
G. Hamel de Monchenault
W. Kozanecki
M. Langer
G. W. London
B. Mayer
B. Serfass
G. Vasseur
Ch. Yèche
M. Zito
DAPNIA, Commissariat à l’Energie Atomique/Saclay, F-91191 Gif-sur-Yvette, France
M. V. Purohit
A. W. Weidemann
F. X. Yumiceva
University of South Carolina, Columbia, SC 29208, USA
I. Adam
D. Aston
N. Berger
A. M. Boyarski
G. Calderini
M. R. Convery
D. P. Coupal
D. Dong
J. Dorfan
W. Dunwoodie
R. C. Field
T. Glanzman
S. J. Gowdy
T. Haas
T. Hadig
V. Halyo
T. Himel
T. Hryn’ova
M. E. Huffer
W. R. Innes
C. P. Jessop
M. H. Kelsey
P. Kim
M. L. Kocian
U. Langenegger
D. W. G. S. Leith
S. Luitz
V. Luth
H. L. Lynch
H. Marsiske
S. Menke
R. Messner
D. R. Muller
C. P. O’Grady
V. E. Ozcan
A. Perazzo
M. Perl
S. Petrak
H. Quinn
B. N. Ratcliff
S. H. Robertson
A. Roodman
A. A. Salnikov
T. Schietinger
R. H. Schindler
J. Schwiening
A. Snyder
A. Soha
S. M. Spanier
J. Stelzer
D. Su
M. K. Sullivan
H. A. Tanaka
J. Va’vra
S. R. Wagner
M. Weaver
A. J. R. Weinstein
W. J. Wisniewski
D. H. Wright
C. C. Young
Stanford Linear Accelerator Center, Stanford, CA 94309, USA
P. R. Burchat
C. H. Cheng
T. I. Meyer
C. Roat
Stanford University, Stanford, CA 94305-4060, USA
R. Henderson
TRIUMF, Vancouver, BC, Canada V6T 2A3
W. Bugg
H. Cohn
University of Tennessee, Knoxville, TN 37996, USA
J. M. Izen
I. Kitayama
X. C. Lou
University of Texas at Dallas, Richardson, TX 75083, USA
F. Bianchi
M. Bona
D. Gamba
Università di Torino, Dipartimento di Fisica Sperimentale and INFN, I-10125 Torino, Italy
L. Bosisio
G. Della Ricca
S. Dittongo
L. Lanceri
P. Poropat
L. Vitale
G. Vuagnin
Università di Trieste, Dipartimento di Fisica and INFN, I-34127 Trieste, Italy
R. S. Panvini
Vanderbilt University, Nashville, TN 37235, USA
C. M. Brown
P. D. Jackson
R. Kowalewski
J. M. Roney
University of Victoria, Victoria, BC, Canada V8W 3P6
H. R. Band
S. Dasu
M. Datta
A. M. Eichenbaum
H. Hu
J. R. Johnson
R. Liu
F. Di Lodovico
Y. Pan
R. Prepost
I. J. Scott
S. J. Sekula
J. H. von Wimmersperg-Toeller
S. L. Wu
Z. Yu
University of Wisconsin, Madison, WI 53706, USA
T. M. B. Kordich
H. Neal
Yale University, New Haven, CT 06511, USA
Abstract
We present updated results on time-dependent -violating
asymmetries in neutral decays to several eigenstates. The
measurements use a data sample of about 62 million
decays collected between 1999 and 2001 by the BABAR detector at the
PEP-II asymmetric-energy Factory at SLAC. In this sample we study events
in which one neutral meson is fully reconstructed in a final state
containing a charmonium meson and the flavor of the other neutral
meson is determined from its decay products. The amplitude of the
-violating asymmetry, which in the Standard Model is proportional to
, is derived from the decay time distributions in such events. We
measure and
. The latter is
consistent with the Standard Model expectation of no direct violation. These results are preliminary.
The Standard Model of electroweak interactions describes violation
in weak decays as a consequence of a complex phase in the
three-generation Cabibbo-Kobayashi-Maskawa CKM (CKM) quark-mixing
matrix. In this picture, measurements of -violating asymmetries in
the time distributions of decays to charmonium final states provide
a direct measurement of BCP , where .
Measurements of the -violating asymmetry parameter have
recently been published by the BABARbabar-stwob-prl and
Belle belle-stwob-prl collaborations from data taken between 1999
and summer 2001 at the PEP-II and KEKB asymmetric-energy colliders.
These results, which followed less precise
measurements OPALCDFALEPH , established violation in the system. In this paper, we report an updated measurement of ,
using a sample of 62 million decays collected with the
BABAR detector. Since our previous measurement,
we have added a sample of 30 million decays collected
in the latter half of 2001, and have improved
data reconstruction and analysis techniques. The measurement technique
is described in detail in Ref. babar-stwob-prd . The discussion
here is limited to the changes in the analysis with respect to the
published results babar-stwob-prl ; babar-stwob-prd .
Since the BABAR detector is described in detail
elsewhere babar-detector-nim ,
only a brief description is given here.
Surrounding the beam-pipe is a silicon vertex tracker (SVT), which
provides precise measurements of the trajectories of charged particles
as they leave the interaction point.
Outside of the SVT, a 40-layer drift chamber (DCH)
allows measurements of track momenta in a 1.5 T magnetic field as well as
energy-loss measurements, which contribute to charged
particle identification. Surrounding the DCH is a detector of internally
reflected Cherenkov radiation (DIRC), which provides charged hadron
identification. Outside of the DIRC is a CsI(Tl) electromagnetic
calorimeter (EMC) that is used to detect photons, provide electron
identification and reconstruct neutral hadrons. The EMC is surrounded by a
superconducting coil, which creates the magnetic field for momentum
measurements. Outside of the coil, the
flux return is instrumented with resistive plate chambers interspersed with
iron (IFR) for the identification of muons and long-lived neutral hadrons.
We use the GEANT4 geant4 software to simulate interactions of particles
traversing the BABAR detector.
From approximately 56 of data recorded at the resonance,
corresponding to 62 million produced pairs, we reconstruct a
sample of neutral mesons, , decaying to the final states
,
,
,
, and
.
The and mesons are reconstructed through their decays
to and ; the is also reconstructed
through its decay to . The meson is
reconstructed in the decay mode . We examine each of the
events in the sample for evidence that the recoiling neutral
meson decayed as a or (flavor tag).
The decay-time distribution of decays to a eigenstate with a or tag can be expressed in terms of a complex parameter
that depends on both the - oscillation amplitude and the amplitudes
describing and decays to this final
state lambda . The decay rate when the
tagging meson is a is given by
(1)
where is the difference between
the proper decay time of the reconstructed meson () and
the proper decay time of the tagging meson (),
is the lifetime, is the mass difference
determined from - oscillations, and the lifetime difference between
the neutral mass eigenstates is assumed to be negligible. The sine
term in Eq. 1 is due to the interference between direct
decay and decay after flavor change, and the cosine term is due to the
interference between two or more decay amplitudes with different weak
phases. Evidence for violation can be observed as a difference
between the distributions of - and -tagged events or as
an asymmetry with respect to for either flavor tag.
In the Standard Model, for
charmonium-containing decays where is the eigenvalue of the final state . Thus, the time-dependent
-violating asymmetry is
(2)
with for
,
, and
, and
for .
The measurement of with the decay mode is experimentally complicated by the presence of both
even (L=0, 2) and odd (L=1) orbital angular momenta in the final state.
With the measured -even and -odd contributions to the decay
rate BABARTRANS , the experimental sensitivity to is
reduced by 24% compared to pure eigenstates.
The interference between -even and -odd amplitudes in this mode
allows a measurement of up to a sign ambiguity.
The time- and angle-dependent decay rate
when the tagging meson is a is given by
(3)
where the coefficients , , , and are
functions of three transversity angles and the previously
measured transversity amplitudes BABARTRANS (see
appendix A).
The event selection, lepton and charged kaon identification, and and reconstruction used in this analysis are similar to
those described in Ref. babar-stwob-prl ; babar-stwob-prd .
Since these earlier publications, significant improvements have been made in
the analysis.
Charged kaon identification has improved due to a better
alignment of the Cherenkov detector and better Cherenkov angle
reconstruction.
For the selection, we have loosened the muon selection
requirements for and the veto for candidates.
In the selection for candidates, the
requirement on the mass has been relaxed to MeV/.
We have increased the sensitivity to for the mode by taking into account the transversity
angles for each event instead of integrating out the angle dependence.
Events reconstructed in this mode
that have a candidate in the mode are rejected.
In addition, the whole dataset has been processed with
a uniform reconstruction algorithm and detector calibration.
This provides, in particular, better alignment
of the tracking system and improved track reconstruction efficiency for
the 20 fb-1 of data collected in 1999–2000.
For example, the event yield increased by 11% (37%) for the
() sample while the purity only decreased by 4%
(3%). The effect of all improvements decreases the error on
scaled to the same integrated luminosity by 13%.
Candidates in the sample are selected by requiring that the
difference between their energy and the beam energy in the
center-of-mass frame be less than three standard deviations from zero.
For modes involving , the beam-energy substituted mass
must be greater than
. The resolution for is about 10, except for
the (33), the (20)
and the (3.5 after mass constraint) modes.
For the purpose of determining numbers of events and purities, a signal
region is used for modes
containing (). The signal region for the mode
is defined by .
A measurement of requires a determination of the experimental
resolution and the fraction of events in which the tag
assignment is incorrect. A mistag fraction reduces the observed
asymmetry by a factor .
Mistag fractions and resolution functions
are determined from a sample
of neutral decays to flavor eigenstates
consisting of the channels
, and and .
Validation studies are performed with a control sample of charged
mesons decaying to the final states , , , and
.
The methods for flavor tagging and vertex reconstruction, and the
determination of , are described in
Ref. babar-stwob-prd .
For flavor tagging, we exploit information from the recoil decay in
the event. The charges of energetic
electrons and muons from semileptonic decays, kaons, soft pions from
decays, and high momentum particles are correlated with
the flavor of the decaying quark. For example, a positive lepton
indicates a tag.
About 68% of the events can be assigned to one of four hierarchical,
mutually exclusive tagging categories. The remaining untagged events are
excluded from further analysis.
For a lepton tag we require an electron or muon candidate with a
center-of-mass momentum or ,
respectively. This efficiently selects primary leptons from semileptonic
decays and reduces contamination due to oppositely-charged leptons from
charm decays. Events satisfying these criteria are assigned to the Lepton category unless the lepton charge and the net charge of all
kaon candidates indicate opposite flavor tags. Events without a lepton
tag but with a non-zero net kaon charge are assigned to the Kaon
category.
All remaining events are passed to a neural network algorithm whose main
inputs are the momentum and charge of the track with the highest
center-of-mass momentum, and the outputs of secondary networks, trained
with Monte Carlo samples to identify primary leptons, kaons, and soft
pions. Based on the output of the neural network algorithm, events are
tagged as or and assigned to the NT1 (more certain tags)
or NT2 (less certain tags) category, or not tagged at all.
The tagging power of the NT1 and NT2 categories arises
primarily from soft pions and from recovering unidentified isolated
primary electrons and muons.
The time interval between the two decays is calculated
from the measured separation between the decay vertex of the
reconstructed meson () and the vertex of the
flavor-tagging meson () along the axis.
The calculation of includes an event-by-event
correction for the direction of the with respect to
the direction in the frame. We determine the position
of the vertex from
the charged tracks that constitute the candidate. The
decay vertex of the is determined by fitting the tracks not
belonging to the candidate to a common vertex. An
additional constraint on the tagging vertex comes from a pseudotrack
computed from the vertex and three-momentum,
the beam-spot (with a vertical size of 10 ), and the momentum. For 99.5% of the reconstructed events the r.m.s. resolution is 180. An accepted candidate must have converged fits
for the and vertices, a
error less than 2.5, and a measured . The fraction of events in data satisfying these requirements is
93%.
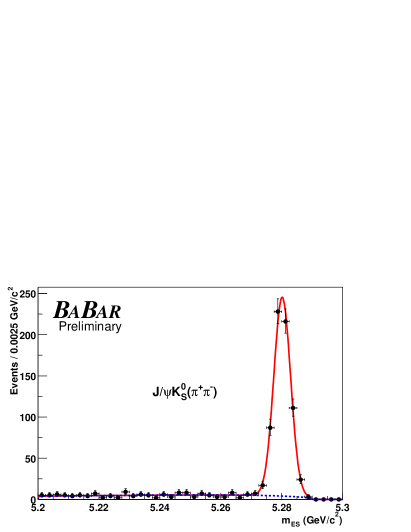
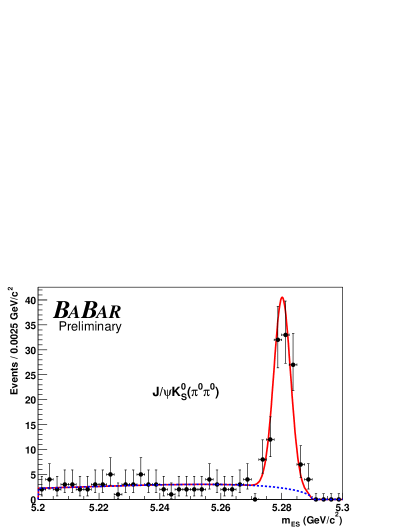
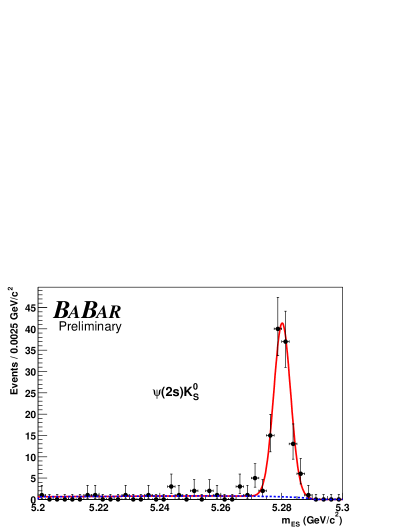
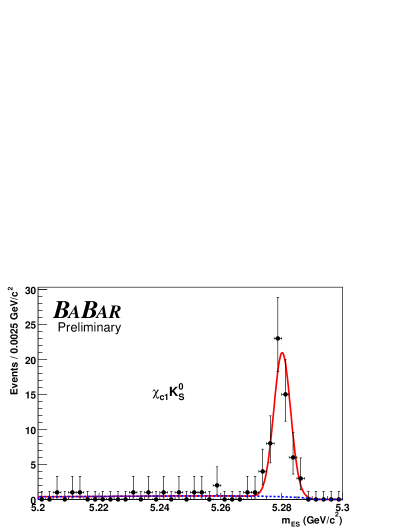
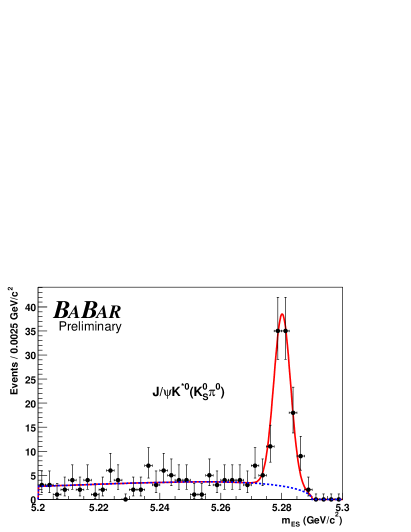
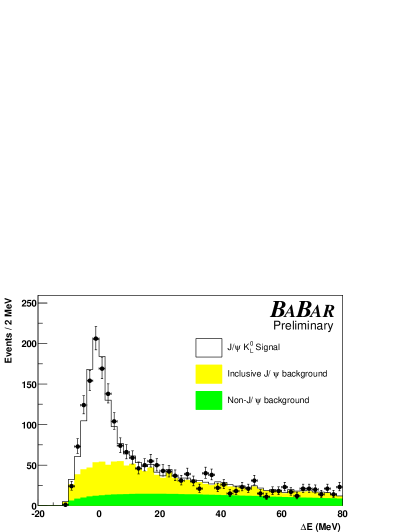
Figure 1: Distribution of for flavor tagged candidates
selected in the final states
a) ,
b) ,
c) ,
d) ,
e) , and
f) distribution of for flavor tagged
candidates.
In Table 1 we list the numbers of events and the signal
purities for the tagged candidates. The purities are
determined from fits to the (all modes except )
or ( mode) distributions in
data, or from Monte Carlo simulation ( mode).
Figure 1 shows the distributions for modes
containing a , and for the candidates. For modes containing a ,
we use a Monte Carlo simulation to estimate the fractions of
events in the signal peaks that are due to cross-feed from other decay
modes. The fractions of peaking background
range between % for and
% for .
For the decay mode, the composition, effective , and
distributions of the individual background sources are
determined either from Monte Carlo simulation (for decays to
) or from the sidebands in data (for fake
).
The tagging efficiencies for the four tagging categories are measured from data and summarized in
Table 2.
Table 1:
Number of tagged events, signal purity, and result of fitting for asymmetries in the full sample and in various subsamples, as well as
in the and charged control samples. Purity is the
fitted number of signal events divided by the total number of events in
the and signal region defined in the text. Errors are
statistical only.
Sample
Purity (%)
Full sample
1850
79
()
693
96
()
123
89
119
89
60
94
742
57
()
113
83
, , only
995
94
Lepton tags
176
97
Kaon tags
504
95
NT1 tags
117
95
NT2 tags
198
94
tags
471
94
tags
524
95
sample
17546
85
Charged sample
14768
89
Table 2: Average mistag fractions and mistag differences
, extracted for each
tagging category from the maximum-likelihood fit to the time
distribution for the fully-reconstructed sample ( and ). The figure of merit for tagging is the effective
tagging efficiency , where is
the fraction of events with a reconstructed tag vertex that is
assigned to the category. Uncertainties are statistical
only. The statistical error on is proportional to ,
where .
Category
(%)
(%)
(%)
(%)
Lepton
Kaon
NT1
NT2
All
We determine with a simultaneous unbinned maximum likelihood fit
to the distributions of the and tagged
samples. Equations 1 (with )
and 3 describe the distribution of the and samples, and the sample, respectively.
The distributions of the sample evolve
according to the known frequency for flavor oscillation in neutral
mesons. The observed amplitudes for the asymmetry in the
sample and for flavor oscillation in the sample
are reduced by the same factor due to mistags. The
distributions for the and samples are
both convolved with a common resolution function. Events are
assigned signal and background probabilities based on
the (all modes except ) or ()
distributions. Backgrounds are incorporated with an empirical
description of their evolution, containing prompt and
non-prompt components convolved with a separate resolution
function babar-stwob-prd .
The resolution function for the signal is
represented in terms of by
a sum of three Gaussian distributions with different means and widths:
(4)
For the core and tail Gaussians, we use two separate scale factors
and to multiply the measurement
uncertainty that is derived from the vertex fit for
each event. The scale factor for the tail component is
fixed to the value found in Monte Carlo simulation since it is strongly
correlated with the other resolution function parameters.
The core and tail Gaussian distributions are allowed to have nonzero
means to account for any daughters of long-lived charm particles included in
the vertex. In the resolution function, mean offsets
are multiplied by the event-by-event measurement uncertainty
to account for an observed correlation between the
mean of the distribution and the measurement
uncertainty in Monte Carlo simulation. The mean of
the core Gaussian is allowed to be different for each tagging
category. One common mean is used for the tail component. The outlier
Gaussian has a fixed width and no offset; it accounts for the fewer
than of events with incorrectly reconstructed vertices.
In simulated events, we find no significant difference between the
resolution function of the sample and of the
sample. This is expected, since the vertex
precision dominates the resolution. Hence, the same resolution
function is used for all modes.
Table 3: resolution function parameters for and
candidates extracted from the simultaneous
maximum-likelihood fit to the
distributions for the and samples.
3.0 (fixed)
(lepton)
(kaon)
8 ps (fixed)
(NT1)
(NT2)
A total of 35 parameters are varied in the final fit, including the
values of (1), the average mistag fraction
and the
difference between and mistags for each
tagging category (8), parameters for the signal resolution (8),
and parameters for background time dependence (6), resolution
(3), and mistag fractions (8). In addition, we allow (1), which is
determined from the events, to vary in the fit. The sign
of cannot be determined due to a twofold ambiguity in the
relative strong phases of the angular amplitudes dighedunietz . We use the
convention for the strong phases given in Appendix A.
The determination of the mistag fractions and resolution
function for the signal is dominated by the high-statistics sample.
The measured mistag fractions and the parameters of the signal
resolution function are listed in Tables 2 and 3.
Background parameters are determined from events with
(except and ). We fix
and PDG2000 . The largest correlation between
and any linear combination of the other free parameters is 0.14.
The simultaneous fit to all decay modes and the flavor decay modes
yields
Figure 2 shows the distributions and
asymmetries in yields between tags and tags for the
and samples as a function of ,
overlaid with the projection of the global likelihood fit result.
Repeating the fit with all parameters except fixed to their values at the global maximum likelihood, we attribute a
total contribution in quadrature of to the
error on due to the combined statistical uncertainties in
mistag rates, resolution, and background parameters.
The dominant sources of systematic error are
due to uncertainties in the level, composition, and asymmetry of
the background in the selected events (0.022),
limited Monte Carlo simulation statistics (0.014), and the assumed
parameterization of the resolution function (0.013),
due in part to residual uncertainties in the SVT alignment.
Uncertainties in and each contribute 0.010 to the
systematic error.
We have performed fits with and fixed to a series
of values around the corresponding world averages in order to determine
the dependence of on these two parameters and find that .
Figure 2: Number of candidates
(,
,
)
in the signal region a) with a tag and b)
with a tag , and c) the raw asymmetry
, as functions of . The
solid curves represent the result of the combined fit
to the full sample.
The shaded regions represent the background contributions.
Figures d) – f) contain the corresponding information for the
mode .
The likelihood is normalized to the total number of and tags.
The value of is independent of the individual
normalizations and therefore of the difference between the number of and tags. This difference is responsible for the small vertical
shift between the data points and the solid curves.
The large sample of reconstructed events allows a number of consistency
checks, including separation of the data by decay mode, tagging category,
and flavor. The results of fits
to these subsamples for the sample are shown in
Table 1 and found to be statistically consistent.
The fit results to the samples of non- decay modes
indicate no statistically significant asymmetry. The distributions and
asymmetry in yields for and
tags as a function of for the sample are
shown in Fig. 3. In addition,
we have made a number of detailed analyses of the expected distribution
of changes in that might result from reprocessing, in order to
account for the correlations between the two results from the same
sample. From these studies, we conclude that the observed difference in
the 1999–2000 result, before and after reprocessing, is equivalent to
about two standard deviations of the distribution of predicted changes
due to reprocessing for events that appear in common. The change
in the overall result in the 1999–2000 dataset, from to
, is consistent with the effects of both reprocessing and
event selection modifications.
With the theoretically preferred choice of the strong phases,
consistent with the hypothesis of the -quark helicity conservation in
the decay suzuki , the parameter is measured to
be . This value is 2.2
away from the one obtained using the relation .
The dominant contributions to the systematic error on are due
to uncertainties in the transversity amplitudes for the signal
() and the background ().
If we fix to 0.66, the measured value of
does not change. For the alternative set of strong phases,
, the sign of flips, yielding .
If the parameter in Eq. 1 is
allowed to float in the fit to the sample, which has high
purity and requires minimal assumptions on the effect of backgrounds,
the value obtained is . The sources of the systematic error are the same as for
the measurement with an additional contribution in quadrature of
0.012 from the uncertainty on the difference in the tagging
efficiencies for and tagged events. In this fit, the coefficient
of the term in Eq. 1 is
measured to be in agreement with
Table 1.
Figure 3: Number of candidates
in the signal region a) with a tag, , and b)
with a tag, , and c) the raw asymmetry
, as functions of . The
solid curves represent the result of the combined fit to all selected
events. The shaded regions represent the background
contributions.
This analysis supersedes our previous result babar-stwob-prl . It
provides the single most precise measurement of currently
available and is consistent with the range implied by measurements and
theoretical estimates of the magnitudes of CKM matrix
elements in the context of the Standard Model CKMconstraints .
We are grateful for the
extraordinary contributions of our PEP-II colleagues in
achieving the excellent luminosity and machine conditions
that have made this work possible.
The success of this project also relies critically on the
expertise and dedication of the computing organizations that
support BABAR.
The collaborating institutions wish to thank
SLAC for its support and the kind hospitality extended to them.
This work is supported by the
US Department of Energy
and National Science Foundation, the
Natural Sciences and Engineering Research Council (Canada),
Institute of High Energy Physics (China), the
Commissariat à l’Energie Atomique and
Institut National de Physique Nucléaire et de Physique des Particules
(France), the
Bundesministerium für Bildung und Forschung
(Germany), the
Istituto Nazionale di Fisica Nucleare (Italy),
the Research Council of Norway, the
Ministry of Science and Technology of the Russian Federation, and the
Particle Physics and Astronomy Research Council (United Kingdom).
Individuals have received support from
the A. P. Sloan Foundation,
the Research Corporation,
and the Alexander von Humboldt Foundation.
Appendix A Time-dependent asymmetry in )
The decay is described by three
amplitudes. In the transversity basis ref:dunietz ; ref:dighe , the
amplitudes , and have eigenvalues and ,
respectively.
corresponds to longitudinal polarization of the vector mesons, and
and correspond to parallel and perpendicular transverse
polarizations, respectively.
The relative phase between the parallel (perpendicular)
transverse amplitude and the longitudinal amplitude is given by
().
The transversity frame is defined
as the rest frame (see Fig. 4). The direction defines the negative
axis. The decay plane defines the plane, with oriented such
that . The axis is the normal to this plane, and the
coordinate system is right-handed. The transversity angles
and are defined as the polar and azimuthal angles of the
positive lepton from the decay; is the helicity
angle defined in the rest frame as the angle between the
direction and the direction opposite to the .
Figure 4: Definitions of transversity angles , , and
. The angles and are determined in the
rest frame. The angle is determined in the rest frame.
The time- and transversity-angle-dependent decay rate distributions
when the tagging meson is a are
given by
(5)
The coefficients , , , and , which
depend on the transversity angles and the transversity amplitudes
, are given by
(6)
with
(7)
References
(1)
N. Cabibbo, Phys. Rev. Lett. 10, 531 (1963);
M. Kobayashi and T. Maskawa, Prog. Th. Phys. 49, 652 (1973).
(2)
A.B. Carter and A.I. Sanda, Phys. Rev. D23, 1567 (1981);
I.I. Bigi and A.I. Sanda, Nucl. Phys. B193, 85 (1981).
(3)BABAR Collaboration, B. Aubert et al.,
Phys. Rev. Lett. 87, 091801 (2001).
(4)
BELLE Collaboration, K. Abe et al.,
Phys. Rev. Lett. 87, 091802 (2001).
(5)
OPAL Collaboration, K. Ackerstaff et al., Eur. Phys. Jour. C 5, 379 (1998);
CDF Collaboration, T. Affolder et al., Phys. Rev. D61, 072005 (2000);
ALEPH Collaboration, R. Barate et al., Phys. Lett. B492, 259 (2000);
BABAR Collaboration, B. Aubert et al., Phys. Rev. Lett. 86, 2515 (2001);
BELLE Collaboration, A. Abashian et al., Phys. Rev. Lett. 86, 2509 (2001).
(6)BABAR Collaboration, B. Aubert et al.,
BABAR-PUB-01/03, SLAC-PUB-9060, hep-ex/0201020,
submitted to Phys. Rev. D.
(7)BABAR Collaboration, B. Aubert et al.,
Nucl. Instr. and Methods A479, 117 (2002).
(8)http://wwwinfo.cern.ch/asd/geant4/geant4.html
(9)
See, for example, L. Wolfenstein, Eur. Phys. Jour. C 15, 115 (2000).
(10)BABAR Collaboration, B. Aubert et al.,
Phys. Rev. Lett. 87, 241801 (2001).
(11)
A.S. Dighe, I. Dunietz and R. Fleischer, Phys. Lett. B433, 147 (1998).
(12)
Particle Data Group, D.E. Groom et al., Eur. Phys. Jour. C 15, 1 (2000).
(13)
M. Suzuki, Phys. Rev. D64, 117503 (2001).
(14)
See, for example, F.J. Gilman, K. Kleinknecht and B. Renk,
Eur. Phys. Jour. C 15, 110 (2000).
(15)
I. Dunietz, H.R. Quinn, A. Snyder, W. Toki and H. J. Lipkin,
Phys. Rev. D 43, 2193 (1991).
(16)
A.S. Dighe, I. Dunietz, H.J. Lipkin and J.L. Rosner, Phys. Lett. B369, 144 (1996).