Study of the process in the energy region from 0.98 to 1.38 GeV.
Abstract
The cross section of the process was measured in the Spherical Neutral Detector experiment at the VEPP-2M collider in the energy region MeV. The measured cross section, together with the and cross sections obtained in other experiments, was analyzed in the framework of the generalized vector meson dominance model. It was found that the experimental data can be described by a sum of , mesons and two and resonances contributions, with masses , MeV and widths , MeV. The analysis of the invariant mass spectra in the energy region from 1100 to 1380 MeV has shown that for their description one should take into account the mechanism also. The phase between the amplitudes corresponding to the and intermediate states was measured for the first time. The value of the phase is close to zero and depends on energy.
I Introduction
The cross section of hadron production in the annihilation in the energy region GeV can be described within the vector meson dominance model (VDM) framework and is determined by the transitions of light vector mesons () into the final states. The light vector mesons have been studied rather well. They are quark-antiquark () bound states, and their masses, widths and main decays have been measured with high accuracy [1]. The cross section for hadron production above the resonance (– GeV) cannot be described in the conventional VDM framework (taking into account and mesons only) indicating the existence of states with vector meson quantum numbers and with masses of about 1450, 1650 MeV. Parameters of these states are not well established due to inaccurate and conflicting experimental data. The nature of these states is not clear either. In some reviews of experimental data they are considered as a mixture of with 4-quark and hybrid states [2, 3, 4, 5]. On the other hand, the experimental data do not contradict the hypothesis that these states have structure and are radial and orbital excitations of the light vector mesons [6, 7, 8]. In this context the main experimental task is the improvement of the accuracy of cross section measurement.
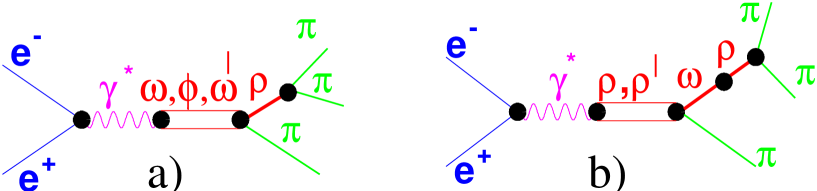
As was already mentioned, in the VDM framework the cross section of the process is determined by the amplitudes of vector meson () transitions into the final state: . The intermediate state dominates in these transitions [Fig.1(a)]. The other mechanism of transition is also possible via mixing: () [Fig.1(b)]. This effect was predicted in Ref.[9] and was observed in the SND (Spherical Neutral Detector) experiment in the energy range – MeV [10]. The studies of the cross section and invariant mass spectra above -meson production region provide information about excited states of vector meson and their interference.
The cross section in the energy region above meson and up to 2200 MeV has been studied in several experiments [11, 12, 13, 14, 15, 16], but none of them have covered the whole region. The SND study of this cross section in the range – 1380 MeV based on a part of collected data was already reported in Ref.[17]. Here we present the results obtained by using the total data sample. The present work includes both the total cross section and the dipion mass spectra studies.
II Experiment
The SND detector [18] ran from 1995 to 2000 at the VEPP-2M [19] collider in the energy range from 360 to 1400 MeV. The detector contains several subsystems. The tracking system includes two cylindrical drift chambers. The three-layer spherical electromagnetic calorimeter is based on NaI(Tl) crystals [20]. The muon/veto system consists of plastic scintillation counters and two layers of streamer tubes. The calorimeter energy and angular resolution depends on the photon energy as and The tracking system angular resolution is about and for azimuthal and polar angles respectively. The energy loss resolution in the drift chamber is about 30%. SND was described in details in Ref.[18].
In 1997 and 1999 the SND collected data in the energy region from 1040 to 1380 MeV with integrated luminosity about , in addition about was collected at MeV. The beam energy was calculated from the magnetic field value in the bending magnets and revolution frequency of the collider. The center of mass energy determination accuracy is about 0.1 MeV and the spread of the beam energy is from 0.2 to 0.4 MeV.
For the luminosity measurements, the processes and were used. In this work the luminosity measured by was used for normalization. The systematic error of the integrated luminosity determination is estimated to be 2%. Since luminosity measurements by and reveal a systematic spread of about 1%, this was added to the statistical error of the luminosity determination in each energy point. The statistical accuracy was better than 1%.
III Data analysis
A Selection of events
The data analysis and selection criteria used in this work are similar to those described in Ref.[21, 22]. During the experimental runs, the first-level trigger [18] selects events with energy deposition in the calorimeter more than 180 MeV and with two or more charged particles. During processing of the experimental data the event reconstruction is performed [18, 21]. For further analysis, events containing two or more photons and two charged particles with cm and cm were selected. Here is the coordinate of the charged particle production point along the beam axis (the longitudinal size of the interaction region depends on beam energy and varies from 2 to 2.5 cm); is the distance between the charged particle track and the beam axis in the plane. Extra photons in events can appear because of the overlap with the beam background or nuclear interactions of the charged pions in the calorimeter. Under these selection conditions, the background sources are , , , , processes and the beam background. We note that in the energy region above the -meson the process does not dominate. Even more, its cross section is several times lower than the cross section of the main background process .
To suppress the beam background, the following cuts on the angle between two charged particle tracks and energy deposition of the neutral particles were applied: , MeV.
To reject the background from the process, the following cuts were imposed: for each charged particle, at least for one of them, and . Here is an acollinearity angle in the azimuthal plane and is an average energy loss of a minimum ionizing particle. The last cut also suppresses the events.
To suppress the events an energy deposition in the calorimeter of the charged particles was required to be small enough: .
For events left after these cuts, a kinematic fit was performed under the following constraints: the charged particles are assumed to be pions, the system has zero total momentum, the total energy is , and the photons originate from the decays. The value of the function (Fig.2) is calculated during the fit. In events with more than two photons, extra photons are considered as spurious ones and rejected. To do this, all possible subsets of two photons were inspected and the one, corresponding to the maximum likelihood was selected. After the kinematic fit the following additional cuts were applied: ( is the number of detected photons), and the polar angle of at least one of the photons should satisfy to the following criterion: . The angular distributions of particles for the selected events are shown in Fig.16,16,16 and 16 while Fig.16 and Fig.16 demonstrate the photon energy distributions for the same events. The experimental and simulated distributions are in agreement.
B Background subtraction
The number of background events was estimated from the following formula:
| (1) |
where is a process number, is the cross section of the background process taking into account the radiative corrections, is the integrated luminosity, is the detection probability for the background process obtained from simulation under selection described above. The cross section was calculated for the case, when the photon has the energy above 10 MeV and is radiated at the angle more than . As it was mentioned above, the main source of background is the events of the process. Two mechanisms contribute to the total cross section of this process: and . It was shown in Ref.[23, 24] that the process dynamics can be described with the intermediate state. The SND studies of the process [25] agree with this conclusion. For background estimation the and cross sections measured in SND experiments were used [25, 26]. To obtain the detection probability of the events, the simulation with the intermediate state was used. The numbers of events (after background subtraction) and background event numbers are shown in Table I. Here is a photon emitted by initial particles.
To estimate the accuracy of background events number determination the distribution (Fig.2) was studied. The experimental distribution in the range was fitted by a sum of background and signal. The distribution for background events was taken from the simulation and that for events was obtained by using data collected in the vicinity of the meson peak [21, 22] (the distribution actually does not change in the interval – 1.4 GeV). As a result, the ratio between the number of background events obtained from the fit and the number calculated according to (1) was found to be . Using this ratio, the accuracy of the determination of the number of background events can be estimated to be about 40%.
C Detection efficiency
The detection efficiency of the process was obtained from simulation. The detection efficiency for events without -quantum radiation depends on the center of mass energy and varies from 0.15 to 0.16 in the energy range – 1380 MeV. This dependence can be approximated by a linear function. The detection efficiency dependence on the radiated photon energy is shown in Fig.16 .
Inaccuracies in the simulation of the , , and distributions lead to an error in the average detection efficiency determination. To take into account these uncertainties, the detection efficiency was multiplied by correction coefficients, which were obtained in the following way [21]. The experimental events were selected without any conditions on the parameter under study, using the selection parameters uncorrelated with the studied one. The same selection criteria were applied to simulated events. Then the cut was applied to the parameter and the correction coefficient was calculated:
| (2) |
where and are the number of events in experiment and simulation respectively selected without any cuts on the parameter under study; and are the number of events in experiment and simulation when the cut on the parameter was applied. As a rule, the error in the coefficient determination is connected with the uncertainty of background subtraction. This systematic error was estimated by varying other selection criteria. The correction coefficient , due to the uncertainty in the distribution simulation, was obtained using data collected in the vicinity of the resonance [21, 22]. The correction which takes into account the inaccuracy of simulation of extra photons is , and that correction for the inaccuracy of simulation energy losses is . The overlap of the beam background with the events containing charged particles can result in track reconstruction failure and a decrease of detection efficiency. To take into account this effect, background events (experimental events collected when the detector was triggered with an external generator) were mixed with the simulated events. It was found that the detection efficiency decreased by about 3% and therefore the correction coefficient was used.
The total correction used in this work is equal to:
The systematic error of detection efficiency determination is 5%. The detection efficiency after the applied corrections is shown in Table I.
IV Theoretical framework
In the VDM framework the cross section of the process is
| (3) |
where and are the and momenta, and are and invariant masses. The formfactor of the transition has the form
| (4) |
Here
where is the invariant mass, and are the neutral and charged pion masses, denotes the sign of a -meson ( pair) charge. The and transition coupling constants could be determined in the following way:
Experimental data [22] do not contradict the equality of the coupling constants . In this case the and meson widths are related as follows:
| (5) |
In the subsequent analysis we assume that , and the width values were taken from SND measurements [22] MeV, MeV. The neutral and charged mesons masses were assumed to be equal and were also taken from the SND measurements [22] MeV.
The second term in (4) takes into account the mixing [9]. The polarization operator of this mixing satisfies [27, 28], where
| (6) |
so we assumed in the subsequent analysis.
The process cross section can be written in the following way:
| (7) |
where
| (8) |
| (9) |
| (10) |
The phase space factors , and were calculated as follows:
| (11) |
| (12) |
| (13) |
Amplitudes of the and transitions have the form
| (14) |
| (15) |
where
Here denotes the final state of the vector meson decay. () are relative interference phases between vector mesons and (), so and . The coupling constants are determined through the decay branching ratios in the following way:
| (16) |
| (17) |
| (18) |
where is the -meson momentum.
V Cross section measurement
From the data in Table I the cross section of the process can be calculated as follows:
| (19) |
where is the number of selected events, is the integrated luminosity, is the function which takes into account the detection efficiency and radiative corrections for initial state radiation:
| (20) |
Here is the emitted photon energy, is the electron “radiator” function [29], is the detection efficiency of the process as a function of the emitted photon energy and the energy in the center of mass system, is the theoretical energy dependence of the cross section given by equation (7).
To obtain the values of at each energy point, the visible cross section of the process
was fitted by theoretical energy dependence
The following logarithmic likelihood function was minimized:
where is the energy point number, is the error of the visible cross section .
In a good approximation the contributions and in expression (7) can be omitted, as they are rather small ( 5 – 10 %) and actually do not modify the shape of energy dependence. So we assumed that . The amplitude of the transition (14) was written as
| (21) |
where
The following form of the energy dependence of the and total width was used
In the fit the meson parameters (mass, width, branching ratios of main decays ) were fixed at their PDG values [1], and the meson mass and width were fixed at the values measured by SND [21]. It was shown [21] that the parameter and the cross section value at MeV have a rather large model error, due to the uncertainty in the choice of the phase and the value of additional, besides the and resonances, contributions to the transition amplitude. Therefore we have taken the as a free parameter in the fit and the visible cross section presented in this work was fitted together with the visible cross section from Ref.[21]. The masses and width of the , resonances were free parameters of the fit. Phases can deviate from or and their values can have energy dependence due to mixing between vector mesons. For example, the phase was found to be close to [21] and agree with the prediction [30] , where the function is defined in Ref.[30]. There are no theoretical predictions of and values and their energy dependences, and we have considered and as free parameters, i.e. and can be equal to 0 or 180 degrees. The values were obtained by approximation of the experimental data in several models:
-
1.
-
2.
-
3.
is a free parameter
-
4.
,
-
5.
,
-
6.
, is a free parameter.
The values of significantly depend on the applied model in the energy range 1040 – 1090 MeV, and at MeV the values differ by a factor 10 for different models. Above 1090 MeV the model dependence is negligible. Using obtained values, the cross section of the process was calculated (Table.II ). The cross section in the energy region – MeV has changed in comparison with the values reported in Ref.[21]. In Ref.[21] contributions from the excitations were taken into account as a constant amplitude. In present analysis the more realistic model was used and it caused a change in the cross section. The systematic error of the cross section determination at each energy point is equal to
Here and are systematic uncertainties in the detection efficiency and integrated luminosity, which are common for all energy points. The model uncertainty is significant in the region – MeV and was obtained from the difference of values determined for the six models mentioned above. The error takes into account the inaccuracy () of background subtraction and depends on the beam energy.
The obtained cross section differs by about % from the previous SND result [17] (Fig.16), which claimed a systematic error about 12%. This difference is attributed to the fact that in the new analysis we implemented corrections to the detection efficiency (described in III.C) which were not used in the previous one. The comparison of the measured cross section with the other experimental results is presented in Fig.16.
VI Approximation of the mass spectra.
The contribution of the mechanism to the process is seen as the interference in the invariant mass spectra. To analyze the dipion mass spectra, the formfactor (expression (4)) was presented in the following form:
| (22) |
where is the absolute value, and is the phase of the ratio . The energy dependence can be obtained from the approximation of the experimental invariant mass spectra as described below. The value was calculated from the equation
| (23) |
which follows from expressions (8-10). The cross section was obtained from SND measurements of the cross section [26]: , is the cross section measured here (Table II).
The real part of the polarization operator is proportional to . The world average value for this branching ratio is [1]. The results of measurements in different experiments deviate from each other by a factor of more than 1.5 . For example, OLYA detector reported the value [31], while CMD-2 experiment reported [32]. So was considered as a free parameter of the fit.
For the mass spectra analysis the events selected in the energy region MeV were used. For each energy point the mass spectra were formed and arranged in histograms with a dipion mass range from 280 to 1240 MeV and bin width of 40 MeV. The invariant mass values were calculated after the kinematic reconstruction. The expected background was subtracted bin by bin while forming the desired histograms.
The analysis of the dipion mass spectra was performed in a way similar to this described in Ref.[22]. The experimental spectra were fitted with theoretical distributions. Using the cross section (3) and formfactor (22), the theoretical spectra were calculated:
| (24) |
where is the bin number, MeV is a half of the bin width, is the central value of the invariant mass in the th bin, is a normalizing coefficient. These spectra were corrected taking into account the detection efficiency for the th bin and a probability for the event belonging to the th bin to migrate to the th bin due to the finite detector resolution
| (25) |
Here is a radiative correction and is a normalizing coefficient. The values of , and were obtained from simulation.
The function to be minimized was
| (26) |
Here is the normalized experimental mass distribution (histogram); include the uncertainties and of the experimental and theoretical distributions ().
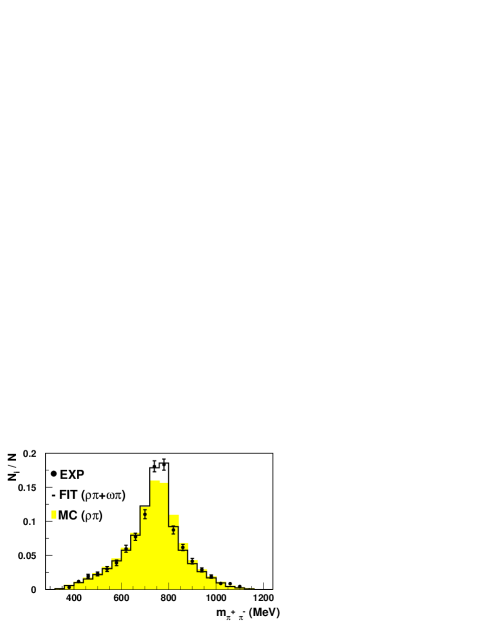
During the fitting the phase at each energy point and were free parameters. Values of the phase were allowed to vary from to . The obtained values are presented in Table III. The systematic inaccuracy of is about and is connected with a systematic error in determination, which in its turn is about due to uncertinities of and measurements. The decay probability was found to be equal to , where the systematic error is also related to the uncertainty of the determination. In Figs.16 and 16 the experimental mass spectra together with the theoretical distributions obtained from the fit and the spectra expected from the only intermediate state model are shown. In the mass spectra the peak in the meson region is clearly seen. The distribution of the invariant mass of the pairs does not contradict to the intermediate state model at the level of our statistical accuracy. These figures demonstrate that together with the intermediate state the intermediate state also contributes to the process .
VII The total cross section analysis.
The analysis of the cross section energy dependence obtained here (Table II) met the following difficulties:
-
1.
The cross section was measured in the limited energy region and it is necessary to use the results of other experiments. As a result, because of different systematic effects the problem of matching cross sections of various measurements arises;
-
2.
In the ideal case, to obtain the vector mesons parameters, the combined fit of all cross sections is necessary;
The cross section measured in this work was analyzed together with the DM2 results of the and [16] cross sections measurements. The cross section was fitted by the expression (7). The amplitude was written in the following way:
| (27) | |||
| (28) |
where is the resonance number. The following form of the energy dependence of the total widths was used:
| (29) |
| (30) |
Here is the phase space factor of the final state [7]. The probabilities of the decays into and were calculated in the following way:
| (31) |
Here . In the total width energy dependence the contributions from the following final states were neglected: , , , . The meson parameters were fixed according to the PDG table values [1]. The , and parameters of the and decays were fixed at the values obtained by SND [21], while was a free parameter of the fit. As it was mentioned above, the phases can differ from 0 or 180 degrees and be energy dependent. Here we consider only as a free parameter, i.e. or .
For the amplitude two models with different energy behavior of the phase were used. Their parameters were obtained by fitting the cross section measured by SND [26] and CLEO2 data on decay [24] (Fig.16). The first model was suggested in Ref. [26]. It assumes that only the and resonances contribute to the cross section (i.e. ), at that the following parameters are used: the coupling constant GeV-1,-mass MeV, width GeV, phase and nb. The total width energy dependence is taken to be the following
| (32) |
where is the pion momentum. The second model assumes that three , and resonances contribute to the cross section (i.e. ). In this case the parameters of the model are: GeV-1, MeV, MeV, , nb, and MeV, MeV, , nb. The and total width energy dependence is taken in the form
| (33) |
In both models the meson energy dependent width has the form:
| (34) |
The process cross section was written in the following way:
| (35) |
The cross sections of the and processes measured by SND and DM2 were fitted together. The function to be minimized was
where
Here are the experimental cross sections, are their uncertainties, and are coefficients which take into account the relative systematic bias between SND and DM2 data. The cross section measured by SND (Table II) was fitted in the energy region from 980 to 1380 MeV. The errors include the statistical and the following systematic errors: due to the inaccuracy of the background subtraction and due to model dependence. Thus . The fitting was performed with , , , and as free parameters.
To estimate the possible relative bias between SND and DM2 data, the considered as a free parameter as well. It was found that . To estimate the possible biases independently the cross sections of the process (Fig.16) measured by SND [26] and DM2 [33], and cross section calculated, by using CVC hypothesis, from the CLEO2 result on the decay [24] were also studied. The cross section was measured by DM2 by using final state, i.e. as in the case of the and final states the events containing both tracks and photons were detected. This gives us a hope that all these DM2 measurements have similar systematic errors. The SND and CLEO2 data agree rather well. The DM2 and CLEO2 data points are strongly overlapped. The average ratio of the CLEO2 and DM2 cross sections is 1.54, and this agrees with . In further analysis we assumed and fixed these coefficients at 1 or 1.54.
It is generally accepted that two -like resonances and exist [1, 16]. The first fit was done by assuming that the number of the resonances is equal to 3 and without taking into account the mechanism (i.e., and were assumed). The obtained parameters of the resonances are shown in Table IV. The differs from zero by about one standard deviation. If in this approximation one takes into account the contribution from the mechanism, then nb, and the parameters of the , resonances deviate from their previous values within their statistical errors. So in the further analysis the parameter was fixed to zero and for the , resonances a more usual notation , was used.
The further fittings were performed under the following assumptions:
-
1.
the contribution from the was not taken into account, i.e. , .
-
2.
the first model for the amplitude was used;
-
3.
the second model for the amplitude was used;
The results of the fits are shown in Tables V, VI and Fig.16, 16. In case when no relative shift between SND and DM2 experiments was assumed, the value of is rather large. The obtained parameters depend weakly on the applied model.
VIII Discussion
The fit results revealed that the and cross sections can be described by a sum of contributions of the and mesons and two additional , resonances. The following parameters were obtained (Table V):
The decays mostly into : and its electronic width is eV. The parameters were found to be:
The resonance decays with approximately equal probabilities into and : , and it has the electronic width eV. The second errors shown are due to the uncertainty of the amplitude choice and possible relative bias between different experiments.
The rather large electronic widths obtained for the and resonances may represent some challenge for theory. In the framework of the nonrelativistic quark model one can obtain the following ratios:
where is the radial wave function of the bound state at the origin. For the quark-antiquark potentials used to describe heavy quarkonia, such ratios are always less than unity [34]. This is also confirmed experimentally. For example, analogous ratios for and states are: , , . Of course, the nonrelativistic quark model is unreliable for light-quark -states. But, surprisingly, it gives quite reasonable description of the ground state , and meson leptonic widths, which do not change radically in the framework of the “relativized” quark model [35]. For comparison, the nonrelativistic quark model predictions for the two photon widths of the light pseudoscalar mesons are dramatically wrong and only the “relativized” model gives reasonable result [36]. More precise data and more deep analysis is required to draw strict conclusions.
The , widths obtained from the fit are rather large in comparison with their masses (this result agrees with experimental data analysis reported in [6, 7, 8]). In this context the question whether the sum of Breit-Wigner amplitudes is an adequate description of the cross sections in the energy region MeV becomes actual.
The presented analysis of the -like excited states is somewhat speculative since we had to assume a rather large systematic bias between SND and DM2 measurements.
The was found to be equal
This agrees with the results of SND studies of the cross section in the vicinity of the resonance nb [21]. The slight deviations in the central value and the error can be related to the difference in descriptions of the , contributions used in these works. The fit was performed by assuming [30]. If is considered to be a free parameter of the fit, then its value is:
which agrees with [30].
The relative phase between and amplitudes and was obtained from the invariant mass spectra analysis in the energy region from 1100 to 1380 MeV (Table III, Fig.17). The phase can be also calculated from the total cross section fit results (Table V). Figure 17 demonstrates that the phase energy dependence cannot be described if the model with is used. On the other hand, the model in which gives satisfactory description of the data. The decay probability was found to be:
This result does not contradict both to OLYA measurements [31] and world average value [1], as well as to CMD2 result [32]. Using the results of the total cross section and invariant mass spectra analysis, the contribution of the mechanism to the total cross section was estimated to be in the energy range – 1380 MeV.
For the data analysis the model which takes into account only and mechanisms were used. The , intermediate state, as well as the and meson interaction in the final state [27] are also possible. Taking into account these contributions in the fit can change the values, but the statistics collected in SND experiments is not enough for studies of such contributions. In addition, the parameters of the resonances are poorly established. In the energy dependence of the total width the contributions from the following decays were not taken into account: , . The mixing between vector mesons excitations was neglected. It is possible that a more detailed model for the and amplitudes can change the calculated energy dependence of the phase presented in Fig.17.
At present in BINP (Novosibirsk) the VEPP-2000 collider with energy range from 0.36 to 2 GeV and luminosity up to cm-2s-1 (at GeV) is under construction [37]. The two detectors SND [38] and CMD-2M [39] are being upgraded for experiments at this new facility. In these experiments the increase of the accuracy in determination of cross sections is expected in the energy range MeV. We hope that the new data will improve the understanding of the nature of , and resonances, as well as their decay mechanisms and theoretical methods of their description.
IX Conclusion
The cross section of the process was measured in the SND experiment at the VEPP-2M collider in the energy region – 1380 MeV. Due to the increased luminosity, and improved corrections for analysis losses and initial state radiation, the cross section measurements reported here (Table II) supersede those in Ref.[17] and Ref.[21]. The measured cross section was analyzed in the framework of the generalized vector meson dominance model together with the and cross sections obtained by DM2. It was found that the experimental data can be described with a sum of contributions of , mesons and two and resonances with masses , MeV and widths , MeV. The analysis of the dipion mass spectra in the energy region from 1100 to 1380 MeV has shown that for their description the mechanism is required. The phase between and processes amplitudes was measured for the first time. Its value is close to zero and depends on energy.
acknowledgments
The authors are grateful to N.N.Achasov, S.I.Eidelman and A.A.Kozhevnikov for useful discussions. The present work was supported in part by grant no. 78 1999 of Russian Academy of Science for young scientists and grant STP “Integration” A0100.
REFERENCES
- [1] Particle Data Group, D.E. Groom, et al., Eur.Phys.J. C 15, 1 (2000)
- [2] A. Donnachie, Yu.S. Kalashnikova, Z.Phys. C 59, 621 (1993)
- [3] A. Donnachie, Yu.S. Kalashnikova, Z.Phys. C 60, 187 (1993)
- [4] A.B. Clegg, A. Donnachie Z.Phys. C 62, 455 (1994)
- [5] A. Donnachie, Yu.S. Kalashnikova, Phys. Rev. D 60, 114011 (1999)
-
[6]
N.N. Achasov, A.A. Kozhevnikov, Phys. Rev. D 55,
2663 (1997);
Yad. Fiz. 60, 1131 (1997) [Phys. At. Nucl. 60, 1011 (1997)] -
[7]
N.N. Achasov, A.A. Kozhevnikov, Phys. Rev. D 57,
4334 (1998)
Yad. Fiz. 60, 2212 (1997) [Phys. At. Nucl. 60, 2029 (1997)] -
[8]
N.N. Achasov, A.A. Kozhevnikov, Phys. Rev. D 62,
117503 (2000)
Yad. Fiz. 65, 158 (2002) [Phys. At. Nucl. 65, 155 (2002)]. -
[9]
N.N. Achasov, A.A. Kozhevnikov, and G.N. Shestakov, Phys. Lett. 50B,
448 (1974) .
N.N. Achasov, N.M. Budnev, A.A. Kozhevnikov, and G.N. Shestakov, Yad. Fiz. 23, 610 (1976) [Sov. J. Nucl. Phys. 23, 320 (1976)];
N.N. Achasov and G.N. Shestakov, Fiz. Elem. Chastits. At. Yadra 9, 48 (1978) - [10] M.N. Achasov et al., Preprint Budker INP 98-65 Novosibirsk, 1998
- [11] G. Cosme et al., Nuc. Phys. B 152, 215 (1979)
- [12] B. Esposito et al., Lett. Nuovo Cim. 28, 195 (1980)
- [13] C. Bacci et al., Nuc. Phys. B 184, 31 (1981)
- [14] B. Delcourt et al., Phys. Lett 113B, 93 (1982)
- [15] S.I. Dolinsky et al., Phys. Rep. 202, 99 (1991)
- [16] A. Antonelli et al., Z. Phys., C 56, 15 (1992)
- [17] M.N. Achasov et al., Phys. Lett. B 462, 365 (1999)
- [18] M.N. Achasov et al., Nucl. Instr. and Meth. A 449, 125 (2000)
- [19] A.N. Skrinsky, in Proc. of Workshop on physics and detectors for DANE, Frascati, Italy, April 4-7, 1995, p.3
- [20] M.N. Achasov et al., CALORIMETRY IN HIGH ENERGY PHYSICS: Proceedings. Edited by Gaspar Barreira, Bernardo Tome, Agostinho Gomes, Amelia Maio, Maria J. Varanda. World Scientific, 2000. 863p.
- [21] M.N. Achasov et al., Phys. Rev. D 63, 072002 (2001)
- [22] M.N. Achasov et al., hep-ex/0106048, accepted for publication in Phys. Rev. D
- [23] R.R. Akhmetshin et al., Phys. Lett. B 466, 392 (1999)
- [24] K.W. Edwards et al., Phys. Rev. D 61, 072003 (2000)
- [25] M.N. Achasov et al., Preprint, Budker INP 2001-34, Novosibirsk, 2001 (in Russian)
- [26] M.N.Achasov et al., Phys. Lett. B 486, 29 (2000)
-
[27]
N.N. Achasov and A.A. Kozhevnikov, Phys. Rev. D 49, 5773 (1994)
Yad. Fiz. 56, 191 (1993) [ Phys. Atom. Nucl. 56, 1261 (1993)]
Int. J. Mod. Phys. A 9, 527 (1994) -
[28]
N.N. Achasov and A.A. Kozhevnikov, Yad. Fiz. 55, 809 (1992)
[Sov. J. Nucl. Phys. 55, 449 (1992)];
Int. J. Mod. Phys. A 7, 4825 (1992). - [29] E.A. Kuraev, V.S. Fadin, Yad. Fiz. 41, 733 (1985) [Sov. J. Nucl. Phys. 41, 466 (1985)]
-
[30]
N.N. Achasov, A.A. Kozhevnikov, Phys. Rev. D 61 054005 (2000)
Yad. Fiz. 63, 2029 (2000) [ Phys. Atom. Nucl. 63, 1936 (2000)]
- [31] L.M. Barkov et al., Nuc. Phys. B 256 365 (1985)
- [32] R.R. Akhmetshin et al., hep-ex/0112031
- [33] D.Bisello et al., Nucl. Phys. Proc. Suppl. 21 111 (1991)
- [34] C. Quigg and J.L. Rosner, Phys. Rep. 56, 167 (1979)
- [35] C.R. Munz, J. Resag, B.C. Metsch, H.R. Petry, Nucl. Phys. A578 418 (1994)
- [36] B.C. Metsch, H.R. Petry, Acta. Phys. Polon. B271 3307 (1996)
- [37] Yu.M.Shatunov et al, Project of a new electron-positron collider VEPP-2000, in Proc. of the 2000 European Particle Acc. Conf., Vienna (2000), p.439
- [38] G.N.Abramov, et al., SND Upgrade, Invited talk at “e+e- Physics at Intermediate Energies Workshop”, SLAC, Stanford, California, April 30 - May 2, 2001; e-print hep-ex/0105093
- [39] V.M. Aulchenko et al., Preprint Budker INP 2001-45 Novosibirsk, 2001 (in Russian)
| (MeV) | (nb-1) | ||||
|---|---|---|---|---|---|
| 980 | 129 | 0.150 | 0.858 | 25918 | 31 |
| 1040 | 69 | 0.153 | 11.706 – 131.646 | 9010 | 41 |
| 1050 | 84 | 0.149 | 3.762 – 5.281 | 7510 | 41 |
| 1060 | 279 | 0.150 | 1.808 – 2.018 | 19616 | 82 |
| 1070 | 98 | 0.150 | 1.269 – 1.327 | 61 9 | 21 |
| 1080 | 578 | 0.150 | 1.060 – 1.102 | 32523 | 226 |
| 1090 | 95 | 0.150 | 0.985 – 1.002 | 54 8 | 31 |
| 1100 | 445 | 0.152 | 0.928 | 25518 | 143 |
| 1110 | 90 | 0.151 | 0.915 | 7011 | 21 |
| 1120 | 306 | 0.150 | 0.889 | 21317 | 113 |
| 1130 | 113 | 0.151 | 0.889 | 7610 | 41 |
| 1140 | 289 | 0.151 | 0.901 | 17716 | 92 |
| 1150 | 69 | 0.152 | 0.873 | 59 9 | 21 |
| 1160 | 320 | 0.152 | 0.877 | 21717 | 112 |
| 1180 | 423 | 0.152 | 0.884 | 30221 | 123 |
| 1190 | 172 | 0.152 | 0.872 | 12512 | 41 |
| 1200 | 439 | 0.153 | 0.883 | 29019 | 132 |
| 1210 | 151 | 0.153 | 0.871 | 12912 | 41 |
| 1220 | 343 | 0.153 | 0.947 | 28219 | 92 |
| 1230 | 141 | 0.153 | 0.871 | 10311 | 41 |
| 1240 | 378 | 0.153 | 0.871 | 25017 | 61 |
| 1250 | 209 | 0.154 | 0.871 | 16514 | 61 |
| 1260 | 163 | 0.154 | 0.867 | 12913 | 51 |
| 1270 | 241 | 0.154 | 0.868 | 17515 | 82 |
| 1280 | 229 | 0.154 | 0.872 | 16913 | 82 |
| 1290 | 272 | 0.155 | 0.866 | 19915 | 92 |
| 1300 | 272 | 0.155 | 0.867 | 18814 | 62 |
| 1310 | 202 | 0.155 | 0.874 | 15314 | 51 |
| 1320 | 236 | 0.155 | 0.873 | 17414 | 72 |
| 1330 | 293 | 0.156 | 0.876 | 20615 | 82 |
| 1340 | 439 | 0.156 | 0.874 | 28120 | 122 |
| 1350 | 257 | 0.156 | 0.876 | 16914 | 62 |
| 1360 | 625 | 0.156 | 0.872 | 39922 | 193 |
| 1370 | 256 | 0.156 | 0.879 | 17915 | 72 |
| 1380 | 480 | 0.157 | 0.880 | 27818 | 164 |
| (MeV) | (nb) | (nb) | (nb) | (nb) | (nb) |
|---|---|---|---|---|---|
| 980.00 | 15.58 1.07 | 0.00 | 0.00 | 0.84 | 0.84 |
| 984.02⋆ | 17.30 0.80 | 0.00 | 0.00 | 0.86 | 0.86 |
| 984.21⋆ | 18.10 0.90 | 0.00 | 0.00 | 0.91 | 0.91 |
| 1003.71⋆ | 37.60 1.40 | 0.00 | 0.00 | 1.88 | 1.88 |
| 1003.91⋆ | 36.20 1.30 | 0.00 | 0.00 | 1.81 | 1.81 |
| 1010.17⋆ | 68.50 2.40 | 0.00 | 0.00 | 3.42 | 3.42 |
| 1010.34⋆ | 69.50 2.50 | 0.00 | 0.00 | 3.48 | 3.48 |
| 1015.43⋆ | 220.00 6.50 | 0.00 | 0.00 | 11.00 | 11.00 |
| 1015.75⋆ | 243.10 7.50 | 0.00 | 0.00 | 12.16 | 12.16 |
| 1016.68⋆ | 358.9010.60 | 0.00 | 0.00 | 17.94 | 17.94 |
| 1016.78⋆ | 353.6011.10 | 0.00 | 0.00 | 17.68 | 17.68 |
| 1017.59⋆ | 493.6014.90 | 0.00 | 0.00 | 24.68 | 24.68 |
| 1017.72⋆ | 515.0015.30 | 0.00 | 0.00 | 25.75 | 25.75 |
| 1018.62⋆ | 664.2013.10 | 0.00 | 0.00 | 33.21 | 33.21 |
| 1018.78⋆ | 658.6011.60 | 0.00 | 0.00 | 32.93 | 32.93 |
| 1019.51⋆ | 667.0011.80 | 0.00 | 0.00 | 33.35 | 33.35 |
| 1019.79⋆ | 595.5014.10 | 0.00 | 0.00 | 29.77 | 29.77 |
| 1020.43⋆ | 471.2015.50 | 0.00 | 0.00 | 23.56 | 23.56 |
| 1020.65⋆ | 399.8014.50 | 0.00 | 0.00 | 19.99 | 19.99 |
| 1021.41⋆ | 270.10 9.90 | 0.00 | 0.00 | 13.51 | 13.51 |
| 1021.68⋆ | 217.40 8.50 | 0.00 | 0.00 | 10.87 | 10.87 |
| 1022.32⋆ | 142.90 6.10 | 0.00 | 0.00 | 7.14 | 7.14 |
| 1023.27⋆ | 92.20 3.40 | 0.00 | 0.00 | 4.61 | 4.61 |
| 1027.52⋆ | 15.33 0.73 | 0.57 | 0.00 | 0.77 | 0.96 |
| 1028.23⋆ | 10.81 0.62 | 0.52 | 0.00 | 0.54 | 0.75 |
| 1033.58⋆ | 1.75 0.11 | 0.47 | 0.00 | 0.09 | 0.48 |
| 1033.84⋆ | 1.43 0.12 | 0.41 | 0.00 | 0.07 | 0.42 |
| 1039.59⋆ | 0.37 0.04 | 0.31 | 0.00 | 0.02 | 0.31 |
| 1039.64⋆ | 0.37 0.03 | 0.31 | 0.00 | 0.02 | 0.31 |
| 1040.00 | 0.40 0.04 | 0.33 | 0.00 | 0.02 | 0.33 |
| 1049.60⋆ | 1.12 0.12 | 0.20 | 0.00 | 0.06 | 0.21 |
| 1049.81⋆ | 1.14 0.15 | 0.20 | 0.00 | 0.06 | 0.21 |
| 1050.00 | 1.37 0.18 | 0.23 | 0.00 | 0.07 | 0.24 |
| 1059.52⋆ | 1.75 0.21 | 0.09 | 0.00 | 0.09 | 0.13 |
| 1059.66⋆ | 1.84 0.28 | 0.09 | 0.00 | 0.09 | 0.13 |
| 1060.00 | 2.46 0.20 | 0.14 | 0.00 | 0.13 | 0.19 |
| 1070.00 | 3.21 0.47 | 0.07 | 0.04 | 0.17 | 0.19 |
| 1080.00 | 3.46 0.24 | 0.07 | 0.09 | 0.19 | 0.22 |
| 1090.00 | 3.84 0.57 | 0.03 | 0.07 | 0.21 | 0.22 |
| 1100.00 | 4.07 0.29 | 0.00 | 0.09 | 0.22 | 0.24 |
| 1110.00 | 5.66 0.89 | 0.00 | 0.05 | 0.31 | 0.31 |
| 1120.00 | 5.19 0.42 | 0.00 | 0.11 | 0.28 | 0.30 |
| 1130.00 | 5.04 0.67 | 0.00 | 0.10 | 0.27 | 0.29 |
| 1140.00 | 4.50 0.40 | 0.00 | 0.09 | 0.24 | 0.26 |
| 1150.00 | 6.40 0.98 | 0.00 | 0.10 | 0.35 | 0.36 |
| 1160.00 | 5.12 0.39 | 0.00 | 0.10 | 0.28 | 0.29 |
| 1180.00 | 5.30 0.37 | 0.00 | 0.09 | 0.29 | 0.30 |
| 1190.00 | 5.44 0.53 | 0.00 | 0.08 | 0.29 | 0.30 |
| 1200.00 | 4.89 0.32 | 0.00 | 0.09 | 0.26 | 0.28 |
| 1210.00 | 6.39 0.60 | 0.00 | 0.08 | 0.34 | 0.35 |
| 1220.00 | 5.68 0.41 | 0.00 | 0.07 | 0.31 | 0.32 |
| 1230.00 | 5.48 0.59 | 0.00 | 0.09 | 0.30 | 0.31 |
| 1240.00 | 4.96 0.34 | 0.00 | 0.04 | 0.27 | 0.27 |
| 1250.00 | 5.91 0.51 | 0.00 | 0.08 | 0.32 | 0.33 |
| 1260.00 | 5.92 0.60 | 0.00 | 0.10 | 0.32 | 0.33 |
| 1270.00 | 5.41 0.47 | 0.00 | 0.10 | 0.29 | 0.31 |
| 1280.00 | 5.50 0.43 | 0.00 | 0.10 | 0.30 | 0.31 |
| 1290.00 | 5.46 0.42 | 0.00 | 0.10 | 0.29 | 0.31 |
| 1300.00 | 5.13 0.40 | 0.00 | 0.07 | 0.28 | 0.29 |
| 1310.00 | 5.59 0.52 | 0.00 | 0.07 | 0.30 | 0.31 |
| 1320.00 | 5.44 0.44 | 0.00 | 0.09 | 0.29 | 0.31 |
| 1330.00 | 5.17 0.38 | 0.00 | 0.08 | 0.28 | 0.29 |
| 1340.00 | 4.70 0.34 | 0.00 | 0.08 | 0.25 | 0.27 |
| 1350.00 | 4.82 0.41 | 0.00 | 0.07 | 0.26 | 0.27 |
| 1360.00 | 4.68 0.27 | 0.00 | 0.09 | 0.25 | 0.27 |
| 1370.00 | 5.09 0.43 | 0.00 | 0.08 | 0.27 | 0.29 |
| 1380.00 | 4.21 0.28 | 0.00 | 0.09 | 0.23 | 0.25 |
| (MeV) | (degree) | |
|---|---|---|
| 1100 | -57 | 0.59 |
| 1110 | -66 | 0.57 |
| 1120 | -1 | 0.23 |
| 1130 | 37 42 | 0.33 |
| 1140 | 130 | 0.32 |
| 1150 | 60 180 | 0.86 |
| 1160 | -10 | 0.03 |
| 1180 | 25 | 0.98 |
| 1190 | -20 | 0.28 |
| 1200 | 23 | 0.79 |
| 1210 | 131 | 0.48 |
| 1220 | -1651 | 0.44 |
| 1230 | -10237 | 0.28 |
| 1240 | -21 | 0.45 |
| 1250 | 26 | 0.46 |
| 1260 | -14 | 0.18 |
| 1270 | -26 | 0.12 |
| 1280 | 1 | 0.79 |
| 1290 | 23 | 0.67 |
| 1300 | -17 | 0.33 |
| 1310 | 32 | 0.42 |
| 1320 | -34 | 0.25 |
| 1330 | 41 | 0.32 |
| 1340 | 30 | 0.52 |
| 1350 | 49 | 0.82 |
| 1360 | 35 | 0.02 |
| 1370 | 19 | 0.17 |
| 1380 | 23 | 0.88 |
| , MeV | , MeV | , nb | , nb | ||
|---|---|---|---|---|---|
| 1 | – | ||||
| 2 | |||||
| 3 | . |
| 1 | 2 | 3 | |
| , nb | 6474 | 6464 | 6474 |
| , MeV | 1506 | 1465 | 1481 |
| , MeV | 1322 | 1037 | 1079 |
| , nb | 3.31 | 3.44 | 3.56 |
| , nb | 0.03 | 0.03 | 0.03 |
| , MeV | 1798 | 1801 | 1793 |
| , MeV | 581 | 580 | 560 |
| , nb | 1.72 | 1.27 | 1.54 |
| , nb | 1.51 | 1.48 | 1.53 |
| 55.3/67 | 52.4/67 | 52.7/67 | |
| 40.2/18 | 42.8/18 | 39.5/18 | |
| 9.3/18 | 9.8/18 | 9.3/18 |
| 1 | 2 | 3 | |
| , nb | 6464 | 6464 | 6464 |
| , MeV | 1513 | 1472 | 1491 |
| , MeV | 1383 | 1095 | 1156 |
| , nb | 3.45 | 3.57 | 3.65 |
| , nb | 0.03 | 0.03 | 0.04 |
| , MeV | 1784 | 1784 | 1780 |
| , MeV | 563 | 550 | 544 |
| , nb | 2.80 | 2.29 | 2.59 |
| , nb | 2.35 | 2.34 | 2.40 |
| 51.8/67 | 49.2/67 | 49.6/67 | |
| 22.1/18 | 22.7/18 | 22.1/18 | |
| 9.3/18 | 9.4/18 | 9.3 |