E787 Collaboration
Search for the decay in the momentum region
Abstract
We have searched for the decay in the kinematic region with pion momentum below the peak. One event was observed, consistent with the background estimate of . This implies an upper limit on (90% C.L.), consistent with the recently measured branching ratio of , obtained using the standard model spectrum and the kinematic region above the peak. The same data were used to search for , where is a weakly interacting neutral particle or system of particles with .
pacs:
13.20.Eb, 12.15.Hh, 14.80.MzIn a recent paper we reported the branching ratio for the rare decay to be based on the observation of two events in the phase space region pnn1 . This decay is sensitive to the coupling of top to down quarks, , in the Cabibbo-Kobayashi-Maskawa mixing matrix. The standard model (SM) predicted branching ratio, , is smp . Loop diagrams involving new heavy particles in extensions of the SM can interfere with SM diagrams and alter the decay rate, and also the kinematic spectrumbsmp . Exotic scenarios such where is a hypothetical stable weakly interacting particle or system of particles have also been suggested bs ; aliev . It is therefore important to obtain higher statistics for this decay and to extend the measurement to other regions of phase space. The results in pnn1 are from analysis of data with the momentum above the () peak (Region 1). The from decay has a kinetic energy (), momentum (), and range () in plastic scintillator of 108 MeV, 205 MeV/c, and 30 cm, respectively. In this letter we report the analysis of data below the peak (Region 2) obtained from Experiment E787nim1 ; ccd ; ec ; utc ; td ; pnn197 ; pnn195 at the Alternating Gradient Synchrotron (AGS) of Brookhaven National Laboratory. The previous limit using Region 2, (90% C.L.), was obtained from an earlier version of the E787 detectorpnn2early .
The signature for in the E787 experiment is a single stopping in a target (TG), decaying to a single with no other accompanying photons or charged particles. In Region 1, the major backgrounds were found to be the two body decays and , scattered beam pions, and charge exchange (CEX) reactions resulting in decays , where or . Region 2 has larger potential acceptance than Region 1 because the phase space is more than twice as large and the loss of pions due to nuclear interactions in the detector is smaller at the lower pion energies. However, there are additional sources of background for Region 2. These include in which the loses energy by scattering in the material of the detector (primarily in the TG), , , , and () decays in which both the and the are invisible because of absorption.
The data were obtained with a flux of kaons per 1.6 sec spill at 730 MeV/c (with 24% pion contamination) entering the apparatus. The kaons were identified by a Cerenkov detector; two multi-wire-proportional-chambers were used to determine that there was only one entering particle. After slowing in a BeO degrader the kaons traversed a 10-cm-thick lead-glass detector read out by 16 fine-mesh photomultiplier tubes (PMT) and a scintillating target hodoscope (TH) placed before the TG. The lead-glass detector was designed to be insensitive to kaons and detect electromagnetic showers originating from kaon decays in the TG. The TH was used to verify that there was only one kaon as well as determine the position, time, and energy loss of the kaon before it entered and stopped in the TG. The TG consisted of 413 5.0-mm-square, 3.1-m-long plastic scintillating fibers, each connected to a PMT. The fibers were packed axially to form a cylinder of 12 cm diameter. Gaps in the outer edges of the TG were filled with smaller fibers which were connected to PMTs in groups. The PMTs were read out by ADCs, TDCs, and 500 MHz transient digitizers based on GaAs charge-coupled devices (CCDs)ccd . Photons were detected in a hermetic calorimeter mainly consisting of a 14-radiation length thick barrel detector made of lead/scintillator sandwich and 13.5-radiation length thick endcaps of undoped CsI crystals ec . The rest of the detector consisted of a central drift chamber (UTC)utc , and a cylindrical range stack (RS) of 21 layers of plastic scintillator with two layers of embedded tracking chambers, all within a 1-T solenoidal magnetic field. The TG, UTC, and RS allowed the measurement of the , , and of the charged decay products. The decay sequence from pions that came to rest in the RS was observed using another set of 500 MHz transient digitizers (TD)td .
The data reduction and offline analysis for Region 2 was similar to the analysis of Region 1 bergbush ; pnn197 ; pnn195 , although the final cuts to enhance signal and suppress background to less than one event were different. Here we will emphasize the key instrumentation and analysis tools used to suppress the background in Region 2. The TG, CCDs, and the photon veto system were the important elements for Region 2 analysis. A multilevel trigger selected events by requiring an identified to stop in the TG, followed, after a delay of at least 1.5 ns, by a single charged particle track that traversed TG and RS with a hit-pattern consistent with the expectation for . Events with photons were suppressed by vetos on the barrel and endcap detectors. In the offline analysis, the single charged particle was required to be identified as a with , , and consistent for a , and the TD pulse information consistent with the decay sequence in the last RS counter on the pion trajectory. The signal region was defined by the intervals , , and .
The background was found to be dominated by events in which the pion had a nuclear interaction near the kaon decay vertex, most probably on a carbon nucleus in the TG plastic scintillator. This scatter left the pion with reduced kinetic energy, putting it in Region 2. We suppressed this background by removing events in which the pion track had a scattering signature in the TG. These signatures included kinks, tracks that did not point back to the vertex fiber in which the kaon decayed, or energy deposits inconsistent with the ionization energy loss for a pion of the measured momentum. The remaining background consisted of events in which the pion scattered in one of the fibers traversed by the kaon. The extra energy deposits from the pion scatters were obscured by the earlier large energy deposits of the kaon. For these events, we examined the pulse shapes recorded in the CCDs in each kaon fiber using a fit and eliminated events in which an overlapping second pulse, in time with the pion, was found to have energy larger than 1 MeV. To obtain sufficient separation of the and induced pulses in the CCDs we required a minimum delay of 6 ns between the kaon and the pion. Finally, additional rejection was obtained by removing events with photon interactions in detectors surrounding the kaon beam-line; these cuts caused substantial ( 42 %) loss of efficiency because of accidental hits due to the high flux of particles.
| d | ||
| dm | ||
| d | ||
| Beam | d | |
| dm | ||
| CEX | dm | |
| Total |
We formed multiple independent constraints on each source of background. These constraints were grouped in two independent sets of cuts, designed to have little correlation. One set of cuts was relaxed (or inverted) to enhance the background so that the other set could be evaluated to determine its power of rejection, as summarized below. The sum of the background due to and was obtained by separately measuring the rejection factors of the TD particle identification and kinematic ( and ) particle identification. The background from beam pions was evaluated by separately measuring the rejections of Cerenkov, TH beam particle identification, and the delay time between pion and kaon. The dominant background from decay was measured by evaluating the rejection of the photon veto system on events tagged by scattering signatures in the TG and target CCDs. Similarly, the rejection of the target CCD cut was determined by using events that failed the photon veto criteria. It should be noted that the Region 1 analysis measured photon veto rejection using the unscattered events in the momentum peak (205 MeV/c)pnn195 . This method could not be used for Region 2 because the scattering in the TG spoiled the back-to-back correlation between the detected track in the RS and the undetected , leading to different photon veto rejection factors for scattered and unscattered background events.
We employed Monte Carlo (MC) simulation to evaluate the backgrounds from and because these could not be distinguished, on the basis of the track alone, from the much larger background with a scatter. In the case of , we first identified such events by looking for additional short tracks, indicative of or , coming from the kaon decay vertex in TG. We then used MC events to estimate the power of rejecting background events with charged particle hits unrelated to the or the in the TG. The MC simulation was performed using the previously measured decay distribution of decayske4 . For the final estimate (Table 1) we relied on the observed number of candidate events, which were found to be consistent with the known branching ratio. For simulation of absorption we used a measurement of ionization spectra in scintillator performed previously by our collaboration pimumu and corroborating information from other sourcespimcross ; pimspec . For the background, a MC calculation provided the ratio between the observed number of events in the peak and the expected background. The calculation was performed using the previously measured ppg decay rate and a calculation of the extra rejection, based on calibration data, due to the radiative photon in decays. Measurements of charge exchange reaction in the TG were performed. These measurements were used as input to the MC calculation of the CEX background. The final background estimates and associated errors in Table 1 include corrections for small correlations in the separate groups of cuts and cross contamination of background samples.
| Acceptance factors | |
|---|---|
| stop efficiency | 0.670 |
| decay after 6 ns | 0.591 |
| phase space | 0.345 |
| Geometry | 0.317 |
| nucl. int. and decay in flight | 0.708 |
| Reconstruction efficiency | 0.957 |
| Other kinematic cuts | 0.686 |
| decay chain | 0.545 |
| Beam and target analysis | 0.479 |
| CCD acceptance | 0.401 |
| Accidental loss | 0.363 |
| Total acceptance |

The integrity of the background estimates was assured because the background cuts were defined using only one-third of the data, sampled uniformly from the entire set, without examining the events in the pre-determined signal region. The cuts were then applied with no further changes to the remaining two-thirds of the data to obtain the numbers reported in Table 1. The systematic error on the largest background, , was estimated by measuring the rejection of photon veto cuts on many different event ensembles, tagged in different ways for a TG scattering signature. The event ensembles were designed to have little contamination by other background sources such as and . As a final check, each cut was relaxed to admit background events in a predictable way. Examination of these background events, which are close to the signal region, provided no indication of background sources other than those in Table 1. For example, the kaon decay time region between 2 to 6 ns, with acceptance of (less than the naive expectation due to other lifetime-dependent cuts) relative to the signal region, was examined. This region has a total estimated background of , dominated by decays due to the reduced background rejection from the CCDs. One event, consistent with the background estimate, was observed in this background region.
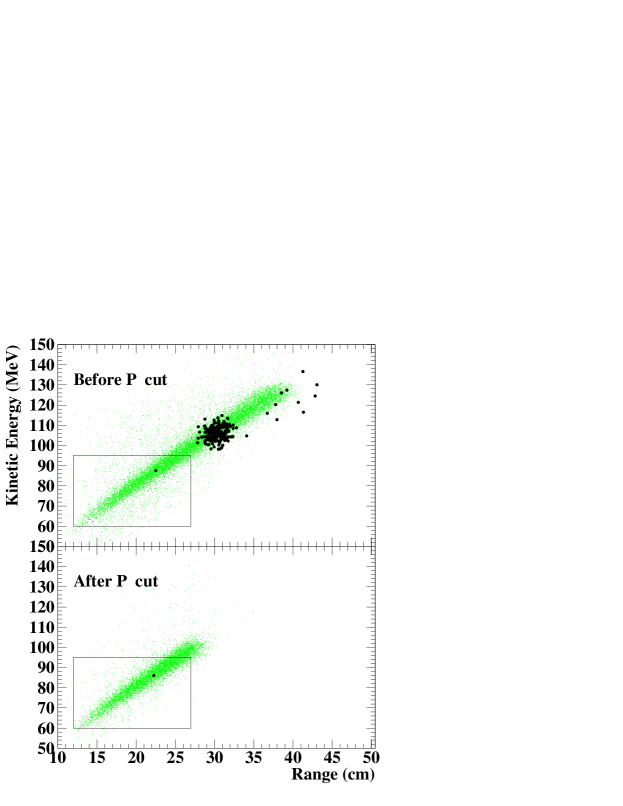
After the background study, the signal region was examined, yielding one candidate event with , , and with a kaon decay time of 17.7 ns, consistent with the background estimate of . Fig. 1 shows the kinematics of the remaining events before and after the cut on measured momentum, .
Using the total number of incident on TG for these data, , the acceptance reported in Table 2, and the observation of one event in Region 2 we calculate the upper limit of (90% C.L.) feldman . This is consistent with the branching ratio reported from Region 1 and the SM decay spectrum pnn1 ; combining the measurements from Region 1 and Region 2 does not alter the branching ratio measurement significantly because it is dominated by the sensitivity of Region 1. However, for non-standard scalar and tensor interactions, Region 2 has larger acceptance than Region 1. We have combined the sensitivity of both regions to obtain the 90% C.L. upper limits, and , for scalar and tensor interactions, respectively.
This measurement is also sensitive to , where is a hypothetical stable weakly interacting particle, or system of particles. Fig. 2 shows 90% C.L. upper limits on together with the previous limit from pnn2early . The dotted line in Fig. 2 is the single event sensitivity defined as the inverse of the acceptance for multiplied by the total number of stopped kaons as a function of .
In conclusion, the use of GaAs charged-coupled devices to record pulse shapes as well as highly efficient photon detection has allowed us to suppress background in Region 2. This has resulted in new limits on the spectrum of the pion in the decay as well as improvement in the sensitivity to by a factor between 4 and 40 over the accessible mass range. The detailed enumeration of backgrounds in Region 2 will be important for new experiments that intend to precisely measure with large statistics nim2 ; ckm .
We gratefully acknowledge the dedicated efforts of the technical staff supporting this experiment and the Brookhaven Accelerator Department. This research was supported in part by the U.S. Department of Energy under Contracts No. DE-AC0298CH10886, W-7405-ENG-36, and grant DE-FG02-91ER40671, by the Ministry of Education, Culture, Sports, Science and Technology of Japan through the Japan-US Cooperative Research Program in High Energy Physics and under the Grant-in-Aids for Scientific Research, encouragement of Young Scientists and for JSPS Fellows, and by the Natural Sciences and Engineering Research Council and the National Research Council of Canada.
References
- (1) S. Adler et al., Phys. Rev. Lett. 88, 041803 (2002).
- (2) A. J. Buras, Preprint hep-ph/0101336 (2001), A. J. Buras and R. Fleischer, Preprint hep-ph/0104238 (2001), G. Buchalla and A. J. Buras, Nucl. Phys. B548, 309 (1999).
- (3) G. Isidori, in Kaon Physics, edited by J. L. Rosner and B. D. Winstein (The University of Chicago Press, Chicago, 2001), p.355. Also see, G. D’Ambrosio and G. Isidori, Preprint hep-ph/0112135.
- (4) S. Bertolini and A. Santamaria, Nucl. Phys. B 315, 558 (1989).
- (5) T.M. Aliev, M.I. Dobroliubov, and A. Yu. Ignatiev, Nucl. Phys. B335, 311(1990).
- (6) M.S. Atiya et al., Nucl. Instrum. Methods Phys. Res. A 321, 129 (1992)
- (7) D.A. Bryman et al., Nucl. Instrum. Meth. A 396 394 (1997).
- (8) I-H. Chiang et al., IEEE Trans. Nucl. Sci. NS-42, 394 (1995). T.K. Komatsubara et al., Nucl. Instrum. Methods A 404, 315 (1998).
- (9) E.W. Blackmore et al., Nucl. Instrum. Methods Phys. Res. A 404, 295 (1998).
- (10) M.S. Atiya et al., Nucl. Instrum. Methods Phys. Res. A 279, 180 (1989).
- (11) S. Adler, et al., Phys, Rev. Lett. 84, 3768 (2000).
- (12) S. Adler, et al., Phys. Rev. Lett. 79, 2204 (1997),
- (13) M.S. Atiya, et al., Phys. Rev. D 48, R1 (1993).
- (14) P. Bergbusch, Ph. D. Thesis, University of British Columbia, (2000); N. Muramatsu, Ph. D. Thesis, University of Tokyo, KEK-Report 2001-1(2001).
- (15) S. Pislak et al., Phys. Rev. Lett. 87, 221801 (2001).
- (16) S. Adler et al., Phys. Rev. Lett. 79, 4756 (1997). The energy spectrum for absorption in scintillator can be found in ”Measurement of the branching ratio”, M. Ardebili, Ph.D. Thesis, Princeton, June 1995.
- (17) E. Friedman, et al., Phys. Lett. B 257 17 (1991). R. L. Burman, A. C. Dodd, P. Plischke, Nucl. Inst. Meth. A 368, 416 (1996).
- (18) R. Madey, et al., Phys. Rev. C 25, 3050 (1982). G.Mechtersheimer et al, Phys. Lett. B 73, 115 (1978).
- (19) S. Adler, et al., Phys. Rev. Lett. 85, 4856 (2000).
- (20) Review of Particle Physics, Eur. Phys. Jour. 15, 201 (2000). G. J. Feldman and R. D. Cousins, Phys. Rev. D 57, 3873 (1998). We have used the 90% C.L. upper limit of 3.6 for 1 observed event with expected background of 0.73.
- (21) An upgraded version of the experiment, E949, is now pursuing a precise measurement of .
- (22) “Charged Kaons at the Main Injector”, J. Frank, et al., Fermilab Proposal, April 2, 2001.