ATMOSPHERIC NEUTRINO OSCILLATIONS
G. GIACOMELLI, M. GIORGINI and M. SPURIO
Dept of Physics, Univ. of Bologna and INFN,
V.le C. Berti Pichat 6/2, Bologna, I-40127, Italy
E-mail: giacomelli@bo.infn.it , giorginim@bo.infn.it , spurio@bo.infn.it
Lectures at the 6th School on Non-Accelerator Astroparticle Physics,
Trieste, Italy, 9-20 July 2001.
Abstract
The recent results from the Soudan 2, MACRO and SuperKamiokande experiments on atmospheric neutrino oscillations are summarized and discussed. Some features of possible future atmospheric neutrino experiments are presented.
1 Introduction
A high energy primary cosmic ray, proton or nucleus, interacts in the upper atmosphere producing a large number of pions and kaons, which decay yielding muons and muon neutrinos; also the muons decay yielding muon and electron neutrinos. The ratio of the numbers of muon to electron neutrinos is about 2 and . These neutrinos are produced in a spherical surface at few tens of km above ground and they proceed at high speed towards the earth.
The atmospheric neutrino flux was computed by many authors. At low energies, GeV, the numbers of neutrinos predicted by different authors differ by about [1, 2]; at higher energies, GeV, the predictions are more reliable, with an estimated systematic uncertainty of about [2, 3], almost one half of that at low energies. However the predicted relative rates of and and the shapes of the zenith distributions are affected by considerably lower systematic errors. Other sources of systematic uncertainties arise from the knowledge of the neutrino-nucleon cross sections and from the propagation of muons and electrons in different materials.
Several large underground detectors studied atmospheric neutrinos. These detectors were and are located below a cover of 1-2 km of rock and may detect neutrinos coming from all directions or from below. Via charged current (CC) interaction, a gives rise to a and thus to a track, the yields an and thus an electromagnetic shower.
The early water Cherenkov detectors IMB [4] and Kamiokande [5] reported anomalies in the ratio of muon to electron neutrinos, while the tracking calorimeters NUSEX [6], Frejus [7], and the Baksan [8] scintillator detector did not find any.
Later the Soudan 2 [9], MACRO [10] and SuperKamiokande [11] detectors reported deficits in the fluxes with respect to the Monte Carlo (MC) predictions and a distortion of the angular distributions; the distributions agree with MC. These features may be explained in terms of oscillations. A summary of the MACRO situation in 1998 is given in ref. [12].
Atmospheric neutrinos are well suited for the study of neutrino oscillations, since they have energies from a fraction of GeV up to more than 100 GeV and they may travel distances from few tens of km up to 13000 km; thus ranges from km/GeV to km/GeV. Moreover one may consider that there are two identical sources for a single detector: a near one (downgoing neutrinos) and a far one (upgoing neutrinos). Atmospheric neutrinos are particularly suited to study oscillations for small . Finally, matter effects can be studied with high energy atmospheric neutrinos.
2 Neutrino oscillations
If neutrinos have non-zero masses, one has to consider the weak flavour eigenstates and the mass eigenstates . The weak flavour eigenstates are linear combinations of the mass eigenstates through the elements of the mixing matrix :
| (1) |
If the mixing angles are small, one would have , , ; if they are large, the flavour eigenstates are well separated from those of mass.
In the simple case of only two flavour eigenstate neutrinos which oscillate with two mass eigenstates one has
| (2) |
where is the mixing angle. In this case one may easily compute the following expression for the survival probability of a beam:
| (3) |
where , is the distance travelled by the neutrino from production to detection. The probability for the initial to oscillate into a is:
| (4) |
and may be determined from the variation of as a function of the zenith angle , or from the variation in .
3 Early experiments
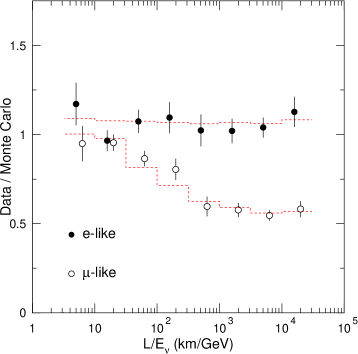
The early water Cherenkov detectors and the tracking calorimeters measured and CC interactions. The results (see Fig. 1) were expressed in terms of the double ratio , where is the ratio of observed and events and is the same ratio for Monte Carlo simulated events. While the single ratio is affected by large theoretical and systematic uncertainties, in the double ratio most systematic uncertainties cancel.
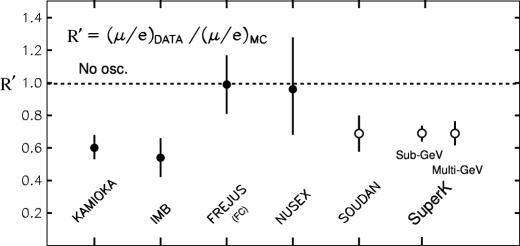
The double ratios from IMB and Kamiokande were smaller than expectations, while the NUSEX and Frejus agreed with expectations. The Baksan scintillation telescope detected upthroughgoing muons arising from interactions in the rock below the detector [8]. The average energy for these events is GeV. They did not find deviations from the predictions in the total number of events, but found an anomalous angular distribution.
Later, the Soudan 2 tracking and shower calorimeter detector confirmed the anomaly in the double ratio for contained events [9], Fig. 1.
MACRO [10] reported in 1995 a measurement of upthroughgoing muons coming from of GeV, in which there was a global deficit in the total number of observed upgoing muons and an anomalous zenith angle distribution. These features were later confirmed by the analyses of the whole samples of upthroughgoing muons [10] and of lower energy events ( GeV) [10].
SuperKamiokande (SK) confirmed the anomalous double ratio, Fig. 1, and provided a wealth of informations for sub-GeV and multi-GeV and for higher energy upthroughgoing muons and stopping muons [11].
After 1998 new results were presented by the three experiments at most Conferences. Here we shall review their results.
4 Results from the Soudan 2 experiment
The Soudan 2 experiment uses a modular fine grained tracking and showering calorimeter of t. It is located underground in the Soudan Gold mine in Minnesota. Its overall dimensions are 8m16m5m. The detector is made of 224 modules of 1m1m2.5m. The bulk of the mass consists of 1.6 mm thick corrugated steel sheets interleaved with drift tubes. The detector is surrounded by an anticoincidence shield.
The neutrino contained events are selected by a combination of a two-stage software filter and a two-stage physicist scan. Topologies for contained events include single track and single shower events and multiprong events. An event having a leading, non-scattering track with ionization compatible with that from a muon is a candidate CC event of flavour; an event yielding a relatively energetic shower is a candidate CC event. Multiprong events are not considered at present. Events without hits in the shield are called Gold Events, while events with two or more hits in the shield are called Rock Events.
| Data Raw | Data Back. removed | MC | |
|---|---|---|---|
| Track | 133 | 193.1 | |
| Showers | 193 | 179.0 |
The sample of fully contained events consists mostly of quasi-elastic neutrino reactions, but include a background of photons and neutrons from cosmic ray muon interactions in the surrounding rock. The track and shower events for a 5.1 ktyr exposure are summarized in Table 1, where they are compared with the MC predictions based on the Bartol neutrino flux [2]. After corrections for cosmic ray muon induced background, the Soudan 2 double ratio for the whole zenith angle range () is which is consistent with muon neutrino oscillations, see Fig. 1.
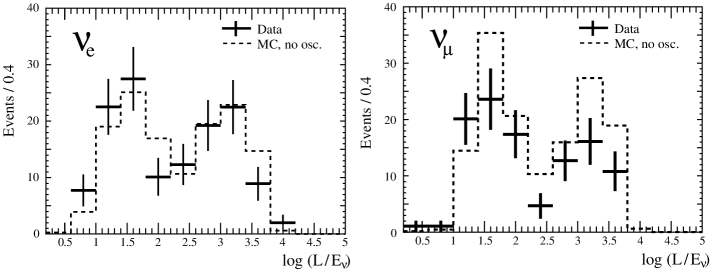
Selecting a high resolution (HiRes) sample of events for which the resolution in is better than 0.5, the flavour tagging is estimated to be correct for more than of the events. After background subtraction there are 106.3 events of flavour and 132.8 events of flavour. Using these events, whose mean energy is slightly higher, the double ratio is . The distribution for and charged current events compared to the no oscillation MC predictions normalized to the data is shown in Fig. 2. Notice that the data agree with the no oscillation MC predictions, while the data are lower; this is consistent with oscillations in the channel and no oscillations for . The double peak structure arises from the acceptance of the apparatus. The 90% C.L. allowed region in the plane, computed using the Feldman-Cousins method [13] is shown in Fig. 8b, where it is compared with the allowed regions obtained by the SK and MACRO experiments.
5 Results from the MACRO experiment
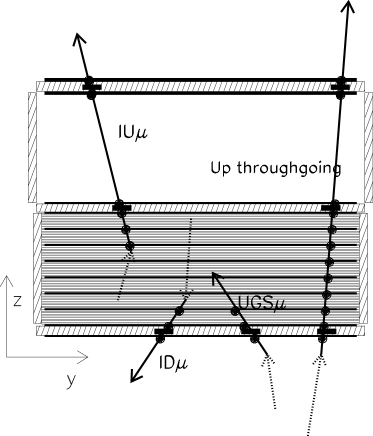
The MACRO detector was located in Hall B of the Gran Sasso Laboratory, at an average rock overburden of 3700 hg/cm2. It was a rectangular box, 76.6m12m9.3m, divided longitudinally in six supermodules and vertically in a lower part (4.8 m high) and an upper part (4.5 m high) [10]. The detection elements were planes of streamer tubes for tracking and liquid scintillation counters for the determination of the direction (versus) by the time-of-flight (T.o.F.) method. The lower half of the detector was filled with trays of crushed rock absorbers alternating with streamer tube planes; the upper part was open and contained the electronics. Fig. 3, a vertical section of the detector, shows the different topologies of events.
In the MC simulation of upthroughgoing muons, the neutrino flux computed by the Bartol group [2] and the cross sections for the neutrino interactions calculated using the deep inelastic parton distribution [14] are used. The propagation of muons to the detector was done using the energy loss calculation in standard rock [15]. For the low energy data, the simulations use the Bartol neutrino flux and the low energy neutrino cross sections [16].
| Events | MC | Data/MC | |
|---|---|---|---|
| Upthr. | 809 | ||
| IU | 154 | ||
| ID+UGS | 262 |
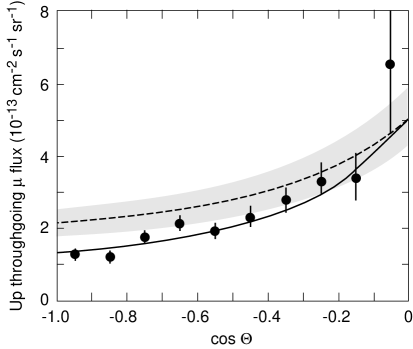
Upthroughgoing muons ( GeV) They come from interactions in the rock below the detector of with GeV. The MC uncertainties arising from the neutrino flux, cross section and muon propagation on the expected flux of muons are estimated to be 17%; this systematic uncertainty on the upthroughgoing muons flux is mainly a scale error. The ratio of the observed number of events to the expectation without oscillations in is . Fig. 4a shows the zenith angle distribution of the measured flux of upthroughgoing muons; the MC expectation for no oscillations is indicated by the dashed line. The best fit to the number of events and to the shape of the zenith angle distribution, assuming oscillations, yields and eV2 (solid line).
 (a) (b)
The 90% C.L. allowed region in the plane, computed using the Feldman-Cousins method [13] is shown in Fig. 8b, where it is compared with those obtained by the SuperKamiokande and Soudan 2 experiments.
against
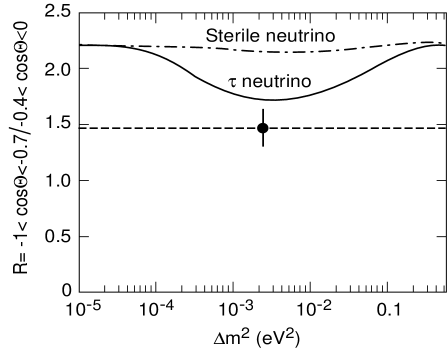
Matter effects due to the difference between the weak interaction effective potential for muon neutrinos with respect to sterile neutrinos, which have null potential, yield different total number and different zenith distributions of upgoing muons. In Fig. 4b the measured ratio between the events with and the events with is shown [10]. In this ratio most of the theoretical uncertainties on neutrino flux and cross sections cancel. The remaining error, %, comes from uncertainties on the kaon/pion fraction, on the cross sections of almost vertical and almost horizontal events and on the seasonal variation of the ratio. The systematic experimental error on the ratio, due to analysis cuts and detector efficiencies, is 4.6%. Combining the experimental and theoretical errors in quadrature, a global extimate of 6% is obtained. MACRO measured 305 events with and 206 events with ; the ratio is . For eV2 and maximal mixing, the minimum expected value of the ratio for is and for is . One concludes that oscillations (with any mixing) are excluded at 99% C.L. compared to the channel with maximal mixing and eV2.
energy estimate by Multiple Coulomb Scattering of muons
Since MACRO was not equipped with a magnet, the only way to estimate the muon energy is through Multiple Coulomb Scattering (MCS) of muons in the absorbers. The r.m.s. of the lateral displacement of a relativistic muon travelling for a distance can be written as , where (GeV/c) is the muon momentum and is the amount of crossed material in terms of radiation lengths [17, 18]. A muon crossing the whole apparatus, on the vertical, has cm/(GeV). The muon energy estimate can be performed up to a saturation point, occurring when is comparable with the detector space resolution.
Two analyses were performed. The first was made studying the deflection of upthroughgoing muons using the streamer tubes in digital mode [18]. This method has a spatial resolution of cm. The data were divided into 3 subsamples with different average energies, in 2 subsamples in zenith angle and finally in 5 subsamples with different average values of .
The second analysis was performed using the streamer tubes in “drift mode” [17]; the time information was given by a TDC. The space resolution is mm. For each muon, 7 MCS sensitive variables were defined and given in input to a Neural Network (NN), previously trained with MC events of known energy crossing the detector at different zenith angles. The NN output allows to separate the sample of upthroughgoing muons in 4 subsamples with average energies of 12, 20, 50 and 100 GeV. The ratios Data/MC as a function of obtained from upthroughgoing muons are plotted in Fig. 5; they are in agreement with the oscillation hypothesis.
Low energy events
Semicontained upgoing muons (IU) come from interactions inside the lower apparatus. Since two scintillation counters are intercepted, the T.o.F. method is applied to identify upward going muons. The average parent neutrino energy for these events is GeV.
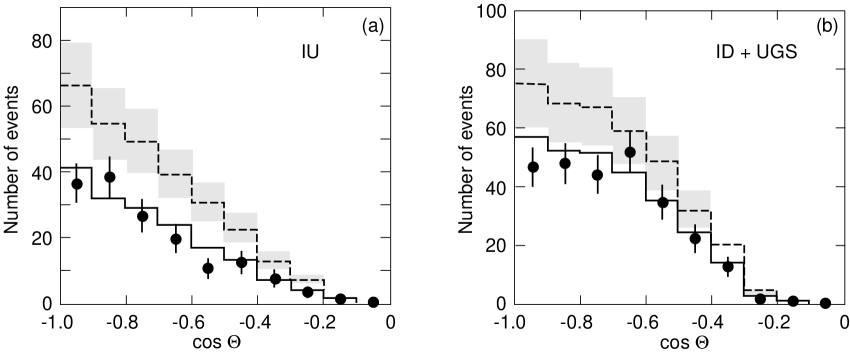
Up stopping muons (UGS) are due to external interactions yielding upgoing muons stopping in the detector; the semicontained downgoing muons (ID) are due to downgoing ’s with interaction vertices in the lower MACRO. The events are found by topological criteria; the lack of time information prevents to distinguish between the two subsamples. An almost equal number of UGS and ID events is expected.
The number of events and the angular distributions are compared with the MC predictions without oscillations in Table 2 and Fig. 6. The low energy data show a uniform deficit of the measured number of events over the whole angular distribution with respect to the predictions; the data are in good agreement with the predictions based on oscillations with the parameters obtained from the upthroughgoing muon sample.
6 Results from the SuperKamiokande experiment
SuperKamiokande [11] (SK) is a large cylindrical water Cherenkov detector of 39 m diameter and 41 m height containing 50 kt of water (the fiducial mass of the detector for atmospheric neutrino analyses is 22.5 kt); it is seen by 11146, 50-cm-diameter inner-facing phototubes. The 2 m thick outer layer of water acts as an anticoincidence and is seen by 1885 smaller outward-facing photomultipliers. The ultra pure water has a light attenuation of almost 100 m. The detector is located in the Kamioka mine, Japan, under
Atmospheric neutrinos are detected in SK by measuring the Cherenkov light generated by the charged particles produced in the neutrino CC interactions with the water nuclei. Thanks to the high PMT coverage, the experiment is characterised by a good light yield ( photo-electrons per MeV) and can detect events of energies as low as MeV.
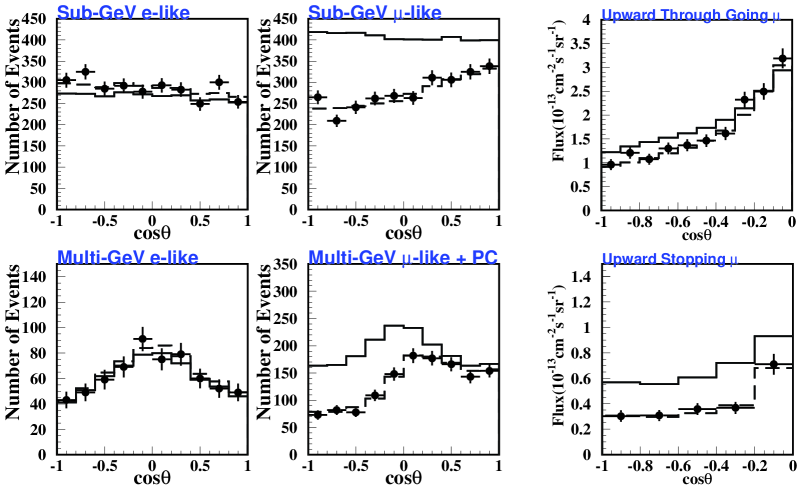
The large detector mass and the possibility of clearly defining a large inner volume allow to collect a high statistics sample of fully contained events (FC) up to relatively high energies (up to GeV). The FC events have both the neutrino vertex and the resulting particle tracks entirely within the fiducial volume; they yield rings of Cherenkov light on the PMTs. The contamination from downward-going cosmic muons is drastically reduced by the containment requirement on the primary vertex coordinates. Fully contained events can be further subdivided into two subsets, the so-called sub-GeV and multi-GeV events, with energies below and above 1.33 GeV, respectively. In SK jargon FC events include only single-ring events, while multi-ring ones (MRING) are treated as a separate category. Another sub-sample, defined as the partially contained events (PC), is represented by those CC interactions where the vertex is still within the fiducial volume, but at least a primary charged particle, typically the muon, exits the detector without releasing all of its energy. In this case the light pattern is a filled circle. For these events the energy resolution is worse than for FC interactions. Upward-going muons (UPMU), produced by neutrinos coming from below and interacting in the rock, are further subdivided into stopping muons ( GeV) and throughgoing muons ( GeV), according to whether or not they stop in the detector. The samples defined above explore different ranges of neutrino energies [19].
| Data | MC no osc. | (GeV) | |
|---|---|---|---|
| Sub-GeV -like | 2864 | 2668 | 0.6 |
| Sub-GeV -like | 2788 | 4073 | 0.6 |
| Multi-GeV -like | 626 | 613 | 3 |
| Multi-GeV -like | 558 | 838 | 3 |
Particle identification in SuperKamiokande is performed using likelihood functions to parametrize the sharpness of the Cherenkov rings, which are more diffused for electrons than for muons. The algorithms are able to discriminate the two flavours with high purity (of the order of for single track events). The zenith angle distributions for -like and -like sub-GeV and multi-GeV events are shown in Fig. 7. The electron-like events are in agreement with the MC predictions in absence of oscillations, while the muon data are lower than the no oscillation expectations. The number of measured and expected events are summarized in Table 3. Moreover, the -like data exhibit an up/down asymmetry in zenith angle, while no significant asymmetry is observed in the -like data [11].
 (a) (b)
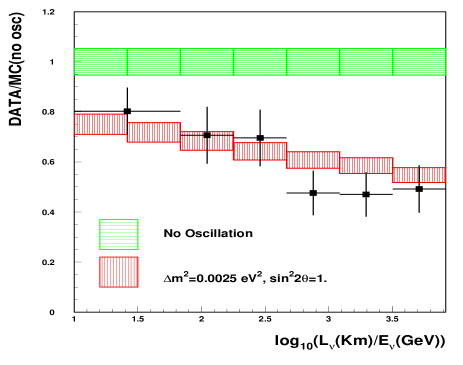
The recent value for the double ratio reported by SK, based on 1289 days of data, is for the sub-GeV sample and for the multi-GeV sample (both FC and PC), Fig. 1. The ratio between observed and expected numbers of -like and -like events as a function of is shown in Fig. 8a. The ratio -like events/MC do not depend from while -like events/MC show a dependence on consistent with the oscillation hypothesis. Interpreting the muon-like event deficit as the result of oscillations in the two-flavour mixing scheme, SuperKamiokande computes an allowed domain for the oscillation parameters [11], see Fig. 8b. The events are binned in a multi-dimensional space defined by particle type, energy and zenith angle, plus a set of parameters to account for systematic uncertainties. The best fit using FC, PC, UPMU and MRING events [11] corresponds to maximal mixing and eV2, Fig. 8b.
SK reported also data on upthroughgoing muons, which agree with the predictions of an oscillated flux with the above parameters. Notice that the average energies are larger than those of the corresponding sample in MACRO.
 (a) (b) (c)
against
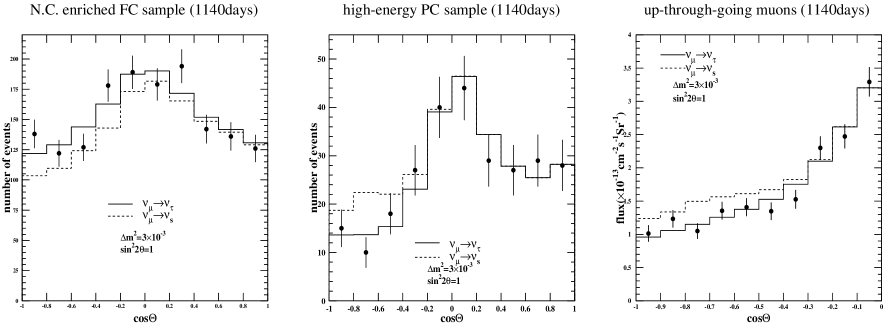
If the observed deficit of were due to oscillations, then the number of events produced via neutral current (NC) interaction for up-going neutrinos should also be reduced. Moreover, in the case of oscillations, matter effects will suppress oscillations in the high energy ( GeV) region. The following data samples were used to search for these effects: (a) NC enriched sample, (b) the high-energy ( GeV) PC sample and (c) upthroughgoing muons. The zenith angle distribution for each sample is shown in Fig. 9. The hypothesis test is performed using the up()/down() ratio in samples (a) and (b) and the vertical()/horizontal() ratio in sample (c). The excluded regions obtained by a combined ((a),(b)and(c)) analysis and by the analysis of 1-ring-FC show that oscillations are disfavored with respect to oscillations at a C.L. of 99% [11].
7 Conclusions and outlook
The results on atmospheric neutrinos obtained by the Soudan 2, MACRO and SuperKamiokande experiments was discussed. The zenith angle distributions and the observed number of neutrino-induced muons disagree with the predicted values for the no oscillation hypothesis. For -induced electrons there is no strong deviation from prediction. The ratio of muons to electrons normalized to the respective MC predictions enhances the anomaly. All muon data are in agreement with the hypothesis of two flavour oscillations, with maximal mixing and eV2. The hypothesis of oscillations is disfavoured at 99% C.L. for any mixing. The 90% C.L. contours of Soudan 2, MACRO and SuperKamiokande overlap, see Fig. 8b.
The above experiments on atmospheric neutrinos are disappearance experiments; future atmospheric experiments are under study (see for example ref. [20]); also long baseline experiments using from accelerators are planned (see the lectures of ref. [21]). The main goals of these experiments are the detection of the first oscillation in and an appearance of , to really prove the oscillation hypothesis. They should also yield improved measurements of the oscillation parameters. Other goals include further discrimination of from oscillations, and the detection of a possible small contribution. Eventually one would like a complete information on the oscillation matrix. Matter effects could be used to constrain hybrid oscillation models [20] and measure the sign of .
Water Cherenkov detectors. The principle of a 650 kt (450 kt fiducial) water Cherenkov detector, tentatively called UNO [20] (Ultra underground Nucleon decay and neutrino Observatory), is currently being discussed. It could be 20-times SK; it would therefore increase 20 times the statistics and, in addition, it could allow the study of oscillations and give an explicit appearance signal from atmospheric neutrinos.
The AQUA-RICH [20] project would be based on the Ring Imaging Cherenkov (RICH) technique. This detector could reconstruct the neutrino interaction vertex and the particle flight direction, while the space-time structure of the Ring Image would yield a measurement of the particle momentum through multiple Coulomb scattering. A momentum resolution of 7% could be achieved. This would yield an resolution sufficient to resolve the oscillation pattern.
Magnetized tracking calorimeters. The advantage of such detectors is that they can measure the muon charge, and thus separate the neutrino and antineutrino components. This should be useful to study matter effects, which can be significantly different in the two cases. Furthermore, the energy of the hadronic system and the momentum of semicontained muons could be measured accurately. MONOLITH [20] (Massive Observatory for Neutrino Oscillations or LImits on THeir existence) is a plan for a 34 kt magnetised iron detector dedicated to the measurement of atmospheric neutrinos. Its fiducial mass of about 26 kt would match the mass of SK, while its superior resolution could allow the reconstruction of the oscillation pattern.
8 Acknowledgements
We would to thank many colleagues for providing informations and suggestions; in particular we acknowledge the cooperation of D. Bakari, G. Battistoni, Y. Becherini, P. Bernardini, T. Montaruli, F. Ronga, E. Scapparone, M. Sioli, A. Surdo.
References
- [1] G. Barr et al., Phys. Rev. D 39, 3532 (1989); M. Honda et al., Phys. Lett. B 248, 193 (1990); H. Lee and Y.S. Koh, Nuovo Cimento B 105, 883 (1990).
- [2] V. Agrawal et al., Phys. Rev. D 53, 1314 (1996).
- [3] L.V. Volkova, Sov. J. Nucl. Phys. 31, 784 (1980); K. Mitsui et al., Nuovo Cimento C 9, 995 (1986); A.V. Butkevich et al., Sov. J. Nucl. Phys. 50, 90 (1989).
- [4] IMB Coll., R. Becker-Szendy et al., Phys. Rev. D 46, 372 (1992).
- [5] Kamiokande Coll., Y. Fukuda et al., Phys. Lett. B 335, 237 (1994).
- [6] NUSEX Coll., M. Aglietta et al., 23rd ICRC Proc., Vol. 4 (1993) 446.
- [7] Frejus Coll., K. Daum et al., Z. Phys. C 66, 417 (1995).
- [8] Baksan Coll., S. Mikheyev, 5th TAUP Workshop, Gran Sasso, Italy, 1997.
- [9] Soudan 2 Coll., W.W.M. Allison et al., Phys. Lett. B 391, 491 (1997); Phys. Lett. B 449, 137 (1999); W. Anthony Mann, hep-ex/0007031.
- [10] MACRO Coll., S. Ahlen et al., Phys. Lett. B 357, 481 (1995). M. Ambrosio et al., Phys. Lett. B 434, 451 (1998); Phys. Lett. B 478, 5 (2000); Phys. Lett. B 517, 59 (2001); The MACRO detector at Gran Sasso, accepted by Nucl. Instrum. Methods A; G. Giacomelli and M. Giorgini, Atmospheric neutrino oscillations in MACRO, Proc. of the NO-VE, Int. Workshop on Neutrino Oscillations in Venice, Venice, Italy (2001), hep-ex/0110021.
- [11] SuperKamiokande Coll., Y.Fukuda et al., Phys. Rev. Lett. 81, 1562 (1998); Phys. Lett. B 433, 9 (1998); Phys. Rev. Lett. 85, 3999 (2000); Nucl. Phys. B Proc. Suppl. 91, 127 (2001); T. Toshito, hep-ex/0105023 (2001).
- [12] G. Giacomelli and M. Spurio, Atmospheric neutrinos and neutrino oscillations, hep-ph/9901355 (1998).
- [13] G.J. Feldman and R.D. Cousins, Phys. Rev. D 57, 3873 (1998).
- [14] M. Gluck et al., Z. Phys. C 67, 433 (1995).
- [15] W. Lohmann et al., Energy loss of muons in the energy range 1-GeV to 10000-GeV., CERN-EP/85-03 (1985).
- [16] P. Lipari et al., Phys. Rev. Lett. 74, 4384 (1995).
- [17] M. Giorgini, Performance of the MACRO limited streamer tubes for estimates of muon energy, Proc. of the 7th ICATPP, Como, Italy (2001).
- [18] D. Bakari et al., Estimate of the energy of upgoing muons with Multiple Coulomb Scattering, Proc. of the NATO ARW, Oujda, Morocco (2001).
- [19] R. Engel et al., Phys. Lett. B 472, 113 (2000).
- [20] Chang Kee Jung, hep-ex/0005046; AQUA-RICH Coll., P. Antonioli et al., Nucl. Instrum. Methods A 433, 104 (1999); A. Geiser, hep-ex/0008067.
- [21] L. Di Lella, Long baseline esperiments, these Proceedings.