A Monitor of the Focusing Strength of Plasma Lenses using MeV Synchrotron Radiation
Abstract
The focusing strength of plasma lenses used with high energy electron or positron beams can give rise to synchrotron radiation with critical energies in the MeV range. A method is described for measuring the characteristic energy of this radiation as a way of monitoring the strength of the focus. The principle has been implemented in a plasma lens experiment with a 28.5 GeV positron beam.
keywords:
synchrotron radiation , plasma lens , absorption lengthPACS:
07.85.Qe , 52.40.Mj , 41.85.LcSLAC-PUB-9111
Jan 7 2002
, and
Submitted to Nuclear Instruments and Methods in Physics Research A
1 Introduction
An experiment has been carried out at SLAC to study the focusing of electron and positron beams by thin targets of plasma [1]. Focusing systems of this type may be used to boost luminosity at future linear colliders by sharpening their final focus. If so, a means of monitoring the operation of the lenses must be developed, at least during single beam tuning. As part of the experimental study, a monitor based on the synchrotron radiation from the plasma lens has been developed. It was used both online, as a tuning tool, and in data analysis to validate the measurements of focusing by wire scanning of the beam spots.
The SLAC Final Focus Test Beam (FFTB) [2], where the experiment was done, is a model of the final focus of a linear collider and is presently operated up to 28.5 GeV. With these energies, plasma lenses are strong enough that their synchrotron radiation exhibits critical energies, , in the MeV range. The radiation is therefore quite penetrating, and the depth of penetration was used as a measure of .
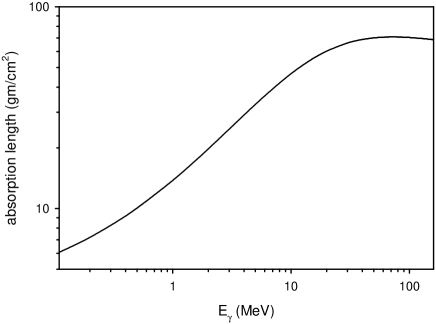
Above the absorption edges, the gamma ray absorption length increases with increasing energy until the onset of pair production which reverses this trend. Common particle calorimeter materials, like Pb, have high atomic number, Z, and so their pair production cross section rises quickly above threshold, becoming dominant above a few MeV. For these materials, the slope of the graph of penetration depth against energy quickly changes sign and higher energy gamma rays tend to interact at shallower depths.
However, the synchrotron radiation spectrum has a significant component up to . To accommodate in the MeV range one must use materials of low Z, such as carbon, where the dominance of pair production is postponed until energies of 50 MeV or above are reached [3]. This is illustrated in Fig. 1.
A calibration beam of synchrotron radiation with a critical energy in the range of interest — or even a suitable monochromatic photon beam of tunable energy in this range — is rarely available, and so one must rely on particle transport codes such as EGS4 [4] to model the detector response. At critical energies above 50 MeV, as could be the case with a future linear collider, these codes allow the technique to be extended into the range where the shower profile from the synchrotron radiation lengthens logarithmically with increasing energy, and low-Z material would not be advantageous.
The study of plasma lenses at presently available energies is hampered by the physical limits of practical beam-spot size measuring techniques. Wire scanning with carbon fibers has been the tool of choice, but plasma focusing can easily produce spots that instantaneously vaporize the fiber [1, 5]. Monitoring of the focusing strength by the use of synchrotron radiation will permit a substantial extension of the work on plasma lenses.
2 Experimental Setup
The experiment tested the focusing of electron and positron beams at 28.5 GeV, produced by the SLAC linac and delivered to the FFTB at particles per pulse, with pulse duration, typical of linear colliders, of 4 ps FWHM. The beam was intercepted by a 3 mm thick jet of nitrogen whose density, for the data reported here, was set to correspond to 0.25 Atm. The resulting ionization formed a plasma that focused the beam with an effective focal length in the range of millimeters [1], accompanied by the emission of a burst of synchrotron radiation.
The beam dimensions downstream of the jet were measured in a standard procedure [5] by a carbon fiber wire scanner. The procedure was to use magnetic dipoles to scan the beam, in micron steps, across a carbon fiber. The resulting Bremsstrahlung continued down the beam line along with the charged beam. Eventually the charged beam was deflected to its dump, and the gammas were allowed to leave the vacuum pipe, 30 meters from the gas jet, through a thin window. There they entered the front of a stack of absorber material in which were embedded a set of detectors. The separation between charged and neutral beams was 26 cm at this point. The final detector, after 4 radiation lengths of material, was an air Cherenkov counter [5], and its signal, proportional to the overlap of the beam and the fiber, was used as the wire scanner signal.
In addition to the Bremsstrahlung, there was the MeV synchrotron radiation from the plasma lens, and some synchrotron radiation, in the 100 keV range, from conventional beam line elements. The material before the air Cherenkov counter absorbed this radiation, and each of the detectors interspersed through the material was sensitive to the surviving flux at its own depth.
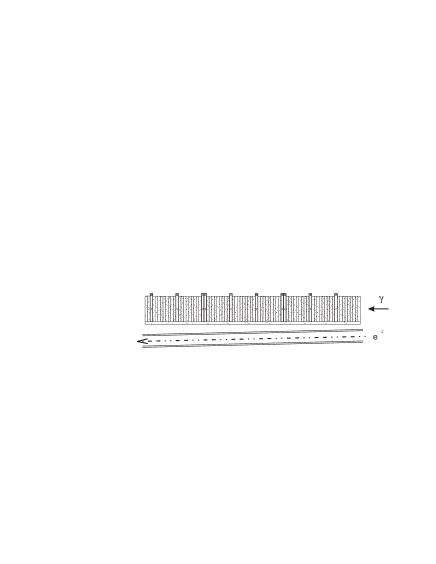
As a convenient absorber material we chose polyethylene, n(CH2), although water would have similar absorption properties. It was available in 2.5 cm thick plates. We had these cut into 25 cm squares which we stacked, along the beam direction, in blocks 22.5 cm thick. Fig. 2 illustrates the long profile of the stack. Between each block was a planar ion chamber. In total there were 8 layers, each with one absorber block and its ion chamber. Two additional chambers were inserted to allow the accelerator data collection system to monitor conditions independently. The complete stack corresponded to approximately 4 radiation lengths.
Ion chambers were chosen as the sensitive elements primarily because of the intensity of the signal. The electron density from the converted gamma rays could reach per pulse, and radiation doses in the range of tens of Megarads were accumulated during the experiment. Ion chambers held out the promise of rugged performance, while requiring minimal intervention, and have excellent linearity. Preliminary tests showed pulse linearity, with a nitrogen filling, above 2 nanocoulombs , beyond what would be needed for the plasma focusing experiment.
The ion chambers were of a simple double-gap window-frame construction. The bodies were constructed of three acrylic plates 3.2 mm thick, spaced by acrylic ”window-frames” 6.4 mm thick and 19 mm wide, to form two 6.4 mm collecting gaps. On the internal surfaces of the plates was bonded a laminate of 8 aluminum on 75 Mylar, the aluminum forming the electrodes of the chambers. Polyimide tape covered the edge of the aluminum, extending 6 mm in from the acrylic frame. This increased the surface path length between opposite electrodes, and so reduced the likelihood of surface discharges across the frame material. The area remaining active in each gap was then 20 cm square. Negative high voltage was applied to the outer plates, through a 1 megohm resistor for security. Signals from collected electrons were picked up from the electrodes on either side of the middle plate and taken to a preamplifier in a shielded box at the side of the chamber. The preamplifier, with a gain of 11, was based on a KH300 chip [6].
The gas chosen was nitrogen, and this was fed in parallel to the two gaps at a rate of a few cc per minute, the gas lines penetrating a Faraday enclosure around both the chamber and its preamplifier. The preamplifier box was also in the Faraday shield, and its signals emerged by way of a BNC connector to be carried to standard 11-bit CAMAC ADCs over about 75 m of cable, mostly RG 214.
Prototype tests indicated that the chambers could operate at 1000V with a collection efficiency that was independent of the applied high voltage, and so all were operated at the same setting, and minimal monitoring of the H.V. was needed. At this voltage, the signal at the ADC was observed to reach peak amplitude at 50 ns, and to fall within 10% of peak at about 360 ns.
3 Operation and Results
The carbon fiber scanning of the beam spot profile was carried out at various positions along the beam line (z coordinate) close to the focal point of the beam. The intention was to map the convergence of the beam to the waist, and its divergence beyond there. The rms spot widths were in the range 1.5 to 15 . At any given z position, the beam profile was scanned in about 50 steps, of which perhaps one third would be in the peak. Although the beam was present at 10 Hz, the vacuum pumping system would permit the jet of gas to be injected only at 2 Hz. Consequently, at each scan step, data were taken for four beam pulses without any gas injection. This provided a baseline measurement of the undisturbed beam. On the fifth pulse, the gas, and its plasma focusing effect, were present, and the records from this pulse could be compared with those of the previous four. Since wire scanning is not a fast procedure, this pattern, repeated for every step of the scan, allowed us to minimize the effects of drifts of the beam parameters.
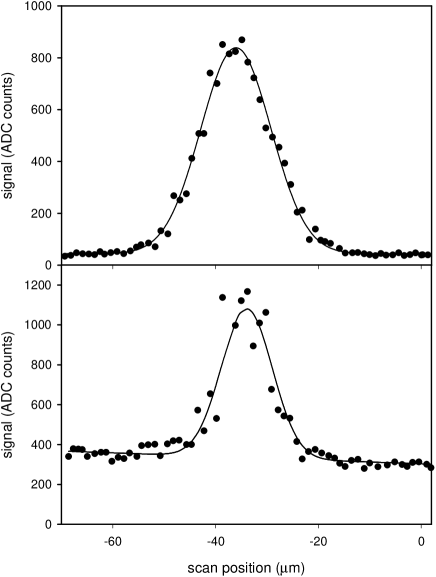
An example of the profiles obtained from an ion chamber during a scan is shown in Fig. 3. The upper graph is in the absence of nitrogen (four pulses are averaged per step). The peak is, of course, from the beam-fiber overlap, and the lack of smoothness is caused by fluctuations of the beam parameters. Details of the shape are strongly consistent at different depths in the polyethylene. The fitted peak amplitude can be used as a relative measurement of the Bremsstrahlung shower intensity at each chamber. The lower graph is from the same scan, but from pulses with the gas jet firing. The peak again is from the carbon fiber, although with only a single pulse per point, but in this plot the baseline is considerably higher. It has contributions from the beam background (also visible in the baseline of the gas-off curve), from Bremsstrahlung from the nitrogen, and from the plasma-focus synchrotron radiation. The analysis task is to separate these.
The beam background is easily removed by subtracting the baseline measured in the gas-off plot. For the first ion chamber, the “beam background” is dominated by the low energy synchrotron radiation from the conventional beam line dipoles. In fact, its ADC would saturate when strong plasma focusing was added to this. For this reason, its data are discarded from the procedure discussed below.
The Bremsstrahlung depth profile can be obtained from the ion chamber signals corresponding to the carbon fiber peak amplitudes. The shapes of the Bremsstrahlung depth profiles are consistent from run to run, within 0.4% in layer 2, and 0.2% for deeper layers. Beam intensity and spot size variations control the overall amplitude, but do not affect the profile.
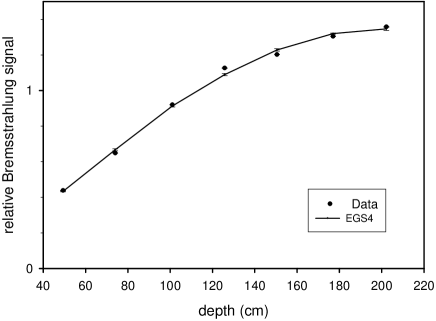
To validate the procedure, an EGS4 simulation was made of a Bremsstrahlung spectrum incident on a model of the detector stack. A comparison is shown (Fig. 4) of this simulation against the results from wire scans. The average of three scans is used, and the ordinates are simply scaled to equate the average signal strength in simulated and real chambers — no fit is made. The discrepancies are taken to be estimates of the relative sensitivities of the chambers and electronics channels, with small contributions from nonuniformity in the polyethylene. They are used to obtain correction factors for each layer. An estimate of the uncertainties in the plotted points is made from variations between scans, and among different EGS4 runs.
In order to address the performance of the system for synchrotron radiation, the EGS4 code was run on the same model of the apparatus, but with a set of individual energies from 200 keV to 150 MeV. The output for each energy and layer was incorporated in a code which simulated a dipole synchrotron radiation spectrum. It interpolated the EGS4 results at each spectrum point. Results from critical energies in the range 0.5 to 10 MeV were examined.
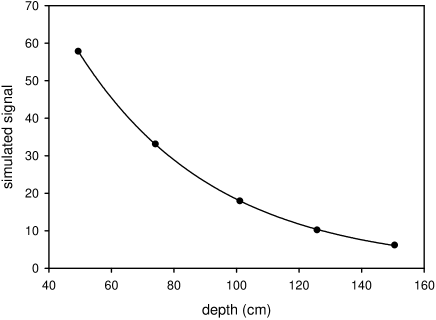
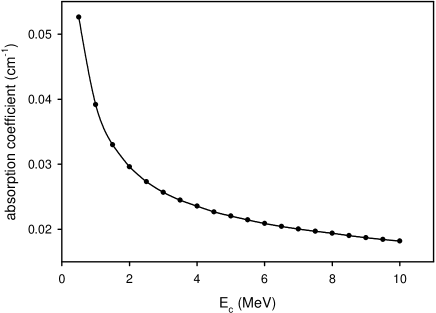
In this experiment the final two layers saw very little signal from synchrotron radiation. They were dominated by Bremsstrahlung, and this fact allows for a straightforward subtraction of the Bremsstrahlung contribution to the other chambers. A simulated depth profile of the five relevant layers is shown in Fig. 5. Superimposed is the fit of a simple three parameter exponential absorption function , which is evidently quite adequate. The absorption coefficient, , is obviously the inverse of the effective absorption length. The constant term, , is retained empirically since it improves the fits. However, it is always found to be very small, positive, and just significant statistically. A plot of the values of the absorption coefficient obtained from fits to the simulations is shown in Fig. 6 against the critical energies of the simulated spectra. This is effectively a calibration curve.
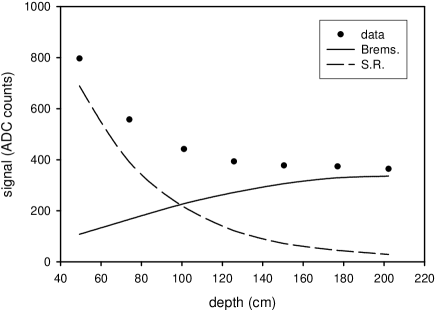
The experimental depth profile obtained from the scan baseline (caused by Bremsstrahlung from the gas plus plasma synchrotron radiation), is illustrated in Fig. 7. The gas-off background has already been subtracted and the relative chamber sensitivities corrected for. The lines in the figure are discussed below.
The Bremsstrahlung part is now to be removed. For this purpose we note that, for critical energies in the range 1 to 10 MeV, the ratio of synchrotron radiation in layers 8 and 7 should be in the range 0.66 to 0.72 (from simulation). For Bremsstrahlung the layer 8 / layer 7 ratio should be 1.027. Equating the observed signals in each of these layers to the sum of the synchrotron radiation and Bremsstrahlung contributions, and coupling these equations with the ratios just quoted, one can simply solve for the intensities of the two components. We obtain upper and lower limits to the Bremsstrahlung intensity corresponding to the full 0.66 to 0.72 range of the synchrotron radiation ratio. With the Bremsstrahlung intensity determined for the last two layers, its full depth profile can then be subtracted from the observed signals. The separate contributions from Bremsstrahlung and plasma-lens synchrotron radiation are indicated as lines in Fig. 7.
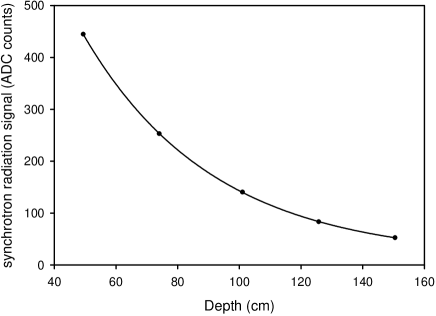
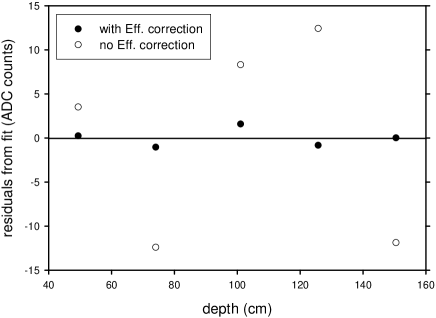
Plasma synchrotron radiation results from a scan are illustrated in Fig. 8. The exponential absorption fit is indicated. The effect of the relative sensitivity corrections of the layers is illustrated by comparing the residuals from the exponential fits, with and without the corrections, in Fig. 9. It is evident that the corrections, made using the Bremsstrahlung depth profile, substantially improve the fit to the synchrotron radiation profile. The approximation of using a dipole synchrotron radiation spectrum to parametrize the radiation from the lens is also seen to be good.
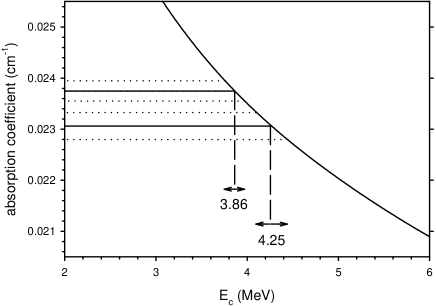
Evaluation of for two scans is illustrated graphically in Fig. 10. For one of the scans, the plasma was pre-excited by a laser, and the focusing was somewhat stronger in that case. The curve is a magnified part of the calibration curve. The synchrotron radiation absorption coefficients were determined from the fits to the data as above, and are drawn as horizontal lines intersecting the calibration curve. The uncertainties obtained from the fits and from the upper and lower limits of the Bremsstrahlung subtraction are also indicated. One can read off the equivalent dipole critical energies of the two cases: MeV for the less strongly focused case, and MeV for the pre-excited gas. The respective absorption lengths are 42.1 cm and 43.4 cm polyethylene equivalent. In Ref. [1], it is concluded that values in this range are consistent with the focusing strengths, 0.7 T/m in the x plane and 4 T/m in y, estimated from the beam waist profile measurement.
4 Conclusions
An initial demonstration has been made of a monitoring technique for the very strong focusing of high energy particle beams made possible by plasma lenses. The technique is not difficult or expensive, is robust, and could be modified for a range of applications. It makes use of the synchrotron radiation emitted by the lens, and should work over a range MeV as implemented in this example. At higher energies, the logarithmic lengthening of the electromagnetic shower with gamma ray energy would be used to monitor the profile. The principal requirement is simply that the synchrotron radiation flux be separated sufficiently from the charged beam that it becomes accessible.
5 Acknowledgments
We thank the SLAC Plasma Lens Collaboration for their efforts in running the experiment. We acknowledge especially the work of R. Kirby, F. King, G. Collet and Y.-Y. Sung on the carbon fiber scanner, W. Craddock on the gas jet, D. Walz on support systems and R. Iverson on the beam. And we particularly thank Pisin Chen who proposed the problem of monitoring the synchrotron radiation.
References
- [1] J. Ng et al., Phys. Rev. Lett. 87 (2001) 244801.
- [2] V. Balakin et al., Phys. Rev. Lett. 74 (1995) 2479.
- [3] M.J. Berger et al., XCOM: Photon Cross Sections Database, NBSIR 87- 3597: accessible at http://physics.nist.gov/PhysRefData. A good summary is given by the Particle Data Group, The European Physical Journal 15 (2000) 168.
- [4] W.R. Nelson et al., SLAC-265, Dec. 1985 (unpublished).
- [5] C. Field, Nucl. Instr. and Meth. A 360, (1995) 467.
- [6] Fairchild Semiconductor Corp., South Portland, Me 04106, U.S.A.