sioli@bo.infn.it
Use of Coulomb scattering for determining neutrino energies with MACRO
Abstract
An estimate of the energy of neutrino-induced muons in MACRO is provided by a multiple Coulomb scattering measurement. The MACRO original upward-muon data sample has been subdivided according to the reconstructed muon energy. Data in each subset are then compared with expected fluxes from atmospheric neutrinos. The results are interpreted in terms of neutrino oscillations.
1 Introduction
MACRO can be used as a neutrino detector by measuring neutrino induced muon events. From the study of the upgoing muon deficit and from the distortion of the relative angular distribution, MACRO provided evidence for neutrino oscillations (Ahlen, 1995). The tagging of the neutrino induced events was performed using a time-of-flight (TOF) technique. The results of these studies are presented at this conference in Montaruli, 2001 for the high energy sample and in Spurio, 2001 for the low energy sample.
Since the oscillation probability depends on the ratio , where is the distance travelled by neutrinos inside the earth and is the neutrino energy, an estimate of this ratio is fundamental for any oscillation analysis. For high energy muons is properly measured by MACRO using the reconstructed zenith angle of the tracked muon. As far as the is concerned, part of the neutrino energy is carried out by the hadronic component produced in the rock below the detector while the energy carried out by the muon is degraded in the propagation up to the detector level. Nevertheless, Monte Carlo simulations show that the measurement of the muon energy at the detector level still preserves information about the original neutrino energy.
Since MACRO is not equipped with a magnet, the only way to infer the muon energy is through the multiple Coulomb scattering (MCS) of muons in the radiation lengths () of detector. For this purpose, we use the streamer tube system (Ahlen, 1993), which provides the muon coordinates on a projected view. The other complementary view of the tracking system (the “strip” view) cannot be used for this purpose since the spacial resolution is too poor.
The projected displacement of a relativistic muon with energy travelling for a distance can be written as:
| (1) |
where is the muon momentum (in GeV/c) and is the amount of
crossed material in terms of radiation lengths.
In MACRO, a muon crossing the whole apparatus has
/cos and 480/cos cm,
giving, on the vertical, 10 cm/E(GeV).
The muon energy estimation can be performed up to a saturation point,
occurring when is comparable with the detector space
resolution. The MACRO streamer tube system, with a cross
section of () cm2, provides a spatial resolution of
3 cm/ 1 cm. Therefore, the muon energy
estimation through MCS is possible up to 10 GeV/.
A first energy estimation has been presented in Bakari, 2001, where the feasibility of this approach was shown. The deflection of the muons inside the detector depends on the muon energy and was measured using the digital information of the limited streamer tube system. Using Monte Carlo results to infer a muon energy from its scattering angle, data were divided into three subsamples with different average muon energy and five subsamples with different average value of . The measured event rate vs. is in good agreement with the expectations, assuming neutrino oscillations with parameters =2.5 and sin=1.
Since the interesting energy region for atmospheric neutrino oscillation studies spans from 1 GeV up to some tens of GeV, it is important to improve the spatial resolution of the detector to push the saturation point as high as possible.
We improved the MACRO spatial resolution exploiting the TDCs of the MACRO
QTP system to operate the limited streamer tubes in drift mode; first
results of this study have been presented in Scapparone, 2001.
The MACRO QTP system is equipped with a 6.6 MHz clock which corresponds to a
TDC bin size of T=150 ns.
Altought the MACRO streamer tubes, when operated in drift mode, can reach a
spacial resolution as good
as 250m (Battistoni, 2001),
in MACRO the main limitation comes from the TDC bin size.
The expected ultimate resolution is therefore
T/2mm,
where 4 cm/s is the drift velocity.
Since the QTP electronics was designed for slow monopole analysis, in order to fully understand the performance of the QTP TDCs in this context and to measure an absolute energy we did a calibration at the CERN PS-T9 test beam. A slice of the MACRO detector was reproduced in detail: absorbers made of rock excavated in the Gran Sasso tunnel, like those of MACRO, were used. Following the MACRO geometry, the tracking was performed by 14 limited streamer tube chambers, operated with the MACRO gas mixture (He(73)/n-pentane(27)). In order to study the QTP-TDC performance, we equipped the detector with standard Lecroy TDCs, with a bin size of 250 ps. In this way we were able to check the linearity of the QTP-TDC response and we computed in detail the drift velocity inside the chambers as a function of the distance from the wire. The experimental setup was exposed to muons with energy ranging from 1 GeV up to 15 GeV. Each QTP-TDC time was converted into drift circles inside the chambers. We performed dedicated runs to estimate the space resolution by removing the rock absorbers and we developed a special tracking to fit the muons along the drift radii. The distribution of the residuals of the fitted tracks showed a 2 mm, demonstrating the successful use of the QTP-TDCs to operate the streamer tube system in drift mode.
In order to implement this technique in the MACRO data, we used downgoing muons crossing the whole apparatus, muons whose average energy is around GeV. Since we were going to consider resolution of the order of few millimeters we used more than 15 million downgoing muons to align the wire positions using an iterative software procedure. After the alignment, a resolution of 3 mm was obtained. This is a factor 3.5 better than the standard resolution of the streamer tube system used in digital mode (Fig. 1). In order to compare such resolution with Monte Carlo expectations, we properly inserted inside the simulation code GMACRO the drift velocity measured with the test beam. The distribution of the MACRO downgoing muon residuals is shown in Fig. 1 (black circles) together with the GMACRO simulation (continuous line). In the same plot we superimposed the residuals distribution obtained with streamer tubes in digital mode (dashed line).
The difference between the resolution obtained at test beam ( 2 mm) with respect to that obtained with MACRO data ( 3 mm), is fully understood and comes from systematic effects such as gas mixture variations during the runs, the presence of rays produced in the rock absorbers causing earlier stops to QTP-TDCs and the residual multiple scattering suffered by the low energy tail of downgoing muons.

2 Muon energy estimation

For the muon energy estimation we followed a neural network (NN) approach.
We chose JETNET 3.0, a standard package with a multilayer perceptron
architecture and with back-propagation updating. The NN has been configured
with 7 input variables and 1 hidden layer and we choose the Manhattan
upgrading function.
For each muon the input variables considered are:
- the average of the residuals;
- the maximum of the residuals;
- the sigma of the residuals;
- the difference of the residuals of the three farthest hits along the track;
- the slope and intercept of the “progressive fit”.
As far as the “progressive fit” is concerned, it is defined as the fit of the absolute value of the residuals as a function of the number of limited streamer tube planes crossed. The slope and the intercept of this fit are very sensitive to low energy muons. While for high energy muons the absolute value of the residuals as a function of the crossed plane number is roughly constant(small slope), for a low energy muon it increases, as the muon is losing a relevant fraction of its initial energy. The NN was trained using a special set of Monte Carlo events with known input energy, crossing the detector at different zenith angles.
In Fig. 2 we show the average output of the NN as a function of the residual muon energy just before entering the detector (top) and of the neutrino energy (bottom). The output of the NN increases with the muon residual energy up to 40 GeV, corresponding to a neutrino energy 200 GeV.
3 Data analysis
For this analysis, we used the whole sample of upgoing muon events collected with the upper part of MACRO (Attico) in full operation, for a total livetime of 5.5 years. We considered upgoing muons selected by the TOF system and the muon tracks reconstructed with the standard MACRO tracking. We then selected hits belonging to the track and made from a single fired tube, to associate unambiguously the QTP-TDC time information. Spurious background hits have been avoided by requiring a time window of 2 s around the trigger time. Finally, we selected events with at least four streamer tube planes with valid QTP-TDC data. We fitted the drift circles using the same tracking developed to analyze test beam muons. After the selection cuts quoted above 348 events survived, giving an overall efficiency of about 50%.
We used the information provided by the neural network to separate the upgoing muons into different energy regions and to study therein the oscillation effects. We studied the zenith angle distributions of the upgoing muon events in four regions with different muon energy, selected according to the NN output. The same selection has been applied to simulated events.
To make a comparison between real data and Monte Carlo expectations, we performed a full simulation chain by using the Bartol neutrino flux (Agrawal, 1996) and the GRV94 DIS parton distributions (Gluck, 1995). The propagation of the muons from the interaction point up to the detector level has been done using the FLUKA99 package (Fassò, 1995), while the muon simulation inside the detector was performed with GMACRO (the GEANT 3.21 based detector simulation). For each muon crossing the apparatus, the complete history of the event was recorded (neutrino energy, interaction point, muon energy etc.).
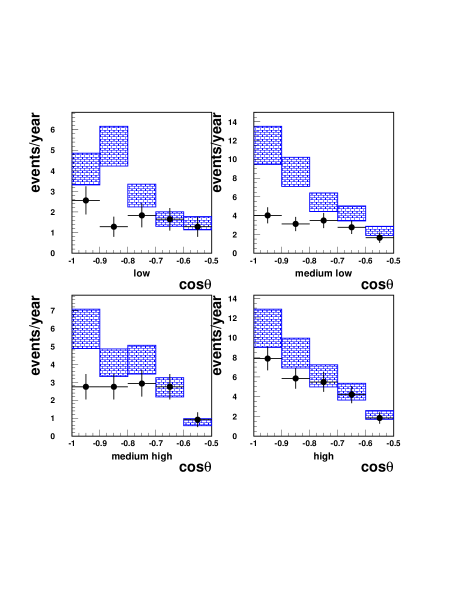
Should the upgoing muon deficit and the angular distribution distortion (with respect to the Monte Carlo expectation) pointed out by MACRO come from neutrino oscillations with parameters and sin1, such deficit and such angular distribution distortion would not manifest at all neutrino energies. The effect is expected to be stronger at low neutrino energies (E 10 GeV) and to disappear at higher energies (E100 GeV). We used the NN to separate four different neutrino energy regions whose median energy is respectively 12 GeV (low), 20 GeV (medium-low), 50 GeV (medium high) and 102 GeV (high). In Fig. 3 we show the zenith angle distributions of the upgoing muon events in the four energy regions selected compared to the expectations of Monte Carlo simulation, assuming the no-oscillation hypothesis. It is evident from the plots that at low energy a strong disagreement between data and Monte Carlo (no-oscillation hypothesis) is present, while the agreement is restored with increasing neutrino energy.
The corresponding -probabilities for the no-oscillation hypothesis in these four windows are respectively 1.8% (low), 16.8% (medium-low), 26.9% (medium-high) and 87.7 (high): the /DoF values are clearly running with the neutrino energy, spanning from 13.7/5 to 1.8/5. The has been computed using only the angular shape.


Finally, we tried to get information on the ratio . The output of the NN was calibrated on an event by event basis to have a linear response as a function of (). The obtained resolution is given in terms of / , where is the difference between the true and the reconstructed ratio, shown in Fig. 4. This result has been used to evaluate the proper binning for the distribution DATA/ Monte Carlo (i.e. the oscillation probability) as a function of . This distribution is plotted in Fig. 5. The transition from 1 to 0.5 is clear and shows a good agreement with the oscillation probability function we expect with the parameters quoted above.
4 Conclusions
The sample of upward through-going muons measured by MACRO has been analysed in terms of neutrino oscillations using multiple Coulomb scattering to infer muon energy. The improvement of the spatial resolution obtained by exploiting the TDCs contained in the QTP electronics extended the muon residual energy reconstruction up to 40 GeV (corresponding to 200 GeV for the neutrino energy). A dedicated run at the CERN PS-T9 test beam allowed us to check the MACRO QTP-TDCs and showed the feasibility of operating the limited streamer tubes in drift mode. The angular distribution of the upward going muon sample has been subdivided into four energy windows, showing the energy trend expected from the neutrino oscillation hypothesis. Moreover, we performed a study in terms of . Also in this case, the observed transition from 1 to 0.5 in the ratio of data to Monte Carlo prediction is the one expected from the neutrino oscillation hypothesis with oscillation parameters and sin=1.
References
- [Ahlen(1995)] Ahlen, S. et al, MACRO Collaboration, Phys. Lett. B357 (1995) 481; Ambrosio, M. et al., MACRO Collaboration, Phys. Lett. B434 (1998) 451.
- [Ahlen(1993)] Ahlen, S. et al, MACRO Collaboration, Nucl. Instr. & Meth A324 (1993) 337.
- [Bakari(2001)] Bakari, D. et al, Advanced Nato Workshop, Oujda, Morocco, (2001), hep-ex/0105087.
- [Battistoni(2001)] Battistoni, G. et al., Accepted by Nucl. Instr. & Meth, hep-physics/0105099.
- [Fassò(1995)] Fassó, A. et al., An update about FLUKA, Proc. 2nd workshop on Simulating Accelerator Radiation Environment, SARE-2, CERN-Geneva, 9-11, October, 1995.
- [Gluck(1995)] Gluck, M. et al, Z. Phys. C67 (1995) 433.
- [Montaruli(2001)] Montaruli, T., at this Conference.
- [Scapparone(2001)] Scapparone, E., Advanced Nato Workshop, Oujda, Morocco, (2001).
- [Spurio(2001)] Spurio, M., at this Conference.