Abstract
The decay has been studied using in-flight decays detected with ”ISTRA+” setup operating at the 25 GeV negative secondary beam of the U-70 PS. About 130K events were used for the analysis. The parameter of the vector formfactor has been measured: . The limits on the possible tensor and scalar couplings have been derived:
(stat)
(stat)
1 Introduction
The decay (Ke3) is known to be a promising one to search for an admixture of scalar (S) or tensor (T) interactions to the Standard Model (SM) V-A . This topic has been attracting significant interest during resent years and moreover some previous experiments with charged and neutral kaon beams have reported indications for some anomalous S and T signals [1], [2]. On the other hand, resent KEK [3, 4] experiment with stopped beam has reported negative results of the searches.
In our analysis we present new search for S and T couplings based on the statistics of about 130K Ke3 events. Another result of our study is the measurement of the V-A formfactor slope .
2 Experimental setup
The experiment is performed at the IHEP 70 GeV proton synchrotron U-70. The experimental apparatus ”ISTRA+” is the result of the modification of ”ISTRA-M” [5], which, in turn, evolved from ”ISTRA” that yielded important results on and decays in the late 1980’s [6]. The setup is located at the 4A negative unseparated secondary beam. The beam momentum in the measurements is GeV with . The admixture of in the beam is . The beam intensity is per 1.9 sec. U-70 spill. A schematic view of the detector is shown in Fig.1.
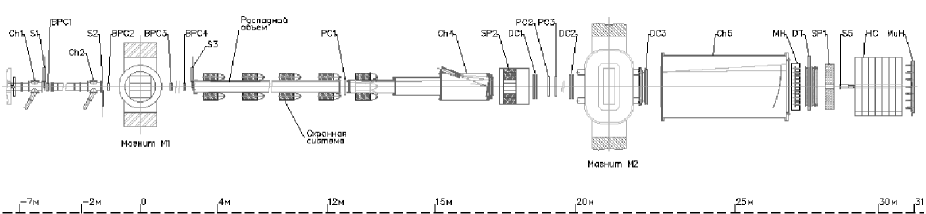
The momentum of the beam particle deflected by M1 is
measured by PC’s
with 1mm wire step, the kaon identification is done by
threshold –counters.
The 9 meter long vacuumated
decay volume is surrounded by 8 lead glass rings used to
veto low energy photons. The same role is played by – a 72–cell
lead glass calorimeter.
The decay products deflected in M2 with 1Tm field integral
are measured with – 2mm step proportional chambers;
– 1cm cell drift chambers and finally with 2cm diameter
drift tubes .
A wide aperture threshold Cerenkov counter is
filled with He and
used to trigger the electrons. is a 576-cell lead glass calorimeter,
followed by HC – a scintillator-iron sampling hadron calorimeter, subdivided
into 7 longitudinal sections 77 cells each. MH is a
1111 cell scintillating hodoscope, used to solve the ambiguity
for multitrack events and improve the time resolution of the
tracking system, MuH is a 77 cell muon hodoscope.
The trigger is provided by scintillation counters,
Cerenkov counters,
analog sum of amplitudes from the last dinodes of the and
is very loose:
,
here S4 is a scintillator counter with a hole to suppress beam halo ;
is a counter downstream the setup at the beam focus;
– a requirement for the analog sum of amplitudes from
to be larger than 700 MeV – a MIP signal. The last requirement
surveys
to suppress the decay. Some complementary triggers:
– the electron
trigger and prescaled ”decay”
trigger were used to cross-check the efficiency
of the main one.
The main difference between ”ISTRA-M” and ”ISTRA+” is in the electronics and DAQ: all the CAMAC based electronics was changed by IHEP developed MICC [7] ECL-based electronics. ”ISTRA+” has now 12 MICC crates with ADC’s, TDC’s and latches. The DAQ, described in some details in [8] is based on IHEP-developed VME master V-08 [9], which writes the MICC stream into standard VME memory. Between the spills, the information is written into PC through BIT-3 VME-PCI interface. The saturated event rate is of 1 Kb events per 1.9 sec. spill.
3 Event selection
During physics runs in November–December 1999 and March–April 2001, 206M and 363M events were logged on DLT’s. This information is supported by about 100M MC events generated with Geant3 [10]. MC generation includes realistic description of the setup: decay volume entrance windows, track chambers windows, gas, sense wires and cathode structure, Cerenkov counters mirrors and gas, shower generation in EM calorimeters etc.
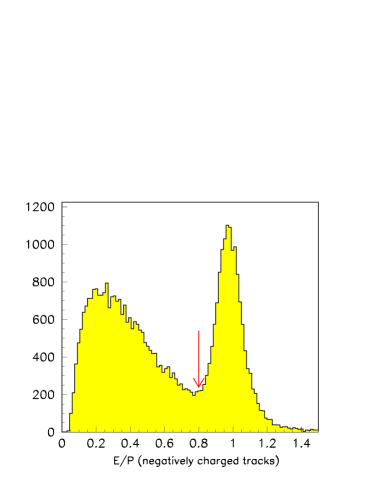
The usual first step of the data processing is the EM calorimeter calibration, using special runs with 10 GeV electrons; track system alignment, HCAL and guard system calibration with muon beam runs. The data processing starts with the beam particle reconstruction in , then the secondary tracks are looked for in ; ; and events with one good negative track are selected. The decay vertex is searched for, and a cut is introduced on the matching of incoming and decay track. The next step is to look for showers in calorimeter. A method of shower parameters reconstruction based on the MC–generated patterns( patterns) of showers is used. The matching of the charged track and a shower in is done on the basis of the difference between the track extrapolation and the shower coordinates. The electron identification is done using E/P ratio – of the energy of the shower associated with the track and the track momentum, see Fig.2.
The selection of events with the two extra showers results in spectrum shown in Fig.3.
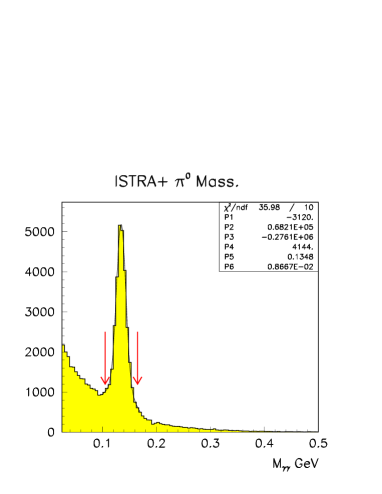
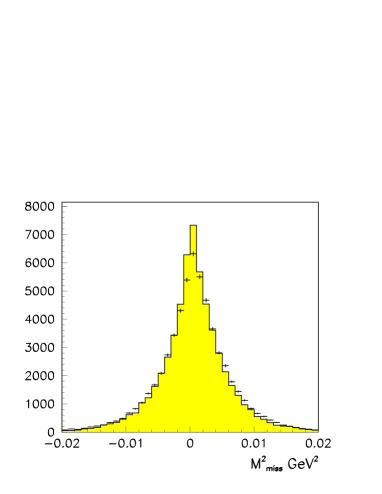
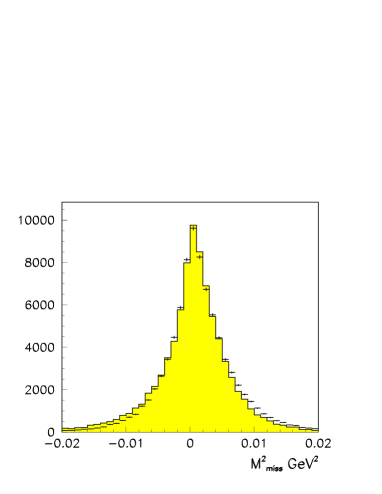
The peak has a mass of , and a resolution of 8.6 MeV. Another important variable for the selection is the missing mass squared: , where P are the corresponding four-momenta, see Fig.4. The cut is GeV2.
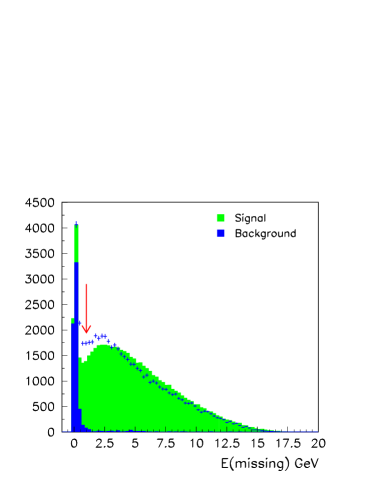
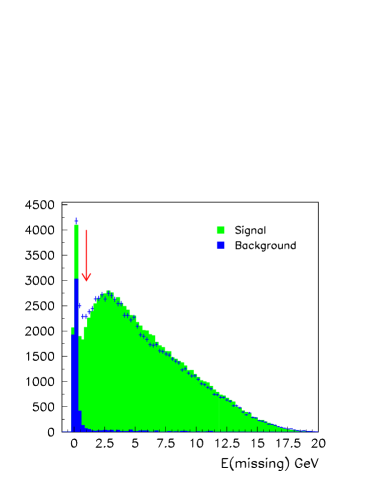
The further selection is done by the requirement that the event passes 2C fit. At the same time, similar 2C fit should fail. The missing energy after this selection is shown in Fig.5 The peak at low corresponds to the remaining background. The corresponding cut is . The surviving background is estimated from MC to be less than .
The detailed data reduction information is shown in Table.1.
| Run | 1999 | 2001 |
|---|---|---|
| on tapes | 206.544.909 | 363.002.105 |
| Beam track reconstructed | 159.459.629=77 | 268.564.958 =74 |
| One secondary track found | 81.166.929=41 | 134.227.095 =37 |
| Written to DST | 70.015.610 =34 | 107.215.783 =30 |
| identified | 1.300.958 | 1.998.719 |
| 2 showers reconstructed | 252.177 | 361.621 |
| identified | 186.850 | 251.489 |
| 96.652 | 144.642 | |
| rejected | 79.660 | 117.566 |
| accepted | 65.208 | 97.585 |
| 1 GeV | 54.009 | 79.248 |
4 Analysis
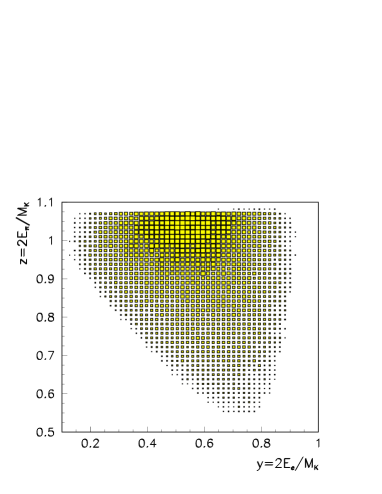
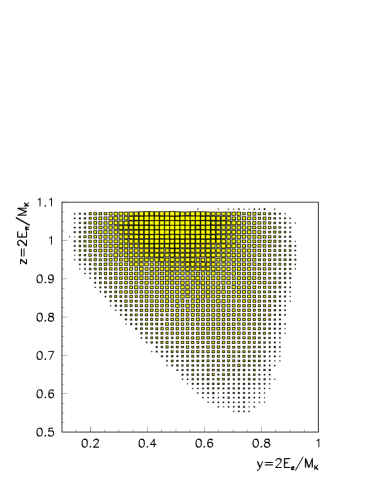
The event selection described in the previous section results in selected 54K events in 1999 data and 79K events in 2001 data. The distribution of the events over the Dalitz plot is shown in Fig.6. The variables and , where , are the energies of the electron and in the kaon c.m.s are used. The background events, as MC shows, occupy the peripheral part of the plot.
The most general Lorentz invariant form of the matrix element for the decay is [11]:
| (1) |
It consists of scalar, vector and tensor terms. are the functions of . In the Standard Model (SM) the W-boson exchange leads to the pure vector term. The ”induced” scalar and/or tensor terms, due to EW radiative corrections are negligible small, i.e the nonzero scalar/tensor form factors indicate a physics beyond SM.
The term in the vector part, proportional to is reduced(using Dirac equation) to a scalar formfactor. In the same way, the tensor term is reduced to a mixture of a scalar and a vector formfactors. The redefined (V), (S) and the corresponding Dalitz plot density in the kaon rest frame() are [12]:
| (2) | |||||
In case of Ke3 decay one can neglect the terms proportional to ; . Then, assuming linear dependence of on t: and real constants , we get:
| (3) | |||||
The procedure for the experimental extraction of the parameters , , starts from the subtraction of the MC estimated background from the Dalitz plots of Fig.6. The background normalization was determined by the ratio of the real and generated events. Then the Dalitz plots were subdivided into 20 20 cells. The background subtracted distribution of the numbers of events in the cells (i,j) over Dalitz plots, for example, in the case of simultaneous extraction of and , was fitted with the function:
| (4) |
Here are MC-generated functions, which are build up as follows: the MC events are generated with constant density over the Dalitz plot and reconstructed with the same program as for the real events. Each event carries the weight w determined by the corresponding term in formula 3, calculated using the MC-generated values for y and z. The radiative corrections according to [13] were taken into account. Then is constructed by summing up the weights of the events in the corresponding Dalitz plot cell. This procedure allows to avoid the systematics errors due to the ”migration” of the events over the Dalitz plot because of the finite experimental resolution.
5 Results
The results of the fit are summarized in Table.2. The combination of the two runs is done by the simultaneous fit. The first line corresponds to pure V-A SM fit. In the second line the tensor and in the third the scalar terms are added into the fit. All the errors presented are from the ”MINOS” procedure of the ”MINUIT” program [14] and are larger than the Gaussian ones. At present, we estimate an additional systematics error in to be . The estimate is done by comparing two runs, which differ a lot in amount of matter in the beamline and detector configuration and by varying cuts, cell size during the fit of the Dalitz plots etc.
| 1999 | 2001 | 1999+2001 | |
| 1.7 | 1.3 | 1.5 | |
| 225 | 228 |
The comparison of our results with the most recent data [1, 3, 4] shows that our statistics, at present, is the highest in the world and the statistical errors somewhat smaller than in [1, 3] and comparable with [4]. We do not confirm the observation of a significant and in [1]. Our data is in a good agreement with [3, 4] and with the theoretical calculations for : [15], done in the context of the chiral perturbation theory.
6 Summary and conclusions
The decay has been studied using in-flight decays of 25 GeV , detected by ”ISTRA+” magnetic spectrometer. Due to the high statistics, adequate resolution of the detector and good sensitivity over all the Dalitz plot space, the measurement errors are significantly reduced as compared with the previous measurements. The parameter of the vector formfactor has been measured to be:
.
The limits on the possible tensor and scalar couplings have been derived:
References
- [1] S. A. Akimenko et al., Phys. Lett. B259(1991)225.
- [2] R. J. Tesarek, hep-ex/9903069, 1999.
- [3] S. Shimizu et al., Phys. Lett. B495(2000)33.
- [4] A.S. Levchenko et al., hep-ex/0111048(2001).
- [5] V. N. Bolotov et al., ”Experimental Setup ISTRA-M to study rare decays of charged light mesons”, IHEP 95-111, Protvino, 1995.
- [6] V. N. Bolotov et al., Yad.Fiz., v44(1986)108,117; v45(1986)1652.
- [7] Yu.B.Bushnin et al., IHEP 88-47, Serpukhov, 1988; V.A.Medovikov et al., IHEP 99-60, Protvino, 1999; A.N.Isaev et al., Prib.Tekh.Exp. N3(2000)41; M.M.Vasiliev et al., Prib.Tekh.Eksp. N5(2000)45.
- [8] A.Filin et al., ”The Linux Based Distributed Data Acquisition System for the ISTRA+ Experiment” Proceedings of the CHEP2001 Conference, Bejing, 2001.
- [9] V.N. Govorun et al., IHEP preprint in preparation.
- [10] R. Brun et al., CERN-DD/EE/84-1.
- [11] H. Steiner et al., Phys.Lett. B36(1971)521.
- [12] M.V.Chizhov hep-ph/9511287(1995).
- [13] E.S.Grinberg, Phys. Rev. 162 (1967), 1570.
- [14] F.James, M.Roos, CERN D506,1989.
- [15] The DANE Physics Handbook, v1, p.39, Frascati,1992 and references therein.