SLAC-PUB-9075
BABAR-PROC-01/86
December, 2001
Measurements of Violation, Mixing and Lifetimes of Mesons with the BABAR Detector
Sören Prell
University of California at San Diego
Department of Physics
9500 Gilman Drive, La Jolla, CA 92093
(for the B AB AR Collaboration)
Abstract
We report the observation of violation in the meson system. Using a novel technique for time-dependent measurements, we measure a non-zero value for the -violating amplitude at the 4.1 level. We also report on precision measurements of the and lifetimes and the mixing frequency obtained with the same technique, and on a first measurement of the time-dependent -violating amplitude in decays.
Contributed to the Proceedings of the
9th International Symposium on Heavy Flavor Physics,
9/10/2001—9/13/2001, Caltech, Pasadena
Stanford Linear Accelerator Center, Stanford University, Stanford, CA 94309
Work supported in part by Department of Energy contract DE-AC03-76SF00515.
1 Introduction
violation has been a central concern of particle physics since its discovery in 1964 in the decays of mesons [1]. An elegant explanation of the origin of violation was proposed by Kobayashi and Maskawa, as a complex phase in the three-generation CKM quark-mixing matrix [2]. In this picture, measurements of -violating asymmetries in the time distributions of decays to charmonium final states are expected to be large and provide a direct test of the Standard Model of electroweak interactions [3].
We present measurements of time-dependent -asymmetries in samples of fully reconstructed decays to charmonium-containing eigenstates () and to the final state. The data for these studies were recorded at the resonance by the BABAR detector at the PEP-II asymmetric-energy collider at the Stanford Linear Accelerator Center.
When the decays, the -wave state evolves coherently until one of the mesons decays. In one of four time-order and flavor configurations, if the tagging meson decays first, and as a , the other meson must be a at that same time . It then evolves independently, and can decay into a eigenstate at a later time . The time between the two decays is a signed quantity made measurable by producing the with a boost along the collision () axis, with nominal energies of 9.0 and 3.1 for the electron and positron beams. The measured distance between the two decay vertices provides a good estimate of the corresponding time interval ; the average value of is .
We examine each of the events in the sample for evidence that the other neutral meson decayed as a or a (flavor tag). The distribution of the decay rate when the tagging meson is a is given by
| (1) |
where is the time between the two decays, is the lifetime [4], is the mixing frequency [4], and the lifetime difference between neutral mass eigenstates is assumed to be negligible. The sine term in Eq. 1 is due to interference between direct decay and decay after mixing, and the cosine term is due to direct violation. The -violating parameters and are defined in terms of a complex parameter that depends on both mixing and on the amplitudes describing and decay to a common final state [5]:
| (2) |
A difference between the and distributions or a asymmetry for either flavor tag is evidence for violation.
In the Standard Model for charmonium-containing decays, is the eigenvalue of the state and is an angle of the Unitarity Triangle of the three-generation CKM matrix [2]. Thus, the time-dependent -violating asymmetry is
| (3) |
The analogous time-dependent -violating asymmetry in the decay arises from interference between mixing and decay amplitudes, and interference between the (tree) and (penguin) decay amplitudes. If the decay proceeds purely through the tree process, the complex parameter is directly related to CKM matrix elements and and , where .
However, recent theoretical estimates suggest that the contribution from the gluonic penguin amplitude can be significant [6] leading to and , where depends on the magnitudes and strong phases of the tree and penguin amplitudes.
We also present precise measurements of the - mixing frequency and the neutral and charged lifetimes. These measurements use the same vertexing algorithm and calculation as the measurements of the -asymmetries. In addition, for the measurement, the same flavor tagging algorithm as for the analyses is used. These measurements are amongst the most precise available and provide a good validation of the novel technique to study time-dependent decays.
In all analyses the values of the parameters under study ( lifetimes, , , and ) were hidden to eliminate possible experimenter’s bias until event selection, reconstruction method, and fitting procedures were finalized and systematic errors were determined.
2 The BABAR Detector
A detailed description of the BABAR detector can be found in Ref. [7]. Charged particles are detected and their momenta measured by a combination of a silicon vertex tracker (SVT) consisting of five double-sided layers and a central drift chamber (DCH), in a 1.5-T solenoidal field. The average vertex resolution in the direction is 70 for a fully reconstructed meson. We identify leptons and hadrons with measurements from all detector systems, including the energy loss () in the DCH and SVT. Electrons and photons are identified by a CsI electromagnetic calorimeter (EMC). Muons are identified in the instrumented flux return (IFR). A Cherenkov ring imaging detector (DIRC) covering the central region, together with the information, provides - separation of at least three standard deviations for decay products with momentum greater than 250 in the laboratory.
3 Measurement of Lifetimes and
The measurements of the charged and neutral lifetimes and the - mixing frequency are based on a sample of approximately 23 million pairs.
3.1 Exclusive Reconstruction
Samples of and mesons are reconstructed in the modes , , , and , , . Charged and neutral candidates are formed by combining a with a or . candidates are reconstructed in the decay channels , , and and candidates in the decay channels and . We reconstruct and in the decays to and and the decay to .
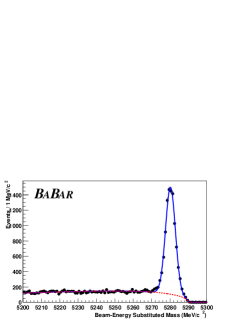
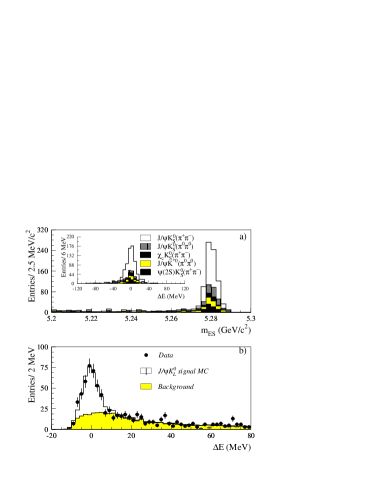
Continuum background is suppressed by requirements on the normalized second Fox-Wolfram moment [8] for the event and on the angle between the thrust axes of and of the other in the event. candidates are identified by the difference between the reconstructed energy and the beam energy in the frame, and the beam-energy substituted mass calculated from and the reconstructed momentum. We require and . The distributions of for selected candidates in 30 fb-1 is shown in Fig. 1.
3.2 Measurement
The decay time difference, , between decays is determined from the measured separation along the axis between the and the vertices. This is converted into using the boost and correcting on an event-by-event basis for the direction of the mesons. The resolution of the measurement is dominated by the resolution of the decay vertex. This vertex uses all tracks in the event except those incorporated in . An additional constraint is provided by a calculated production point and three-momentum, determined from the three-momentum of the candidate, its decay vertex, and the average position of the interaction point and the boost. Reconstructed or candidates are used as input to the fit in place of their daughters in order to reduce bias due to long-lived particles. Tracks with a large contribution to the are iteratively removed from the fit, until all remaining tracks have a reasonable fit probability. Candidates with and are retained. For the measurement of the lifetimes, we require that at least two tracks are included in the vertex .
Two different parameterizations are used to model the decay-time difference resolution functions. In the measurements of , , and , the resolution function is approximated by a sum of three Gaussian distributions with different means and widths ,
| (4) |
where is the difference between the measured and true values. For the core and tail Gaussians, the widths are the scaled event-by-event measurement error, , derived from the vertex fits. The third Gaussian, with a fixed width of , accounts for less than 1% of outlier events with incorrectly reconstructed vertices. The three Gaussian resolution function is not suited for the measurement of the lifetimes because strong correlations lead to increased statistical errors. Studies with Monte Carlo simulation and data show that the sum of a zero-mean Gaussian distribution and its convolution with an exponential provides a good trade-off between statistical and systematic uncertainties:
| (5) | |||
The parameters are the fraction in the core Gaussian component, a scale factor for the per-event errors , and the factor in the effective time constant of the exponential which accounts for charm decays. outlier events are modeled the same way as in the three Gaussian resolution function. The resolution function parameters are assumed to be the same for all and decay modes. This assumption is confirmed by Monte Carlo simulation studies. The resolution functions differ only slightly between and mesons due to different mixtures of and mesons in the decays and we use a single set of resolution function parameters for both and in the lifetime fits.
3.3 Lifetime Results
We extract the and lifetimes from an unbinned maximum likelihood fit to the distributions of the selected candidates. The probability for an event to be signal is estimated from fits (Fig. 1) and the value of the candidate. In the likelihood, the probability density for the signal events is given by
| (6) |
and the background distribution for each species is empirically modeled by the sum of a prompt component and a lifetime component convolved with the same resolution function, but with a separate set of parameters. The likelihood fit involves 17 free parameters in addition to the and the lifetimes: 12 to describe the background distributions and 5 for the signal resolution function. The charged lifetime is replaced with to estimate the statistical error on the ratio .
We determine the and meson lifetimes and their ratio to be:
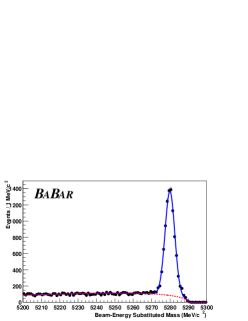
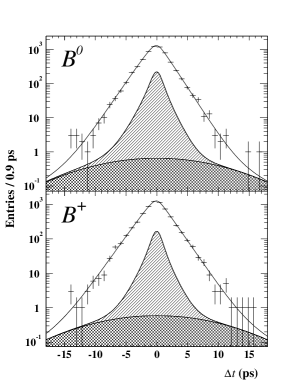
These are the most precise measurements to date [9] and are consistent with the world averages [4]. The resolution function parameters are consistent with those found in a Monte Carlo simulation that includes detector alignment effects. Figure 2 shows the results of the likelihood fit superimposed on the distributions for and events. With the current data sample these measurements are still statistically limited. The dominant systematic errors arise from uncertainties in the description of the combinatorial background and of events with large values, the use of a common time resolution function for and and from limited Monte Carlo statistics.
3.4 Flavor Tagging
The measurements of , and require knowledge of the = flavor. We use the same tagging algorithm in the three analyses to determine the flavor from the charges of its decay products.
The charge of energetic electrons and muons from semileptonic decays, kaons, soft pions from decays, and high momentum charged particles is correlated with the flavor of the decaying quark. Each event is assigned to one of four hierarchical, mutually exclusive tagging categories or has no flavor tag. A lepton tag requires an electron (muon) candidate with a center-of-mass momentum . This efficiently selects primary leptons and reduces contamination due to oppositely-charged leptons from charm decays. Events meeting these criteria are assigned to the Lepton category unless the lepton charge and the net charge of all kaon candidates indicate opposite tags. Events without a lepton tag but with a non-zero net kaon charge are assigned to the Kaon category. All remaining events are passed to a neural network algorithm whose main inputs are the momentum and charge of the track with the highest center-of-mass momentum, and the outputs of secondary networks, trained with Monte Carlo samples to identify primary leptons, kaons, and soft pions. Based on the output of the neural network algorithm, events are tagged as or and assigned to the NT1 (more certain tags) or NT2 (less certain tags) category, or not tagged at all. The tagging power of the NT1 and NT2 categories arises primarily from soft pions and from recovering unidentified isolated primary electrons and muons. The yields, efficiencies, purities and mistag rates for each tagging category are listed in Table. 1.
| Category | Tagged | Efficiency (%) | Purity (%) | |
|---|---|---|---|---|
| Lepton | ||||
| Kaon | ||||
| NT1 | ||||
| NT2 | ||||
| Total |
3.5 Mixing Result
The value of is extracted from the tagged flavor-eigenstate sample with a simultaneous unbinned likelihood fit to the distributions of both unmixed () and mixed ( and ) events. The PDFs for the unmixed and mixed signal events for the tagging category are given by
| (7) |
Some resolution function parameters are allowed to differ for each tagging category to account for shifts due to inclusion of charm decay products in the tag vertex. The PDFs are extended to include background terms, different for each tagging category. The probability that a candidate is a signal event is determined from a fit to the observed distribution for its tagging category. The distributions of the combinatorial background are described with a zero lifetime component and a non-oscillatory component with non-zero lifetime. Separate resolution function parameters are used for signal and background to minimize correlations.
The likelihood fit involves a total of 34 parameters, including (1), the mistag rates and mistag differences (8), resolution function parameters (9) and background parameters (16). We display the result of the likelihood fit by using the mixing asymmetry,
| (8) |
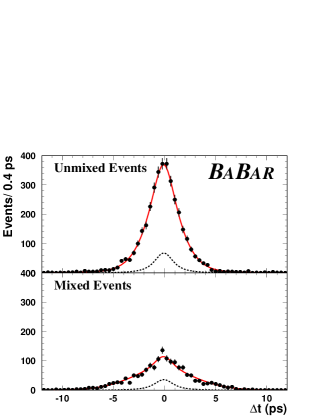
If flavor tagging and determination were perfect, the asymmetry as a function of would be a cosine with unit amplitude. The amplitude is diluted by mistag probabilities and the resolution. The distributions of mixed and unmixed events, and their asymmetry, , are shown in Fig. 2 and 3 along with projections of the fit result. The probability to obtain a smaller likelihood is .
Systematic uncertainties in the measurement arise from various sources. The conversion of to introduces an uncertainty () due to the limited knowledge of the PEP-II boost, the length scale of BABAR and the momentum vector in the frame. Systematic uncertainties related to the resolution function (), are attributed to the choice of the parameterization, the description of outliers, and the capability of the resolution model to deal with various plausible misalignment scenarios applied to the Monte Carlo simulation. The parameters of the background distribution are left free in the likelihood fit, but systematic errors (), are introduced by the uncertainty in signal probabilities, parameterization of the background distributions and resolution function, and the small amount of correlated background. Finally, statistical limitations of Monte Carlo validation tests (), the full size of a (negative) correction obtained from Monte Carlo (), and the variation of the lifetime [4] () contribute. These contributions added in quadrature yield a total systematical error of 0.016 .
In conclusion, the - mixing frequency is determined with a new time-dependent technique from tagged fully-reconstructed decays to be
This preliminary result is one of the single most precise measurements available, and is consistent with the current world average [4] and a recent BABAR measurement with a dilepton sample [10]. The error on is still dominated by statistics, leaving substantial room for further improvement as more data are accumulated.
4 Measurement of
In 32 million , we extract from a sample of fully reconstructed decays () to final states with (, , ), () and ( with ) [11].
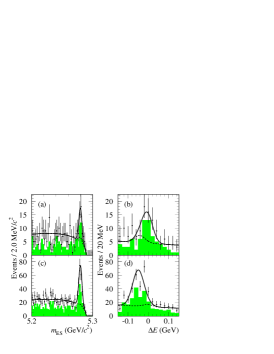
The measurement is made with a simultaneous unbinned likelihood fit to the distributions of the tagged and samples. The distribution of the former is given by Eq. 1, with . The sample evolves according to the PDF for flavor oscillations as described in the previous section. The amplitudes for the -asymmetries and for the flavor oscillations are reduced by the same factor due to wrong tags. Both distributions are convolved with a common resolution function and backgrounds are accounted for by adding terms to the likelihood, incorporated with different assumptions about their evolution and convolved with a separate resolution function. Events are assigned signal and background probabilities based on the (all modes except ) or () distributions shown in Fig. 4. Separate resolution functions parameters have been used for the data collected in 1999-2000 and 2001, due to the significant improvement in the SVT alignment.

A total of 45 parameters are varied in the likelihood fit, including (1), mistag fractions and differences (8), parameters for the signal resolution (16), and parameters for background time dependence (9), resolution (3) and mistag fractions (8). The determination of the mistag fractions and signal resolution function is dominated by the large sample. The largest correlation between and any linear combination of the other free parameters is only 0.13. We fix and [4].
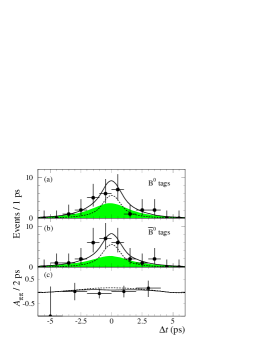
Figure 4 shows the distributions and as a function of overlaid with the likelihood fit result for the and samples. The probability of obtaining a lower likelihood is 27%. The simultaneous fit to all decay modes and flavor decay modes yields
The dominant sources of systematic error are the parameterization of the resolution function (0.03), due in part to residual uncertainties in SVT alignment, possible differences in the mistag fractions between the and samples (0.03), and uncertainties in the level, composition, and asymmetry of the background in the selected events (0.02). The systematic errors from uncertainties in and and from the parameterization of the background in the sample are small; an increase of in the value for decreases by 0.015.
| Sample | Purity (%) | ||
| ,, | 0.560.15 | ||
| 0.700.34 | |||
| 0.821.00 | |||
| Full sample | 0.590.14 | ||
| non- sample | 0.020.04 | ||
| Charged non- sample | 0.030.04 |
The large sample of reconstructed events allows a number of consistency checks, including separation of the data by decay mode, tagging category and flavor. The results of fits to some subsamples and to the samples of non- decay modes are shown in Table 2. For the latter, no statistically significant asymmetry is found.
If is allowed to float in the fit to the sample, which has high purity and requires minimal assumptions on backgrounds, we obtain . The sources of systematic error are the same as in the analysis.
The measurement of establishes violation in the meson system at the level. This significance is computed from the sum in quadrature of the statistical and additive systematic errors. The probability of obtaining this value or higher in the absence of violation is less than . The corresponding probability for the modes alone is .
5 Measurement of
We reconstruct neutral mesons decaying to , where and refer to or in a sample of 33 million . The data set includes collected on the resonance and collected below the threshold used for continuum background studies.
We select candiates in the region and and apply requirements on track multiplicity and event topology. The total number of events satisfying these criteria is . This sample contains background, mostly due to random combinations of tracks produced in events. We extract signal and background yields for , , and decays, and the amplitudes of the sine () and cosine () oscillation terms simultaneously from an unbinned likelihood fit. We parameterize the component in terms of the total yield and the -violating charge asymmetry . Background parameters are determined from and sideband regions.
Discrimination between signal and background is based on , , and a Fisher discriminant [12] constructed from the scalar sum of the CM momenta of tracks and photons (excluding tracks from the candidate) and between pions and kaon tracks on the Cherenkov angle measurement from the DIRC. The inclusion of events with no flavor tag improves the signal yield estimates and provides a larger sample for determining background shape parameters in the likelihood fit.
There are free parameters in the fit. In addition to the -violating parameters , , and (3), the fit determines signal and background yields (6), the background charge asymmetry (1), and parameters describing the background shapes in , , and (8). We fix and [4]. The PDF for signal decays is given by Eq. 1, modified to include mistags and convolved with the signal resolution function. The PDF for signal events takes into account – mixing and decays are parameterized as an exponential convolved with the resolution function.
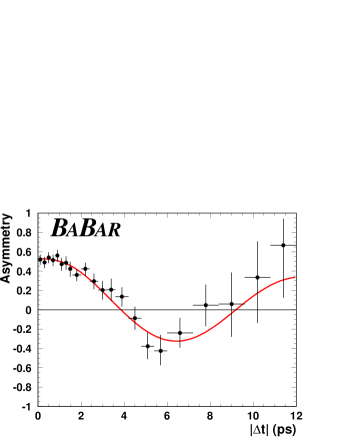
Figure 5 shows distributions of and for events enhanced in signal decays based on likelihood ratios and the distributions and asymmetry for tagged events enhanced in signal decays (approximately , , and events satisfy this selection).
In conclusion, in a sample of million , we find , , and events. These yields are consistent with the branching fractions reported in Ref. [12]. We measure the following parameters:
The correlation between and is , while is uncorrelated with and . Systematic errors on , , and arise primarily from uncertainties in PDF shapes, tagging efficiencies and dilutions, , and .
6 Summary and Outlook
We have observed violation in the neutral system at the 4.1 level using a sample of fully reconstructed decays to eigenstates. With the same novel technique of time-dependent measurements, we have determined the and lifetimes and the mixing frequency with high precision. In addition, we have presented the first measurement of the time-dependent asymmetry in decays. All results are limited by the data sample size and we expect improved measurements from the rapidly growing BABAR data sample in the near future especially for the violating asymmetries.
References
- [1] J.H. Christenson et al. Phys. Rev. Lett. 13, 138 (1964).
-
[2]
N. Cabibbo, Phys. Rev. Lett. 10, 531 (1963);
M. Kobayashi and T. Maskawa, Prog. Th. Phys. 49, 652 (1973). -
[3]
A.B. Carter and A.I. Sanda, Phys. Rev. D23, 1567 (1981);
I.I. Bigi and A.I. Sanda, Nucl. Phys. B193, 85 (1981). - [4] Particle Data Group, D.E. Groom et al., Eur. Phys. Jour. C 15, 1 (2000).
- [5] See, for example, L. Wolfenstein, Eur. Phys. Jour. C 15, 115 (2000).
-
[6]
M. Beneke, G. Buchalla, M. Neubert, and C.T. Sachrajda, Nucl. Phys. B 606, 245 (2001);
Y.Y. Keum, H-n. Li, and A.I. Sanda, Phys. Rev. D 63, 054008 (2001);
M. Ciuchini et al., Phys. Lett. B 515, 33 (2001). - [7] BABAR Collaboration, B. Aubert et al., BABAR-PUB-01/08, to appear in Nucl. Instrum. Methods.
- [8] G.C. Fox and S. Wolfram, Phys. Rev. Lett. 41, 1581 (1978).
- [9] BABAR Collaboration, B. Aubert et al. Phys. Rev. Lett. 87, 201803 (2001).
- [10] T. Brandt, contribution to this conference.
-
[11]
BABAR Collaboration, B. Aubert et al.
Phys. Rev. Lett. 86, 2515 (2001);
BABAR Collaboration, B. Aubert et al. Phys. Rev. Lett. 87, 091801 (2001). - [12] BABAR Collaboration, B. Aubert et al., Phys. Rev. Lett. 87, 151802 (2001).