EUROPEAN ORGANIZATION FOR NUCLEAR RESEARCH
CERN–EP/2001–085
28th November 2001
Production of D mesons
in hadronic Z decays
The ALEPH Collaboration
111See the following pages for the list of authors.
Abstract
The production rates of the orbitally excited D mesons, D and D, are measured with the 4.1 million hadronic Z decays recorded by the ALEPH detector during 1991–1995. The D mesons are reconstructed in the decay modes D D∗+K0, D D∗0K+ and D D0K+. The production rate of the D is measured to be f (Z D) , under the assumption that the two considered decay modes of the D saturate the branching ratio. The production rate of the D is determined to be f (Z D) , assuming that the branching fraction of the decay D D0K+ is 45%. The production rates in Z c and Z b decays are measured separately.(submitted to Phys. Lett. )
The ALEPH Collaboration
A. Heister, S. Schael
Physikalisches Institut das RWTH-Aachen, D-52056 Aachen, Germany
R. Barate, I. De Bonis, D. Decamp, C. Goy, J.-P. Lees, E. Merle, M.-N. Minard, B. Pietrzyk
Laboratoire de Physique des Particules (LAPP), IN2P3-CNRS, F-74019 Annecy-le-Vieux Cedex, France
G. Boix, S. Bravo, M.P. Casado, M. Chmeissani, J.M. Crespo, E. Fernandez, M. Fernandez-Bosman, Ll. Garrido,15 E. Graugés, M. Martinez, G. Merino, R. Miquel,27 Ll.M. Mir,27 A. Pacheco, H. Ruiz
Institut de Física d’Altes Energies, Universitat Autònoma de Barcelona, E-08193 Bellaterra (Barcelona), Spain7
A. Colaleo, D. Creanza, M. de Palma, G. Iaselli, G. Maggi, M. Maggi, S. Nuzzo, A. Ranieri, G. Raso,23 F. Ruggieri, G. Selvaggi, L. Silvestris, P. Tempesta, A. Tricomi,3 G. Zito
Dipartimento di Fisica, INFN Sezione di Bari, I-70126 Bari, Italy
X. Huang, J. Lin, Q. Ouyang, T. Wang, Y. Xie, R. Xu, S. Xue, J. Zhang, L. Zhang, W. Zhao
Institute of High Energy Physics, Academia Sinica, Beijing, The People’s Republic of China8
D. Abbaneo, P. Azzurri, O. Buchmüller,25 M. Cattaneo, F. Cerutti, B. Clerbaux, H. Drevermann, R.W. Forty, M. Frank, F. Gianotti, T.C. Greening,29 J.B. Hansen, J. Harvey, D.E. Hutchcroft, P. Janot, B. Jost, M. Kado,27 P. Mato, A. Moutoussi, F. Ranjard, L. Rolandi, D. Schlatter, O. Schneider,2 G. Sguazzoni, W. Tejessy, F. Teubert, A. Valassi, I. Videau, J. Ward
European Laboratory for Particle Physics (CERN), CH-1211 Geneva 23, Switzerland
F. Badaud, A. Falvard,22 P. Gay, P. Henrard, J. Jousset, B. Michel, S. Monteil, J-C. Montret, D. Pallin, P. Perret
Laboratoire de Physique Corpusculaire, Université Blaise Pascal, IN2P3-CNRS, Clermont-Ferrand, F-63177 Aubière, France
J.D. Hansen, J.R. Hansen, P.H. Hansen, B.S. Nilsson, A. Wäänänen
Niels Bohr Institute, DK-2100 Copenhagen, Denmark9
A. Kyriakis, C. Markou, E. Simopoulou, A. Vayaki, K. Zachariadou
Nuclear Research Center Demokritos (NRCD), GR-15310 Attiki, Greece
A. Blondel,12 G. Bonneaud, J.-C. Brient, A. Rougé, M. Rumpf, M. Swynghedauw, M. Verderi, H. Videau
Laboratoire de Physique Nucléaire et des Hautes Energies, Ecole Polytechnique, IN2P3-CNRS, F-91128 Palaiseau Cedex, France
V. Ciulli, E. Focardi, G. Parrini
Dipartimento di Fisica, Università di Firenze, INFN Sezione di Firenze, I-50125 Firenze, Italy
A. Antonelli, M. Antonelli, G. Bencivenni, G. Bologna,4 F. Bossi, P. Campana, G. Capon, V. Chiarella, P. Laurelli, G. Mannocchi,5 F. Murtas, G.P. Murtas, L. Passalacqua, M. Pepe-Altarelli,24 P. Spagnolo
Laboratori Nazionali dell’INFN (LNF-INFN), I-00044 Frascati, Italy
A. Halley, J.G. Lynch, P. Negus, V. O’Shea, C. Raine,4 A.S. Thompson
Department of Physics and Astronomy, University of Glasgow, Glasgow G12 8QQ,United Kingdom10
S. Wasserbaech
Department of Physics, Haverford College, Haverford, PA 19041-1392, U.S.A.
R. Cavanaugh, S. Dhamotharan, C. Geweniger, P. Hanke, G. Hansper, V. Hepp, E.E. Kluge, A. Putzer, J. Sommer, K. Tittel, S. Werner,19 M. Wunsch19
Kirchhoff-Institut für Physik, Universität Heidelberg, D-69120 Heidelberg, Germany16
R. Beuselinck, D.M. Binnie, W. Cameron, P.J. Dornan, M. Girone,1 N. Marinelli, J.K. Sedgbeer, J.C. Thompson14
Department of Physics, Imperial College, London SW7 2BZ, United Kingdom10
V.M. Ghete, P. Girtler, E. Kneringer, D. Kuhn, G. Rudolph
Institut für Experimentalphysik, Universität Innsbruck, A-6020 Innsbruck, Austria18
E. Bouhova-Thacker, C.K. Bowdery, A.J. Finch, F. Foster, G. Hughes, R.W.L. Jones, M.R. Pearson, N.A. Robertson
Department of Physics, University of Lancaster, Lancaster LA1 4YB, United Kingdom10
K. Jakobs, K. Kleinknecht, G. Quast,6 B. Renk, H.-G. Sander, H. Wachsmuth, C. Zeitnitz
Institut für Physik, Universität Mainz, D-55099 Mainz, Germany16
A. Bonissent, J. Carr, P. Coyle, O. Leroy, P. Payre, D. Rousseau, M. Talby
Centre de Physique des Particules, Université de la Méditerranée, IN2P3-CNRS, F-13288 Marseille, France
F. Ragusa
Dipartimento di Fisica, Università di Milano e INFN Sezione di Milano, I-20133 Milano, Italy
A. David, H. Dietl, G. Ganis,26 K. Hüttmann, G. Lütjens, C. Mannert, W. Männer, H.-G. Moser, R. Settles, H. Stenzel, W. Wiedenmann, G. Wolf
Max-Planck-Institut für Physik, Werner-Heisenberg-Institut, D-80805 München, Germany161616Supported by the Bundesministerium für Bildung, Wissenschaft, Forschung und Technologie, Germany.
J. Boucrot, O. Callot, M. Davier, L. Duflot, J.-F. Grivaz, Ph. Heusse, A. Jacholkowska,22 J. Lefrançois, J.-J. Veillet, C. Yuan
Laboratoire de l’Accélérateur Linéaire, Université de Paris-Sud, IN2P3-CNRS, F-91898 Orsay Cedex, France
G. Bagliesi, T. Boccali, L. Foà, A. Giammanco, A. Giassi, F. Ligabue, A. Messineo, F. Palla, G. Sanguinetti, A. Sciabà, R. Tenchini,1 A. Venturi,1 P.G. Verdini
Dipartimento di Fisica dell’Università, INFN Sezione di Pisa, e Scuola Normale Superiore, I-56010 Pisa, Italy
G.A. Blair, G. Cowan, M.G. Green, T. Medcalf, A. Misiejuk, J.A. Strong, P. Teixeira-Dias, J.H. von Wimmersperg-Toeller
Department of Physics, Royal Holloway & Bedford New College, University of London, Egham, Surrey TW20 OEX, United Kingdom10
R.W. Clifft, T.R. Edgecock, P.R. Norton, I.R. Tomalin
Particle Physics Dept., Rutherford Appleton Laboratory, Chilton, Didcot, Oxon OX11 OQX, United Kingdom10
B. Bloch-Devaux,1 P. Colas, S. Emery, W. Kozanecki, E. Lançon, M.-C. Lemaire, E. Locci, P. Perez, J. Rander, J.-F. Renardy, A. Roussarie, J.-P. Schuller, J. Schwindling, A. Trabelsi,21 B. Vallage
CEA, DAPNIA/Service de Physique des Particules, CE-Saclay, F-91191 Gif-sur-Yvette Cedex, France17
N. Konstantinidis, A.M. Litke, G. Taylor
Institute for Particle Physics, University of California at Santa Cruz, Santa Cruz, CA 95064, USA13
C.N. Booth, S. Cartwright, F. Combley,4 M. Lehto, L.F. Thompson
Department of Physics, University of Sheffield, Sheffield S3 7RH, United Kingdom10
K. Affholderbach,28 A. Böhrer, S. Brandt, C. Grupen, A. Ngac, G. Prange, U. Sieler
Fachbereich Physik, Universität Siegen, D-57068 Siegen, Germany16
G. Giannini
Dipartimento di Fisica, Università di Trieste e INFN Sezione di Trieste, I-34127 Trieste, Italy
J. Rothberg
Experimental Elementary Particle Physics, University of Washington, Seattle, WA 98195 U.S.A.
S.R. Armstrong, K. Berkelman, K. Cranmer, D.P.S. Ferguson, Y. Gao,20 S. González, O.J. Hayes, H. Hu, S. Jin, J. Kile, P.A. McNamara III, J. Nielsen, Y.B. Pan, J.H. von Wimmersperg-Toeller, W. Wiedenmann, J. Wu, Sau Lan Wu, X. Wu, G. Zobernig
Department of Physics, University of Wisconsin, Madison, WI 53706, USA11
G. Dissertori
Institute for Particle Physics, ETH Hönggerberg, HPK, 8093 Zürich, Switzerland.
1 Introduction
Four orbitally-excited D mesons, with angular momentum , are expected to exist in addition to the pseudoscalar and vector mesons Ds and D. In the Heavy Quark Effective Theory [1, 2] the spin of the light quark couples with the orbital angular momentum to give or . When coupled to the spin of the heavy quark, two doublets are obtained with the quantum numbers and , respectively. These states are expected to decay mainly into D K or D∗ K modes.
Only certain S- and D-wave decays are allowed by spin and parity conservation. The states of the doublet decay via S-wave transitions and are therefore expected to be broad ( MeV); they have not been observed yet. The doublet states are much narrower since they can only decay via D-wave modes. The two narrow states222The notation used follows that of the Particle Data Group [7] for the D∗∗ mesons. D and D have been observed by ARGUS and CLEO [3, 4, 5]. At LEP, D mesons have been observed by OPAL [6]. The properties of the four D states are listed in Table 1. The actual physical particles could be superpositions of the individual states.
In this analysis the production rates of the two narrow states are measured in the decay modes333Throughout this letter the notation used for particles implies the charge conjugate modes as well. D D∗+K0, D D∗0K+ and D D0K+. In Z c events, D mesons are produced in the fragmentation of primary c-quarks, whereas in Z b events they can only be produced in decays of b hadrons. To study these two contributions separately, b- and c-quark-enriched event samples are also used.
D0 K+ D+ K0 D∗0 K+ D∗+ K0 Mass [MeV/ ] Width [MeV] D D-wave D-wave [7] (95% CL) [7] D S-wave S-wave - [8] D S-wave S-wave - [8] D D-wave D-wave D-wave D-wave [7] [7]
2 The ALEPH detector
The ALEPH detector and its performance are described in detail elsewhere [9, 10]. Only a brief overview of the apparatus is given here. Surrounding the beam pipe, a high resolution vertex detector (VDET) consists of two layers of double-sided silicon microstrip detectors, positioned at average radii of 6.5 cm and 11.3 cm, and covering respectively 85% and 69% of the solid angle. The spatial resolution for the and projections (transverse to and along the beam axis, respectively) is 12 m at normal incidence. The vertex detector is surrounded by a drift chamber with eight coaxial wire layers with an outer radius of 26 cm and by a time projection chamber (TPC) that measures up to 21 three-dimensional points per track at radii between 30 cm and 180 cm. These detectors are immersed in an axial magnetic field of 1.5 T provided by a superconducting solenoidal coil and together measure the transverse momenta of charged particles with a resolution ( in GeV/ ). The resolution of the three-dimensional impact parameter for tracks having information from all tracking detectors and two VDET hits (a VDET “hit” being defined as a space point reconstructed from the and coordinates) can be parametrized as ( in GeV/ ). The TPC also provides up to 338 measurements of the specific ionization of a charged particle. The TPC is surrounded by a lead/proportional-chamber electromagnetic calorimeter segmented into projective towers and read out in three sections in depth, with energy resolution ( in GeV ). The iron return yoke of the magnet is instrumented with streamer tubes to form a hadron calorimeter, with a thickness of over 7 interaction lengths, and is surrounded by two layers of muon chambers. An algorithm combines all these measurements to provide a determination of the energy flow [10] with an uncertainty on the measurable total energy of GeV .
2.1 Event and track selection
This analysis uses 4.1 million hadronic events recorded by the ALEPH detector at centre-of-mass energies close to the Z mass. The events are selected with the charged particle requirements described in [11]. The helix fit of the charged particle tracks used for the D reconstruction must have a per degree of freedom smaller than 5, and their polar angle must satisfy 0.95. Finally the distance to the primary vertex in the plane transverse to the beam axis has to be less than 2 cm and in the beam direction less than 10 cm.
2.2 Particle identification
Charged kaons are identified by means of the specific ionization loss dE/dx in the TPC. The TPC provides two different measurements of the deposited energy, from the wire and the pad readout. The wire readout is only used if at least 50 individual wire samples are available. In this case the pad readout is ignored. If the wire information is insufficient the pad readout is exploited. In both cases the particle identification is based on the dE/dx estimator (), defined as the difference between the expected and the measured ionization loss expressed in terms of standard deviations for the pion (kaon) mass hypothesis. A track is accepted as a kaon if its momentum is greater than 1.5 GeV/ , is less than 2.5 and it satisfies .
Neutral kaons are reconstructed in the deay mode K as described in [12]. For the identification of the K their long lifetime (cm) is exploited by only accepting neutral vertices with a distance of at least 1.5 cm to the primary vertex and a of the vertex fit. The reconstructed mass of the K candidate has to be within 12 MeV/ of the nominal K mass.
Charged pions are selected by requiring to be smaller than 2.5. Neutral pions are reconstructed by a mass-constrained fit to the detected photons in the electromagnetic calorimeter [10]. The momentum of the candidate has to be greater than 1.5 GeV/ and the of the mass fit less than 8.
2.3 Selection of c- and b-quark-enriched event samples
To determine the production rates of D in Z c and Z b events separately, c- and b-quark-enriched event samples have been selected. Due to the good spatial resolution of the vertex detector, the probability () that all charged tracks originate from the primary vertex, determined with the algorithm described in [13], can be used to separate long-lived b hadrons (low probability ) from c and uds events.
An additional separation between c and b events is obtained by a cut on the scaled energy (normalized to the beam energy) of the D candidate, because less energy is available for c quarks originating from a b-hadron decay than in direct Z c decays.
A D0 is reconstructed in all the decay modes considered. In order to further separate light (uds) from heavy (c and b) quark events, a cut on the proper decay time of the D0 candidate is performed. The proper decay time is determined from the decay length , calculated as the distance of the D0 decay vertex from the primary vertex, projected along the momentum vector of the D0, and taking .
The cuts used to select the enriched samples are listed in Table 2. About 4% of all events are rejected because they pass the cuts for the c- as well as the b-quark selection.
| c-quark-enriched sample | b-quark-enriched sample |
|---|---|
| 0.1 ps 1.5 ps | 0.4 ps |
| 4 | 1.5 |
3 Reconstruction of D and D
3.1 Decay channel D D∗+K0
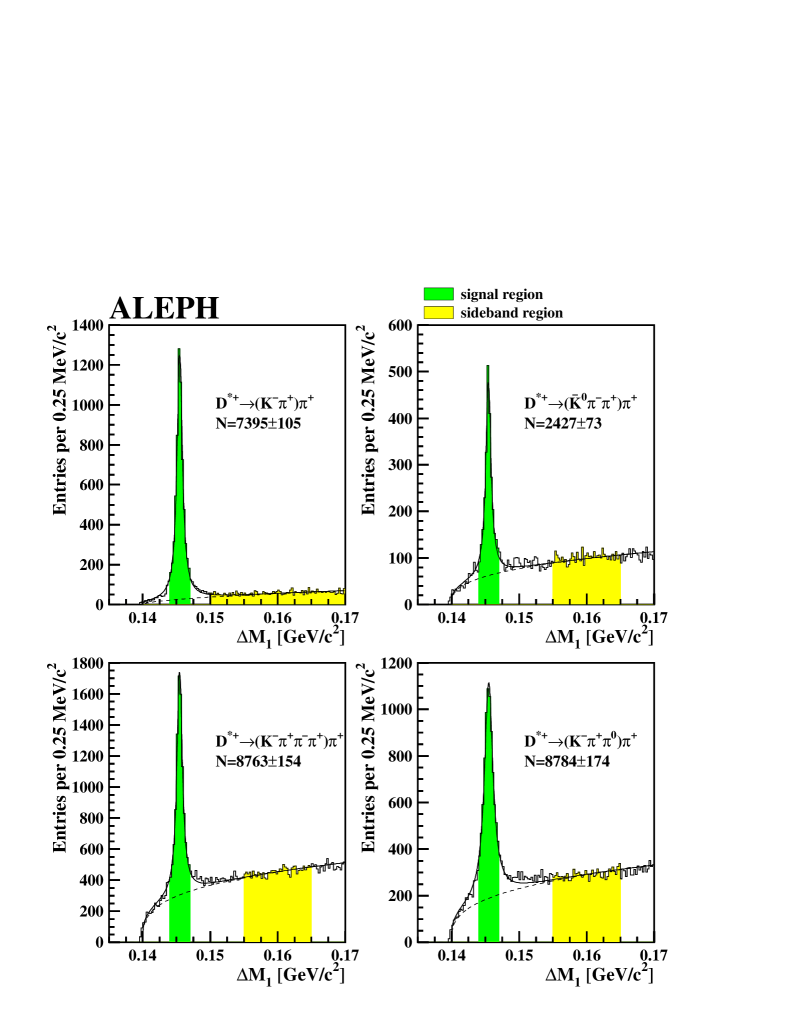
The D∗+ mesons are reconstructed in the decay channel D∗+ D0 and D0 mesons in the four decay channels D0 K-, D0 , D0 K- and D0 K-. Because the combinatorial background is suppressed by the good resolution on the mass-difference between the D∗+ and D0 meson, the cuts for the selection of D0 mesons are rather loose.
To avoid double counting in the D0 decay channels with charged kaons and pions, the track with the smallest value of is assumed to be the kaon track. A fit to a common decay vertex is performed for the tracks of the selected charged particles and the has to be less than 20. The momentum of the D0 candidate has to be greater than 7 GeV/ . Additional cuts are listed in Table 3.
| Decay channel | ||||
|---|---|---|---|---|
| variable | D0 K- | D0 | D0 K- | D0 K- |
| 20 MeV/ | 20 MeV/ | 15 MeV/ | 25 MeV/ | |
| 1.5 GeV/ | 3.0 GeV/ | 2.0 GeV/ | 2.0 GeV/ | |
| 0.7 GeV/ | 1.0 GeV/ | 0.4 GeV/ | 2.0 GeV/ | |
| (2nd) | — | 1.0 GeV/ | 1.5 GeV/ | — |
| (3rd) | — | — | 2.0 GeV/ | — |
The selected D0 candidates are combined with all charged pions
with a momentum less than 3 GeV/ .
For the D∗+ candidates with a momentum greater than 8 GeV/ ,
the mass difference (D0,) (D0) is calculated.
The distributions for the four D0 decay channels
are shown in Fig. 1.
The number of reconstructed D∗+ mesons is determined by a fit to the measured
distributions. The signal is parametrized as a
Breit-Wigner and
the background shape with the following function:
Each D∗+ candidate inside the signal region (1.5 MeV/ ) is combined with all K candidates with a momentum greater than 2.5 GeV/ . The combination of the D∗+ and the K is required to have a scaled energy greater than 0.25. The mass difference (D∗+,K0)(D∗+)(K0)(K0) is calculated, where (K0) is the nominal K0 mass, because this quantity has the best resolution. The resulting mass difference distribution is shown in Fig. 2a.

The distribution shows an excess of events in the signal region around 525 MeV/ . The combinatorial background (Fig. 2b) is determined with the help of D∗+ candidates from sidebands above the D∗+ mass window (Fig. 1). The number of signal events and the mass difference are determined by a simultaneous unbinned log-likelihood fit to the signal and background distributions, with the decay width of the D fixed to 1.5 MeV. The signal is fitted with a Breit-Wigner function, convoluted with the detector resolution. The detector resolutions for the reconstruction of D mesons in the different D0 decay channels are determined from simulated events. The resolution is approximately 1.7 MeV/ for the D0 decay channels D0 K-, D0 and D0 K-and 2.6 MeV/ for the channel D0 K-.
3.2 Decay channels D D∗0K+ and D D0K+
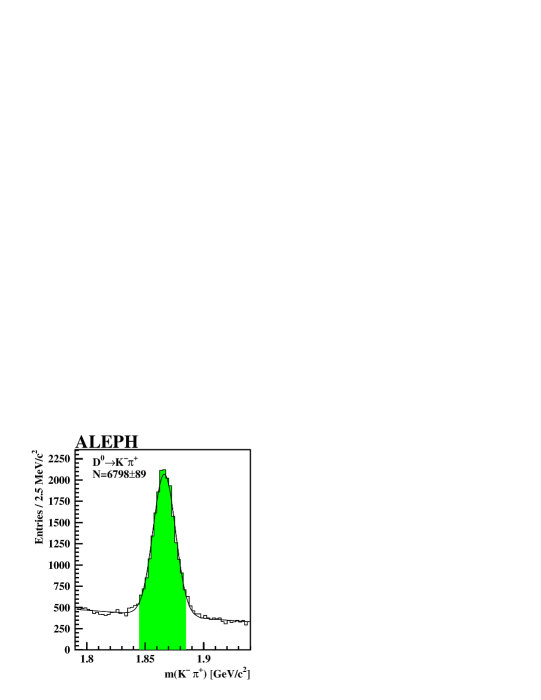
The D∗0 mesons decay into a D0 by emitting a or a photon. Because of the higher background in these channels the selection of D0 candidates has to be more restrictive than for D0 candidates used in the reconstruction of D∗+ mesons. An acceptable signal-to-background ratio is only achieved in the decay channel D0 K- and therefore only this channel was used for the analysis. The D0 candidates are rejected if the invariant mass of the D0 and any in the event is within 2 MeV/ of the D∗+ mass window. The cuts on the momentum of the D0 candidate and on that of the decay particles are tightened to 8 GeV/ and 3 GeV/ , respectively. The D0 candidate is also required to have a proper decay time greater than 0.2 ps. The latter cut removes combinatorial background, peaked at small proper time. The invariant mass distribution of the selected D0 candidates is shown in Fig. 3. The or photon from the D∗0 decay is not reconstructed in this analysis.
Decay channel No. of events [MeV/ ] D D∗+K0 DD∗0K+ DD0K+
Instead the combination of the D0 with all charged kaons in the event with momentum greater than 3 GeV/ is taken and the mass difference (D0,K+)(D0) is calculated. Because of the small Q-value in the decay D∗0 D0 of only 7 MeV, this procedure does not significantly change the resolution, which is determined from the simulation to be MeV/ . In the case where the D∗0 emits a photon the resolution is MeV/ .
The D meson is allowed to decay directly into the D0 K+ final state and therefore the mass difference is also used to measure the decay D D0K+. The detector resolution in the reconstruction of this decay is )MeV/ . The decay D D∗0K+ is also allowed but suppressed due to the smaller phase space.
The measured mass-difference distribution for D0 K+ combinations with a scaled energy greater than 0.25 is shown in Figs. 2c-f. Signals for the D D∗0K+ (Fig. 2c) and D D0K+ decays (Fig. 2e) are visible, as expected, around 525 MeV/ and 710 MeV/, respectively. The shape of the combinatorial background is determined with the help of the wrong-sign charge combinations D0 K-(Figs. 2d and f). The shape of the combinatorial background for the decay of the D is parameterized with the function given in Section 3.1. The combinatorial background for the decay of the D is described by a linear function of . The numbers of signal events are determined with a simultaneous unbinned log-likelihood fit to the signal and background distributions. The signal is fitted with a Breit-Wigner function convoluted with the Gaussian detector resolution. In addition, reflections from the decays D D∗0 and D D0 are taken into account in the fit to the D D∗0K+ and D D0K+ distributions. This contribution is small due to the broad distribution of the reflection events and is determined from simulated events to be 4% (6%) of the D D∗0K+ (D D0K+) signal events. The results of the fit to the distributions are listed in Table 4. The systematic uncertainties on the measured mass differences are obtained by varying, in the fit, the assumed decay width and the detector resolution, as described in Section 5.1.
From the measured mass differences, the mass of the D and D can be calculated by adding the appropriate nominal mass (D∗+, D∗0 or D0) and calculating the weighted average in the case of the D. The resulting masses are m(D)= MeV/ and m(D)= MeV/ . The measured masses are in good agreement with the world averages given in Table 1.
3.3 Measurement of D decays in the c- and b-quark-enriched sample


The measured mass-difference distributions for the c- and b-quark-enriched samples are shown in Figs. 4 and 5. The Ds1 and D mesons are reconstructed as described in the previous sections. The numbers of signal events are determined with an unbinned log-likelihood fit to the data as described in the previous section, with the exception that the mass differences are fixed using the Ds1 and D masses given in Table 1. The results are given in Table 5.
Decay channel c-quark-enriched sample b-quark-enriched sample D D∗+K0 D D∗0K+ D D0K+
4 Reconstruction efficiencies
| Decay channel | Mean efficiency |
|---|---|
| D D∗+K0 (D0 K-) | |
| D D∗+K0 (D0 ) | |
| D D∗+K0 (D0 K-) | |
| D D∗+K0 (D0 K-) | |
| D D∗0K+ | |
| D D0K+ |
| Decay channel | c-quark-enriched | b-quark-enriched | ||
|---|---|---|---|---|
| c D | b D | c D | b D | |
| D D∗+K0 | ||||
| D D∗0K+ | ||||
| D D0K+ | ||||
To determine the production rates in hadronic events, the reconstruction efficiencies are taken from the simulation. The efficiencies are calculated separately for D mesons produced in charm fragmentation, b-hadron decays and from gluon splitting.
In the flavour-independent selection the reconstruction efficiencies for D mesons produced in charm fragmentation and in b-hadron decays are approximately the same. The efficiency for D mesons from gluon splitting is lower due to their softer energy spectrum. The mean efficiencies are calculated from the flavour-specific efficiencies under the assumption that D mesons are produced in equal amounts in charm fragmentation and in b-hadron decays. The fraction of D mesons produced in gluon splitting is taken from the simulation, with the rate of gluons splitting into c pairs reweighted to the measured value of (g c )=0.0296 0.0038 [15], and found to be about 6 %. The average efficiency is calculated as . The calculated mean efficiencies are given in Table 6.
The reconstruction efficiencies in the c- and the b-quark-enriched event samples for the different D decays are listed in Table 7.
5 Production rates
The production rates are calculated from the observed number of events, the total number of hadronic Z decays (=4 151 890), the known branching ratios and the reconstruction efficiencies
| (1) | |||||
| (2) | |||||
| (3) |
where , and denote the number of reconstructed events in the three considered D channels and , and the corresponding branching-ratio-weighted sums of the reconstruction efficiencies. The branching ratios of the D∗+, K, D0, and those of all subsequent decays, are taken from [7].
In the case of the c- and b-quark-enriched samples, the rate is calculated per event hemisphere and not per Z-decay. In this case the number of hadronic events are multiplied by the partial width Rc and Rb, for which the Standard Model values R and R are used. The average number of D expected from gluon splitting (%) is subtracted from the number of events observed. Since the enriched samples are not pure, but have a contamination of roughly 10% from other quark flavours, the production rates are determined simultaneously for the c- and b-quark-enriched samples.
5.1 Systematic errors
| Systematic errors in the decay D D∗+K0 | |||
|---|---|---|---|
| Error source | flavour independent | c-enriched | b-enriched |
| Mass, decay width and resolution | |||
| , variation | |||
| Kaon dE/dx selection | |||
| D source (gluon, c and b) | |||
| Monte Carlo statistics | |||
| D0 branching ratios | |||
| Total | |||
| Systematic errors in the decay D D∗0K+ | |||
| Error source | flavour independent | c-enriched | b-enriched |
| Mass, decay width and resolution | |||
| , variation | |||
| Kaon dE/dx selection | |||
| D∗∗ reflections | |||
| D source (gluon, c and b) | |||
| Monte Calo statistics | |||
| D0 branching ratio | |||
| Total | |||
| Systematic errors in the decay D D0K+ | |||
| Error source | flavour independent | c-enriched | b-enriched |
| Mass, decay width and resolution | |||
| , variation | |||
| Kaon dE/dx selection | |||
| D∗∗ reflections | |||
| D source (gluon, c and b) | |||
| Monte Carlo statistics | |||
| D0 branching ratio | |||
| Total | |||
The main contribution to the systematic error originates from the uncertainty on the parameters held fixed in the fit to the mass distributions of the D and D candidates. In all fits the natural decay widths ((D) = 1.5 MeV and (D) = 15 MeV) and the detector resolution are fixed. In order to determine the systematic error, the decay width of the D (D) is varied between 1 and 2 MeV(10 and 20 MeV). An uncertainty of 10% is assumed for the detector resolution determined from the simulation. In the case of the c- and b-quark-enriched samples, the central values of the D and D masses are fixed to the world averages [7] and are varied by 0.6 MeV/ for the D and by 2 MeV/ for the D. Each parameter is varied independently and the change in the number of signal events is taken as the systematic error from that particular source. The total systematic error listed in Tables 4 and 5 is given by the quadratic sum of all the above contributions.
The rate of gluons splitting to c pairs is varied within the experimental uncertainties. In addition, the selection efficiency for D mesons originating from this source is varied by 50% to account for the modeling of the g c process. An error of 20% is assumed on the equality of the D production in c and b events, which is used in the calculation of the average efficiency (see Section 4). The resulting error on the production rate is 1%.
The fraction of reflection events from D∗∗ decays is taken from the simulation. The obtained ratio between reflection and signal events is varied by 50% and the corresponding change in the number of signal events taken as the systematic error.
In the simulation the parameters of the Peterson fragmentation function are reweighted to reproduce the measured values of the mean scaled energy of c and b hadrons: and [14], respectively. The reweighted samples are used to determine the reconstruction efficiencies and the errors on the fragmentation parameters are propagated as well.
The dE/dx selection efficiency determined from the simulation is tested by reconstructing D∗+ (K-) decays without using the dE/dx information of the K-. By applying subsequently the dE/dx cut used in the analysis, the efficiency of this cut can be determined in data and the simulation. The difference between data and the simulation is ()%. The reconstruction efficiencies of the appropriate decay channels are corrected for the observed offset and the uncertainty is taken into account as a systematic error.
Finally the errors of the reconstruction efficiency due to the finite Monte Carlo statistics and the uncertainty on the used branching ratios are taken into account.
The total systematic error is calculated by adding the different contributions in quadrature. The list of the systematic errors is given in Table 8. The systematic errors of the two Ds1-modes have been assumed to be 100% correlated.
5.2 Results
From the measured numbers of produced D and D mesons
and the reconstruction efficiencies, the production rates in the decay
channels D D∗+K0, D D∗0K+ and D D0K+
in hadronic events are
f (Z D) Br(D D∗+K0)
f (Z D) Br(D D∗0K+)
f (Z D) Br(D D0K+) .
The production rates in the c-quark-enriched sample are
f (c D) Br(D D∗+K0)
f (c D) Br(D D∗0K+)
f (c D) Br(D D0K+) .
The production rates in the b-quark-enriched sample are
f (b D) Br(D D∗+K0)
f (b D) Br(D D∗0K+)
f (b D) Br(D D0K+) .
The production rate of D mesons in b-decays has a significance of less than
one sigma, therefore
a confidence limit is calculated by renormalizing the probability
for the allowed region of the production rate
and taking into account the measured central value:
f (b D) Br(D D0K+) at % CL .
Assuming that the decay width of the D is saturated by the two
measured decays and
that the branching ratio Br(D D0K+) is , which follows from the
assumption that Br(D D K)=90% with 10%
branching ratio into D∗ K [8],
the total production rates in hadronic events are found to be
f (Z D)
f (Z D) .
The production rates from c-quarks (c D) are
f (c D)
f(c D) .
The production rates from b-quarks (b D) are
f (b D)
f (b D) .
The production rate of D mesons in b-decays has a significance of less than
one sigma and the corresponding upper limit is
f (b D) at % CL .
6 Conclusions
The production rates of the D mesons D and D have been measured by reconstructing the decays D D∗+K0, D D∗0K+ and D D0K+.
In the two measured D decay modes an
enhancement of the D∗0K+ final state is expected due to
the higher Q-value of the decay, since isospin invariance requires
the matrix elements of the two decays to be the same.
The expected ratio of the two branching ratios is given by [8]
where q(K+) (q(K0)) is the momentum of the K+(K0) in the rest frame of the D and =2 for a pure D-wave decay.
The measured ratio of the two production rates is
The smaller value compared with the expectation could be due to an admixture of a S-wave decay from one of the broad D states (see Table 1). However, no significant discrepancy with the expected production rate ratio for a pure D-wave decay is observed.
Acknowledgements
It is a pleasure to thank our colleagues in the accelerator divisions of CERN for the excellent performance of LEP. Thanks are also due to the technical personnel of the collaborating institutions for their support in constructing and maintaining the ALEPH experiment. Those of us not from member states wish to thank CERN for its hospitality.
References
- [1] N. Isgur and M. B. Wise, Spectroscopy with Heavy Quark Symmetry, Phys. Rev. Lett. 66 (1991) 1130.
- [2] J. L. Rosner, P-Wave Mesons with one Heavy Quark, Comments Nucl. Part. Phys. 16 (1986) 109.
- [3] ARGUS Collaboration, Observation of the Decay Ds1(2536)D∗0K+, Phys. Lett. B 297 (1992) 425.
- [4] CLEO Collaboration, Production and Decay of the D(2536), Phys. Lett. B 303 (1993) 377.
- [5] CLEO Collaboration, Observation of a New Charmed Strange Meson, Phys. Rev. Lett. 72 (1994) 1972.
- [6] OPAL Collaboration, Production of P-Wave Charm and Charm-Strange Mesons in Hadronic Z0 Decays, Z. Phys C 76 (1997) 425.
- [7] Particle Data Group, Review of Particle Physics, Eur. Phys. J. C 15 (2000).
- [8] S. Godfrey and R. Kokoski, The Properties of P-Wave Mesons with one Heavy Quark, Phys. Rev. D 43 (1991) 1679.
-
[9]
ALEPH Collaboration,
ALEPH: A Detector for Electron-Positron Annihilations at LEP,
Nucl. Instrum. Methods A 294 (1990) 121;
B. Mours et al., The Design, Construction and Performance of the ALEPH Silicon Vertex Detector, Nucl. Instrum. Methods A 379 (1996) 101. - [10] ALEPH Collaboration, Performance of the ALEPH Detector at LEP, Nucl. Instrum. Methods A 360 (1995) 481.
- [11] ALEPH Collaboration, Improved Measurements of Electroweak Parameters from Z Decays into Fermion Pairs, Z. Phys. C 53 (1992) 1.
- [12] ALEPH Collaboration, Production of K0 and in hadronic Z decays, Z. Phys. C 64 (1994) 361.
- [13] ALEPH Collaboration, A precise measurement of /hadrons) , Phys. Lett. B 313 (1993) 535.
- [14] ALEPH, CDF, DELPHI, L3, OPAL, SLD, Combined results on -hadron production rates, lifetimes, oscillations and semileptonic decays, CERN-EP-2000-096.
- [15] ALEPH, CDF, DELPHI, L3, OPAL, SLD, Precision electroweak measurements on the Z resonance, Physics Report in preparation.