SLAC-PUB-9064
BABAR-PROC-01/91
November, 2001
Results on mixing in the system from BABAR
Monika Grothe
University of California, Santa Cruz, Santa Cruz CA 95064, USA
monika@scipp.ucsc.edu
(for the B AB AR Collaboration)
With 12.3 collected by the BABAR experiment in 2001, the mixing parameter is determined from the ratio of the lifetimes measured in the and in the decay modes. The preliminary result % is obtained. Also presented is the status of measuring the mixing parameters and from a simultaneous fit to the time evolution of the decay time distributions of Cabibbo-favored right-sign () and doubly Cabibbo-suppressed wrong-sign () decays. The wrong-sign decay rate, (# WS decays ) / ( # RS decays ) % is obtained from the fit to 23 of BABAR data taken in 2000.
Contributed to the Proceedings of the
9th International Symposium On Heavy Flavor Physics
09/10/2001—09/13/2001, Pasadena, California, USA
Stanford Linear Accelerator Center, Stanford University, Stanford, CA 94309
Work supported in part by Department of Energy contract DE-AC03-76SF00515.
1 Introduction
If conservation holds in the system, the -even and -odd eigenstates are mass eigenstates with masses , and widths , . The mixing parameters and measure the difference of these masses and lifetimes, respectively. Since in the Standard Model - mixing is doubly Cabibbo-suppressed and vanishes in the flavor limit both parameters are expected to be small ( [1]. If - mixing were found to be large, this might be a sign either for large flavor breaking () or for new physics () [2].
The mixing parameter can be determined from the lifetime of mesons111In the following, the charge conjugates of the meson and its decay modes are always implied as well. that decay into final states of specific symmetry [3]. A final state that is an equal mixture of -even and -odd is produced by the Cabibbo-favored decay . If is small, the lifetime distribution of mesons decaying into this final state can be approximated as an exponential with lifetime where . A -even final state is produced by the singly Cabibbo-suppressed decay . The decay time distribution of mesons that decay into is exponential with a lifetime . This lifetime can be compared to to obtain :
| (1) |
The mixing parameters and can be determined simultaneously from the time evolution of the wrong-sign (WS) decay . The WS decay rate has contributions from the doubly Cabibbo-suppressed decay, described by a pure exponential, and from - mixing, described by the same exponential modified by a coefficient quadratic in the decay time . A third term arises from the interference of the two, where the exponential has a coefficient linear in . The time evolution of the WS decay rate is thus described by [4]:
| (2) |
Here, is given in units of the lifetime of the . The parameters and are related to the mixing parameters , by a rotation:
| (3) |
The phase of the rotation is the strong phase between the doubly Cabibbo-suppressed contribution and the one from mixing.
In the following, two results are presented. Firstly, a preliminary measurement is described of from the difference of the lifetime determined in the and decay channels. Secondly, a preliminary measurement of the WS decay rate of the is discussed, extracted from a full fit to the time evolution of the combined right-sign and wrong-sign decay rates.
The measurements are based on data collected with the BABAR detector at the PEP-II asymmetric collider. Data taken on and off the resonance are used. Their center-of-mass is boosted along the beam axis with a nominal Lorentz boost of . The size of the interaction point (IP) transverse to the beam direction is typically 6 m in the vertical direction and 120 m in the horizontal direction.
Candidates for particles are identified through the decay . Charged particles are detected and their momenta are measured by a combination of a 40-layer drift chamber (DCH) and a five-layer, double-sided, silicon vertex tracker (SVT), both operating in a 1.5 T solenoidal magnetic field. A ring-imaging Cherenkov detector (DIRC) is used for charged particle identification. A detailed description of the BABAR detector is available in [5].
2 Measurement of
The result is obtained from a sample of 12.4 of 2001 BABAR data that were reconstructed with the most advanced tracking alignment parameters and reconstruction algorithms.
2.1 Event Selection
The widths and are determined by fitting the decay time distributions of independent samples of and decays. The candidates for each sample are identified by means of the charged particles in their final state. The decay and particle identification are used to suppress backgrounds.
candidates are selected by searching for pairs of tracks of opposite charge and combined invariant mass near the mass . Each track is required to contain a minimum number of SVT and DCH hits in order to ensure reconstruction quality. The two daughter tracks of the candidate are fitted to a common vertex. The probability of this vertex fit has to be better than 1%.
Each candidate among the daughter tracks is required to pass a likelihood-based particle identification algorithm. This algorithm is based on the measurement of the Cherenkov angle by the DIRC for momenta and on the energy loss () measured by SVT and DCH for momenta . An average efficiency for identification of approximately 80% is reached for tracks within the DIRC acceptance while the misidentification probability amounts to about 2%.
The decay can be distinguished by a of low momentum, commonly referred to as the slow pion (). To increase acceptance, candidate tracks do not have to contain DCH hits. To improve momentum resolution, a vertex fit is used to constrain each candidate track to pass through the intersection of the trajectory and the IP. If the probability of this vertex fit is less than 1%, the candidate is discarded.
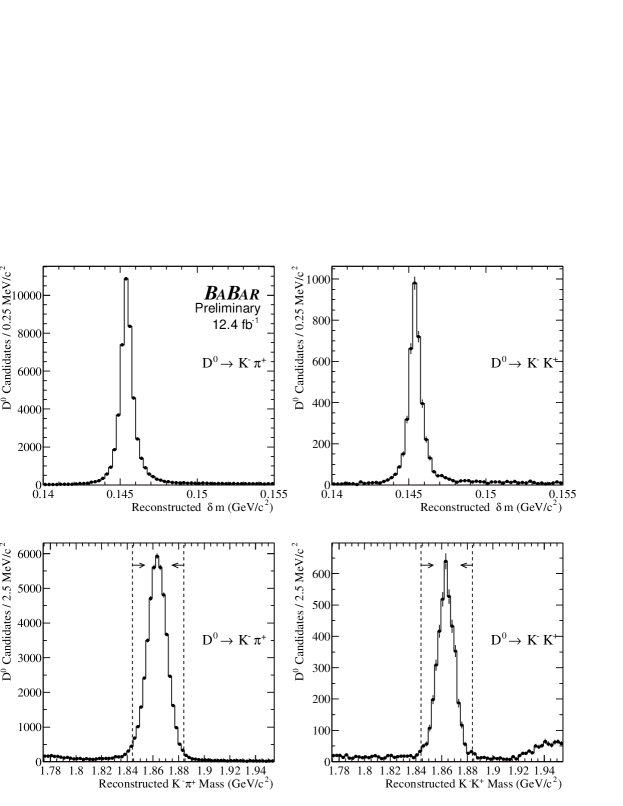
The candidates peak at a value of , where is the difference in the reconstructed and masses. Backgrounds are reduced by rejecting events with a value of that deviates more than a given margin from the peak. The size of this margin corresponds to approximately three standard deviations and varies between 1 and 2.5, depending on the quality of the track.
To remove background from meson decays, each candidate has to have a momentum greater than 2.6 in the center-of-mass. This condition is also effective at removing combinatorial background that tends to accumulate at lower momenta.
After all selection requirements, about 45,000 candidates in the decay channel and about 4,000 in the decay channel are retained. The mass and distribution of the selected events are shown in Fig. 1. The relative size of the remaining background is about 2% and 5% for the and samples, respectively, when measured inside a mass window.
2.2 Lifetime Determination
The flight length and its measurement error are determined for each candidate by a global, three-dimensional, multiple-vertex fit that includes the daughter tracks, the track, and the IP envelope. This fit does not include explicit constraints on the or masses. The value listed by the Particle Data Group (PDG) for the mass ( [6]) and the momentum of the obtained with the vertex fit are used to calculate the boost of the and obtain the proper decay time.
The lifetimes of the candidate samples are extracted by means of an unbinned maximum likelihood fit. The likelihood function is divided into two distinct decay time distribution functions, one for the signal and one for the background. The signal function is the convolution of an exponential and a resolution function. The resolution function consists of the sum of two Gaussian distributions with zero mean and with widths that are proportional to the measurement error (typically 180 fs) of the decay time of each candidate. The parameters in the fit associated with the signal are the lifetime, the proportionality factors for the widths of the two Gaussians, and the fraction of signal that is assigned to the second Gaussian.
Like the signal likelihood function, the background function consists of the convolution of a resolution function and a lifetime distribution. The background lifetime distribution is determined as the sum of an exponential distribution and a delta function at zero, the latter corresponding to those sources of background that originate at the IP. The resolution function consists of the sum of three Gaussian distributions. The first two are chosen to match the resolution function of the signal. The third is given a width independent of the decay time error and accounts for outliers produced by long-lived particles or reconstruction errors. The additional fit parameters associated with the background include the fraction assigned to zero lifetime sources, the background lifetime, the width of the third Gaussian, and the fraction of background assigned to the third Gaussian.
The reconstructed mass of each candidate provides the likelihood of this candidate to be part of the signal. This likelihood is based on a separate fit of the reconstructed mass distribution. This fit includes a resolution function composed of a Gaussian with an asymmetric tail and a linear portion to describe the background. The slope of the background part is constrained with candidates in the sideband ().
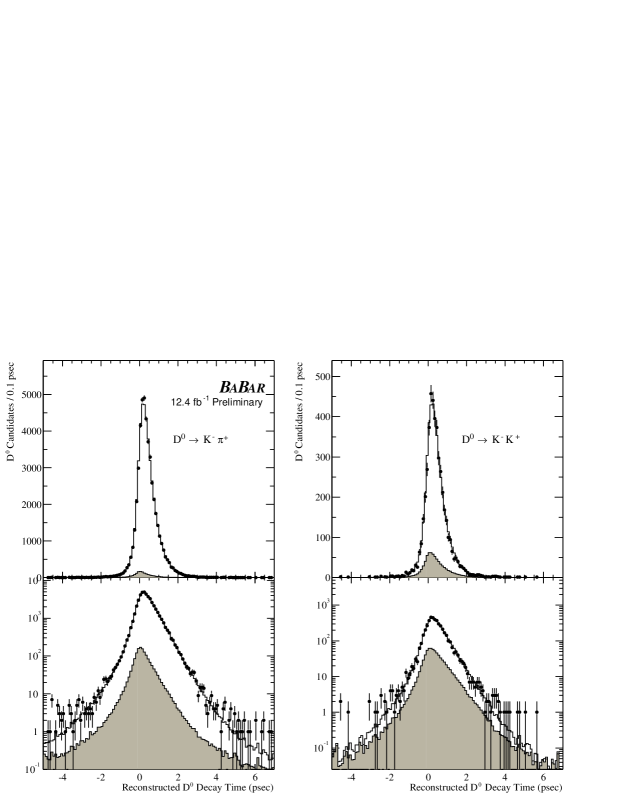
The results of the lifetime fits are shown in Fig. 2. Typical values for the fitted parameters are a background lifetime similar to the lifetime and a width of the third Gaussian that is several times larger than the typical decay time error. The proportionality factors associated with the two Gaussians in the resolution function correspond to a root-mean-square of approximately .
To ensure that the analysis was performed in an objective manner, the lifetime and values were blinded throughout the analysis process. This blinding was performed by adding to each of the and fit results an offset chosen from a random Gaussian distribution of width 10 fs. The values of the two offsets and the positive () sides of the lifetime distribution of the data and of the fit result (Fig. 2) were concealed. The value of was unblinded only after the analysis method and systematic uncertainties were finalized and the result was committed for public release.
2.3 Systematic Errors and Result
Many systematic uncertainties cancel because is measured from the ratio of lifetimes. The uncertainties that do not cancel are associated mostly with backgrounds. These are tested by varying each event selection requirement within its uncertainty and recording the subsequent change in the measured value of . The quadrature difference is used as an estimate of the statistical error in , where () is the statistical error in before (after) the th systematic check. Only systematic checks with are included in the sum . The square root of this sum (1.7%) provides an estimate of the systematic uncertainty originating from the event selection and backgrounds.
Biases in tracking reconstruction are investigated by studying Monte Carlo samples, which, within statistics, show no reconstruction bias. In addition, a variety of vertexing techniques, including constraining the mass and using separate and vertex fits are employed as systematic checks. A systematic uncertainty of 0.4% is assigned from this source.
Detector misalignment is another potential source of systematic uncertainty. Residual internal misalignment of the SVT, even as small as a few microns, can produce significant variations in the apparent lifetime.
This source is studied with the help of events in which the four charged tracks are known to originate from the IP. By selecting oppositely charged pairs of these tracks with opening angles similar to two-prong decays, it is possible to measure the apparent IP position as a function of trajectory and to calculate a correction to the lifetime obtained by the fit. For the data samples used in this analysis, a correction of fs is found, with negligible statistical error and a systematic uncertainty of fs. This type of correction nearly cancels in the lifetime ratio and introduces little systematic uncertainty in .
| Category | Uncertainty (%) |
|---|---|
| Event Selection and Background | |
| Reconstruction and Vertexing | |
| Alignment | |
| Quadrature Sum |
The systematic uncertainties in are summarized in Table 1. Adding the contributions of all systematic checks in quadrature, the preliminary result for is obtained:
| (4) |
where the first error is statistical and the second systematic. This result is consistent with the Standard Model expectation of zero and with results from E791 [7], FOCUS [8], Belle [9] and CLEO [10].
An important test of the soundness of the analysis is a lifetime that agrees with the PDG value of fs [6]. A corrected value of fs is found. The systematic uncertainty is approximately 6 fs and is dominated by detector alignment effects.
3 Measurement of the wrong-sign decay rate
Wrong-sign (WS) decays of the type are selected by requiring that the slow pion and the kaon have the same charge. The measurement is based on 23 of BaBar data taken in 2000. Vertex reconstruction, event selection and systematic error analysis are similar to the ones employed in the measurement of , described above. After all event selection requirements a sample of about 200 WS candidate events is retained.
A simultaneous unbinned maximum likelihood fit to the decay time distribution of right-sign (RS) and wrong-sign decay candidates is performed. The fit function consists of a lifetime distribution function convoluted with a resolution function. For RS events, a pure exponential is assumed as functional form of their lifetime distribution while for WS events the functional form follows Eq. 2. The simultaneous fit of RS and WS candidates exploits the high statistics of the RS sample to obtain an accurate description of the resolution function and of the type and size of the background contributions.
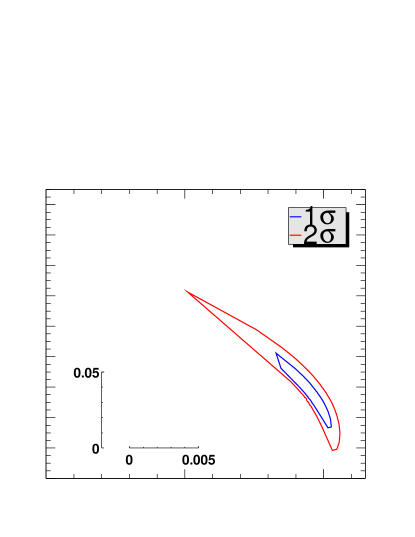
The 1 and 2 contours of the statistical error of the fit result in the --plane (Fig. 3) exhibit a strong correlation between the two parameters that extends into the unphysical region . Note that a length scale is given for the axes but no axis labels and thus no central values for , . The analysis of systematic errors shows that the dominating systematic error source in the 2000 BABAR data is the internal alignment of the SVT. It will soon be possible to extract the central values of and from more data reconstructed with the most advanced tracking alignment constants.
The fit function contains as one parameter the WS decay rate, defined as:
= (number of wrong-sign decays) / (number of right-sign decays)
The simultaneous fit to the RS and WS candidate events yields the following result for the WS decay rate:
= ( 0.38 0.04 0.02) %,
where the first error is statistical, the second systematic. This result is compatible, within its errors, with the results obtained by E791 [11], ALEPH [12], CLEO [13], FOCUS [14], Belle [9] and is the most precise experimental measurement of currently available.
4 Conclusion
With 12.4 of data taken by the BABAR detector in 2001, the preliminary result for is obtained:
| (5) |
where the first error is statistical and the second systematic. This result is consistent with the Standard Model expectation of zero and is consistent with published values from E791 [7] and FOCUS [8] and preliminary results from Belle [9] and CLEO [10]. A reduction of the statistical error by half is feasible in the near future by considering additional decay channels () and by including the 23 of BABAR data collected in 2000.
The extraction of the mixing parameters and by measuring the time evolution of the wrong-sign () decay rate in a sample of 35 of combined 2000 and 2001 BABAR data will be possible soon.
References
- [1] F. Buccella, M. Lusignoli, and A. Publiese, Phys. Lett. B 379 (1996) 249; F. Buccella et al., Phys. Rev. D 51 (1995) 3478.
- [2] Z. Ligeti, - mixing, these proceedings.
- [3] E. Golowich and S. Pakvasa, Phys. Lett. B 505 (2001) 94.
-
[4]
Y. Nir, CP-violation in and beyond the Standard Model,
Lectures given in the XXVII SLAC Summer Institute on Particle Physics, 1999,
hep-ph9911321. - [5] The BABAR Collaboration, B. Aubert et al., to appear in Nucl. Instrum. Methods, hep–ex/0105044.
- [6] D.E. Groom et al., Eur. Phys. Jour. C 15 (2000) 1.
- [7] The E791 Collaboration, E.M. Aitala et al., Phys. Rev. Lett. 83 (1999) 32.
- [8] The FOCUS Collaboration, J.M. Link et al., Phys. Lett. B 485 (2000) 62.
-
[9]
B.D. Yabsley, Proceedings of the
International Europhysics Conference on High
Energy Physics (EPS HEP 2001), JHEP PRHEP-hep2001/059, BELLE–CONF–0131;
J. Tanaka, - mixing results from BELLE, these proceedings. - [10] The CLEO Collaboration, to appear in the proceedings of the 4th International Conference on B Physics and CP Violation (BCP 4), Japan (2001) hep–ex/0104008.
- [11] The E791 Collaboration, E.M. Aitala et al., Phys. Rev. D57 (1998) 13.
- [12] The ALEPH Collaboration, R. Barate et al., Phys. Lett. B 436 (1998) 211.
- [13] The CLEO Collaboration, R. Godang et al., Phys. Rev. Lett. 84 (2000) 5038.
- [14] The FOCUS Collaboration, S. Bianco et al., Nucl. Phys, Proc. Suppl. 99 (2001) 191.