SLAC-PUB-9026
BABAR-PROC-01/67
October, 2001
Determination of the wrong sign decay rate and the sensitivity to mixing.
Ulrik Egede
Blackett Laboratory, Imperial College,
London SW7 2BW, United Kingdom.
(for the B AB AR Collaboration)
Abstract
The meson can decay to the wrong sign state either through a doubly Cabibbo suppressed decay or via mixing to the state followed by the Cabibbo favoured decay . We measure the rate of wrong sign decays relative to the Cabibbo favoured decay to and give our sensitivity to a mixing signal.
Contributed to the Proceedings of the International Europhysics Conference on HEP,
12—18 July 2001, Budapest, Hungary
Stanford Linear Accelerator Center, Stanford University, Stanford, CA 94309
Work supported in part by Department of Energy contract DE-AC03-76SF00515.
1 Introduction
Particle-antiparticle mixing between neutral mesons arises when the mass eigenstates of the production Hamiltonian are not the same as the weak eigenstates which are responsible for the meson decay.
Due to the presence of the weak interaction the physical states are thus a superposition of the mass eigenstates. This superposition splits the mass of the physical states and introduces the possibility of mixing between the mass eigenstates in the form of oscillations. Mixing is defined in terms of two dimensionless parameters: and where and are the differences between the masses and the decay rates of the strong eigenstates respectively, and . A recent review of the predictions for the level of mixing can be found in [1].
2 Event Selection
The results presented in this work are based on data collected with the BABAR detector [2] at the PEP-II asymmetric storage ring at the Stanford Linear Accelerator Center during the 1999–2000 Run 1. This corresponds to an integrated luminosity of fb-1 recorded on-resonance at the mass and 2.6 fb-1 off-resonance about 40 below this energy.
candidates produced in continuum events are selected through the decay chain followed by the decay . In this way the production flavour is tagged by the charge of the slow pion from the decay. The decay is then classed as a right sign decay if the Kaon has the opposite charge of the slow pion and a wrong sign decay if they have the same charge. The charge conjugated decay is treated in the same way.
The event selection criteria are: the momentum of the in the rest frame above 2.6 ; particle identification of both daughters; good track and vertex quality; helicity cut on the Kaon decay angle with respect to the momentum evaluated in the rest frame, and for the pion from the . Finally if multiple overlapping candidates are left in an event the event is rejected. A common vertex fit is made to the , the and the beam spot taking advantage of the small beam spot size .
3 Analysis method
An unbinned log likelihood fit is performed using the values of , , the proper time and its estimated error for each candidate. In these variables the right sign signal has a very simple shape. It peaks in the mass distributions and follows an exponential convoluted with our resolution model for the time evolution. The wrong sign signal has, under the assumption of no violation, the time evolution modulated by the mixing parameters and :
| (1) |
and convoluted with the same resolution function as the right sign decay. is the time integrated doubly Cabibbo suppressed decay rate. The parameters and are related to the mixing parameters and through a rotation where is the unknown phase difference between the Cabibbo favoured and doubly Cabibbo suppressed decay.
In order to have a reliable measurement of the mixing rate we need a good understanding of the background sources in the plane and of their decay time evolution. The background categories we model are: a real combined with a fake slow pion; an incomplete like reconstructed as ; reflections of ; swapped particle ID hypothesis of the and the in the decay, and purely combinatoric background.
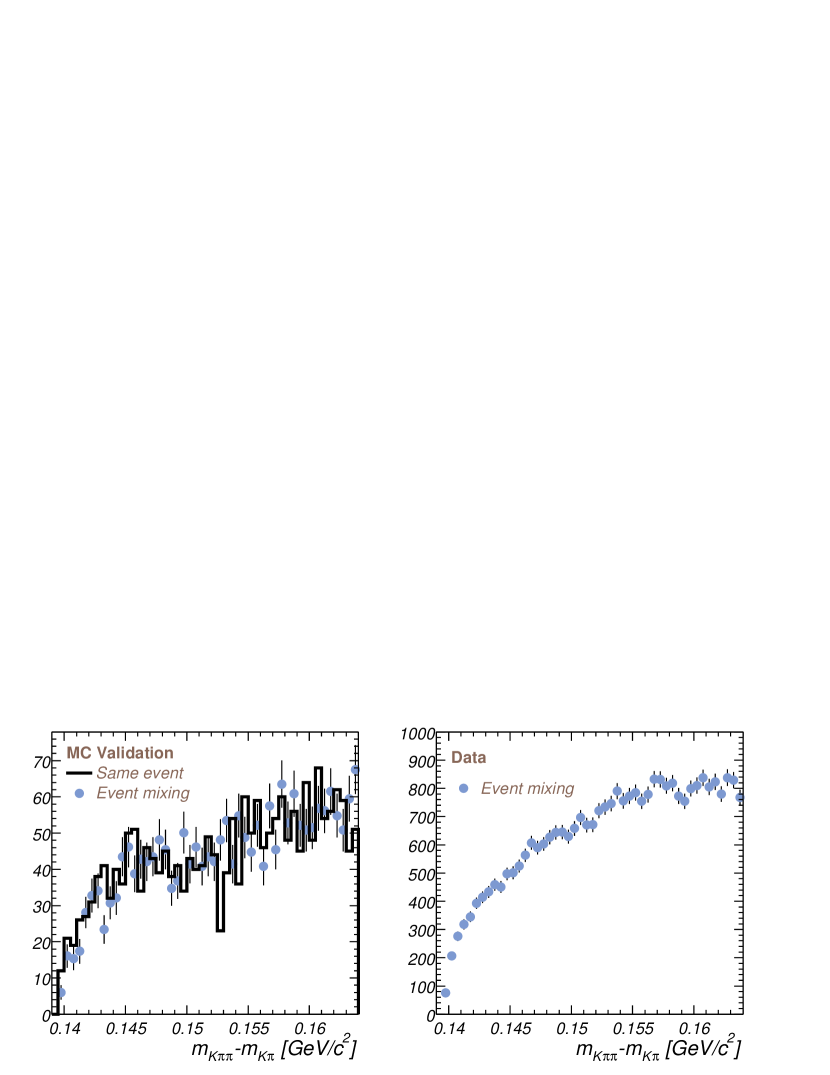
We use event mixing as a method to obtain the distribution for the combinatorial and fake slow pion categories directly from data. The idea is to reconstruct candidates from slow pions in one event with candidates from other events. In this way it is assured that a reconstructed really has a fake slow pion. In Fig. 1 we show a validation of the method on Monte Carlo and the actual distribution we used obtained directly from the data.
4 Results
In table 1 we list the fractional contributions for signal and background sources as obtained from the fit. In Fig. 2 we show the comparison between the fit and the data.
| Source | Right sign (%) | Wrong sign (%) |
|---|---|---|
| signal | ||
| Real fake | ||
| Incomplete and reflections | – | |
| Swapped | – | |
| Combinatoric |
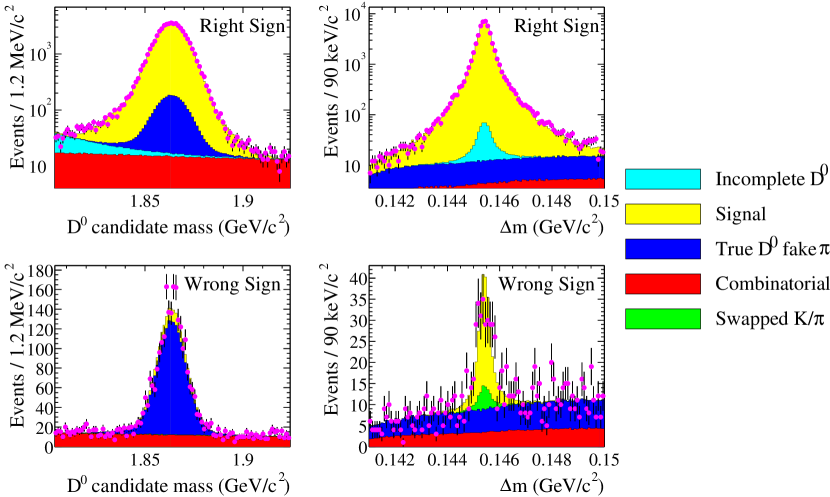
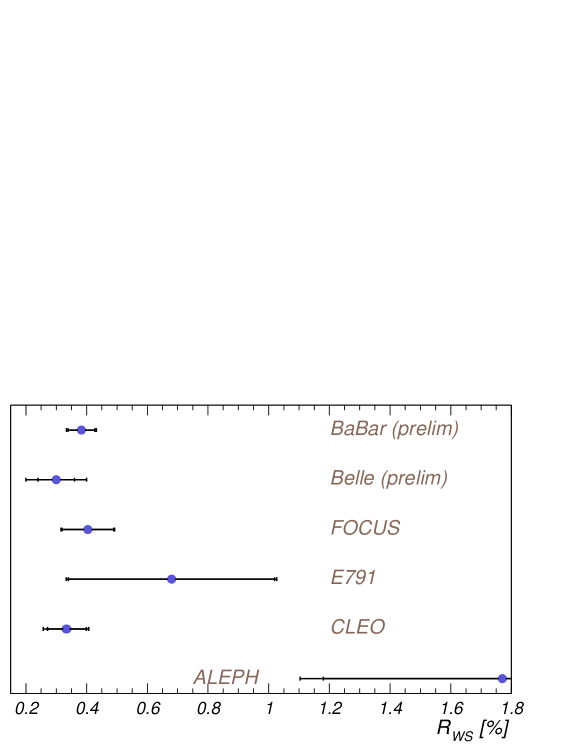
In total the selected right sign sample has 58723 candidates and the wrong sign sample 3315 candidates. If we combine this with the signal fractions in table 1 we get 54120 right sign signal events and 210 wrong sign signal events. The ratio between the wrong sign signal and the Cabibbo allowed decays is then .
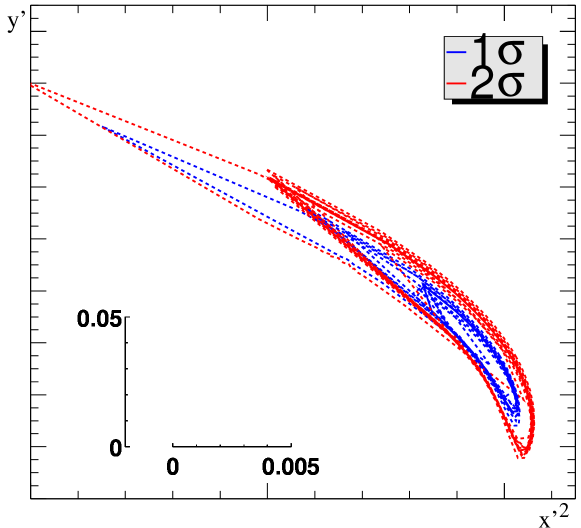
The systematic checks we performed have focused on the log likelihood fit, the selection criteria and detector effects. The mixing parameters are strongly anti-correlated and the likelihood space stretches to a non physical region. For this reason, when considering the systematic checks on the mixing parameters, rather than comparing the minimum values obtained from fits to different configurations, we will compare the one and two sigma likelihood contours. A summary of the systematic errors on are given in table 2 and contours for the different systematic checks are overlaid in Fig. 3. The systematic effect from the internal alignment of the silicon tracker is pending the reprocessing of the data and the central value of the mixing fit is kept blinded until then.
| Type | Variation | Error (%) |
| Kaon identification | Loose—Tight | 0.001 |
| Pion identification | Loose—Tight | 0.010 |
| Kaon cutoff | 0.1–0.5 | 0.009 |
| 0.65–1.0 | 0.006 | |
| mass window | – | 0.010 |
| window | 15–28 | 0.004 |
| SVT track quality | 0.011 | |
| Background shape | 0.003 | |
| Background fractions | 0.005 | |
| cutoff | 1.4–2.8 | 0.004 |
| Prob() vertex fit | 0.002–0.05 | 0.001 |
| Other | 0.002 | |
| Sum in quadrature | 0.022 |
References
- [1] H. N. Nelson, Compilation of mixing predictions, hep-ex/9908021.
- [2] BABAR Collaboration, B. Aubert et. al., The BABAR detector, hep-ex/0105044.
- [3] Y. Ban, “Search for - mixing in hadronic decays at Belle.” result presented at International Conference on Flavor Physics, Hunan, China, June, 2001.
- [4] CLEO Collaboration, R. Godang et. al., Search for mixing, Phys. Rev. Lett. 84 (2000) 5038–5042 [hep-ex/0001060].
- [5] E791 Collaboration, E. M. Aitala et. al., A search for mixing and doubly-Cabibbo- suppressed decays of the in hadronic final states, Phys. Rev. D57 (1998) 13–27 [hep-ex/9608018].
- [6] ALEPH Collaboration, R. Barate et. al., Study of mixing and doubly Cabibbo-suppressed decays, Phys. Lett. B436 (1998) 211–221 [hep-ex/9811021].
- [7] FOCUS Collaboration, J. M. Link et. al., A study of the decay , Phys. Rev. Lett. 86 (2001) 2955–2958 [hep-ex/0012048].