The Muon Anomaly: Experiment and Theory
Abstract
A summary is given of the present status of the theory and experiment of the anomalous magnetic moment of the muon. A difference between predicted and measured values is an indication of physics beyond the Standard Model. A new experimental measurement has produced a value which differs from a recent Standard Model prediction by about 1.6 standard deviations. When first announced, the discrepancy was about 2.6 standard deviations, but theorists have recently found an error in the sign of the largest term in the standard model hadronic light-by-light contribution which reduces the difference. Additional data are being analyzed and elements of the theory are being scrutinized to provide, in the future, a sharper test of theory.
1 Introduction
The magnetic moment of a particle is given in terms of its spin by
and the anomaly is defined as .
Historically, the measurement of particle magnetic moments has been a valuable test of existing theories. For example, magnetic moment measurements on the hyperons have provided essential information on their substructure, and the electron anomaly has been the most stringent test of QED.
The Dirac theory predicts that () for point particles with spin . While the hyperons have g factors very different from 2 because of their complex substructure, the leptons have and anomalies which are nearly zero, consistent with the current evidence that they are point particles. The Standard Model predicts lepton anomalies on the order of one part in 800 due to their field interactions. In the cases of the electron and the muon, both the Standard Model predictions and the measurements are extremely precise, a relatively rare situation resulting in valuable tests of the theory. As we shall see, however, the muon typically has a much stronger sensitivity than the electron to any physics which has not been included in the Standard Model.
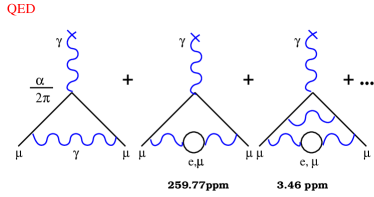
By far the largest contribution to the lepton anomalies comes from the lowest order electromagnetic diagram, the Schwinger term (left diagram in Fig. 1), which gives , e.g. the same for muons and electrons. The next order electromagnetic diagrams, which involve virtual lepton (Fig. 1) or hadron (Fig. 2) loops, are small compared to the Schwinger term, however, they are much larger for the muon than the electron as a result of the additional available rest mass energy. The difference in the contribution between the electron and muon in diagrams involving massive virtual particles typically scales as , and it is this large factor which makes far more sensitive than to any unknown massive particles.
It is instructive to compare the values of the electron and muon anomalies. From Penning trap[2] experiments, we have for the electron (4 ppb) and positron (4 ppb), agreeing within errors as required by CPT invariance. These values are are in good agreement with the theoretical prediction of QED to fourth order in , (21 ppb)[3]. The theoretical error is dominated by the error in the value of taken from Quantum Hall Effect experiments. If one assumes the correctness of QED, then the best determination of comes from the electron anomaly measurements. The hadronic and electroweak contributions, and , respectively, are small and the errors are negligible compared to the experimental errors.
The theoretical and experimental values for the are not known nearly as well as for . In 1999, prior to the new published result, the world average of measured values was (4 ppm). This included 9.4 and 10 ppm results for the positive and negative muon, respectively, in a series of famous experiments at CERN ending in the 1970’s,[6] as well as the results from the new Brookhaven muon (g-2) experiment (E821) using positive muon data taken in 1997 (13 ppm)[7] and 1998 (5 ppm)[8]. All of these measurements are in agreement within their errors, as shown in Fig. 3; the negative muon data were incorporated under the assumption of CPT invariance. Using the recent published compilation of the theoretical ingredients to by Czarnecki and Marciano,[3] (0.6 ppm), which used the hadronic evaluation by Davier and Höcker,[4] we find that agreement between experiment and data was good: . Recently, an error in the hadronic light-by-light contribution was found,[30] which changes the theoretical prediction to (0.6 ppm). This improves the agreement between theory and experiment: .

The new experimental result for , based on a sample of 1 billion positrons collected in 1999 by E821,[9] is (1.3 ppm). The new world value changes very little, (1.3 ppm). Comparing with the uncorrected theoretical number gives a 2.6 difference between measurement and theory: ( ppm). Including the light-by-light correction, ( ppm), a difference.
Two additional data sets, from 2000 and 2001 runs, are currently being analyzed. The 2000 data set consists of about 4 billion events for the and 2001 consists of about 3 billion events for the . The original stated goal of E821 was to reduce the anomaly measurement error to 0.35 ppm. Ideally, one would also equalize the errors on the and in order to optimally test CPT invariance and to study systematic issues in the experiment. We expect to come close to this goal, but this will require a future data run with 6 billion events.
2 Theory Status
The Standard Model contributions to can be conveniently separated into QED, electroweak, and hadronic portions. Although the anomaly is dominated by the QED contribution, there are significant hadronic and EW contributions at the level of ppm and ppm, respectively. We discuss each of these contributions below, with emphasis on the hadronic contribution, whose error dominates the overall error in .
The QED contribution, using from and calculated to fifth order in (some of the highest order diagrams were estimated), contributes[3] an error of 21 ppb to , . Kinoshita[10] reports that some of the fourth order terms are being re-calculated with 128 bit precision, which may result in a small shift in the QED contribution; this is expected to have minimal impact on the comparison between experimental and theoretical values of .
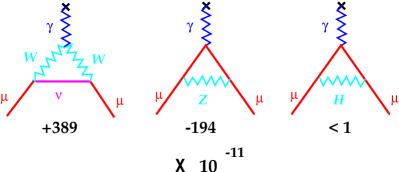
The lowest order electroweak diagrams, involving the exchange of a W, Z or Higgs, are shown in Fig. 4. The electroweak contribution, including the 25% reduction from higher order terms, is[3] ppm. The theoretical uncertainty is very small. The central value is right on the edge of the current experimental error, and it will be a significant contribution at the experimental error goal of 0.35 ppm.
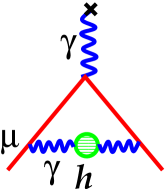
The lowest order hadronic diagram is shown in Fig. 2, where a hadron loop has been inserted into the Schwinger diagram. Since these contributions involve the strong interaction at low energies, they cannot be calculated from first principles. Their contribution can, however, be determined from measured scattering cross sections over all energies through the use of the dispersion relation, Eq. 1, (also see Fig. 5(a))
| (1) |
is a slowly varying function and the data enter through the ratio of cross sections, . The low energy data are the most important as a result of their large amplitude and the term in the integrand, where is the center-of-mass energy.
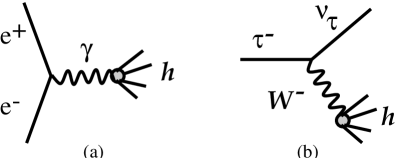
High quality hadronic decay data from LEP and Cornell can be used to augment the isovector part of the data at energies below (second diagram in Fig. 5) using isospin invariance (to relate for example channels in decays to channels in collisions) and the CVC hypothesis (to connect the and photon intermediate states).[11]
There have been a number of evaluations of (had;1) over the past two decades. We will look in some detail at those performed since 1995. The contributions of data to in different energy ranges, from the evaluation by Brown and Worstell,[12] are indicated in Table 1. (We note that the new data which are becoming available will render this table obsolete.) The largest contribution to the value and error are for GeV, a region dominated by the effects of the resonance (see Figs. 6-8). The other energy ranges give a considerably smaller contribution to the error, however for an ppm measurement they cannot be neglected, particularly in the range GeV.
| GeV | Error, ppm | |
|---|---|---|
| 87. % | 1.29 | |
| 4.6 % | 0.21 | |
| 4.0 % | 0.30 | |
| 2.9 % | 0.27 | |
| 1.1 % | 0.12 | |
| (6 states) | 1.3 % | 0.08 |
| QCD | 3.0 % | 0.03 |
| Total | 1.37 |
Since 1995, there has been a substantial improvement in the data quality, but major portions of the data are either preliminary or are still in the process of being incorporated into evaluations of (had;1).
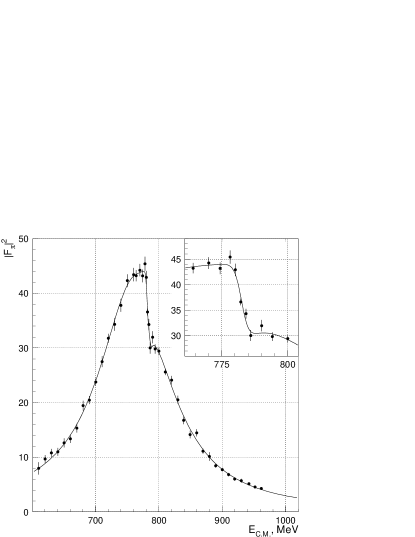
Data on the pion form factor (which can be directly related to the cross section) from the CMD2 and SND experiments at the VEPP-2M accelerator in Novosibirsk are nearing publication. They cover the important energy range GeV. Preliminary data in the resonance range (600 to 930 MeV) from CMD2 are shown in Fig. 6.[13] Their anticipated systematic error of 0.6% in this range would reduce the error contribution from the data in this energy region by better than a factor of two. The VEPP-2000 project is an upgrade under construction at Novosibirsk which will extend quality measurements up to 2 GeV, with an order of magnitude or more improvement in luminosity.
Data relevant to the low energy region are also being taken by the KLOE[14] experiment at DANE. They operate at the mass, and then derive cross sections at lower energies using the so-called radiative return method. In this approach, the initial state electron or positron radiates away some of its energy via a photon, providing access to scattering at energies below the mass. Preliminary data are shown in Fig. 7. Currently their systematic errors are on the order of a few percent, however, they expect to improve this in the near future to the point that they are competitive with the Novosibirsk data. This measurement, along with possible plans at other machines such as the B-factories and Cornell which have access to higher energies, will contribute significantly to the next wave of precision data.

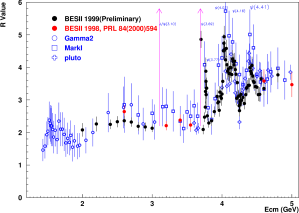
There are new, preliminary and published data from BESII[15] in the important energy range GeV (Fig. 8). Note especially that in the range GeV, which has the largest contribution to (had;1), BESII data have much smaller errors and the central values are 15% lower compared to the old MARK I and Gamma2 data.
High quality decay data, which have been produced over the last few years as described by P. Roudeau at this conference, have significantly reduced the contribution to the error of (had;1) for energies below the mass.[11] In addition, new analysis results should be available soon from ALEPH.[16] Some authors[17],[18] have questioned, however, whether there are sufficient controls over radiative corrections and corrections to the approximations of CVC and isospin invariances. In addition, there appears to be an overall normalization disagreement between the data from ALEPH and Cornell.[19] The data represent, nevertheless, valuable additions and checks on the data at low energies, and various groups plan to study these issues in the future.
A list of (had;1) evaluations is given in Table 2. Various combinations of ingredients were used: data from a wide range of experiments, decay data from LEP and CESR, or theoretical input from perturbative QCD (pQCD) in the higher energy regions where it can be relied upon but where the data quality is poor.
Eidelman and Jegerlehner[20], EJ95, relied primarily on data, using pQCD only at the highest energies ( GeV). Brown and Worstell[12], BW96, used essentially the same data set as EJ95, but took into account the correlation of errors among data points coming from the same experiment. BW96 and EJ95 values and errors are in excellent agreement, suggesting that the correlation issue was not so important. Adel and Yndurain[21], AY95, used pQCD in regions where the data were poor, and obtained a value somewhat higher than, but still in agreement with, EJ95 and BW96. The theoretical input enabled hem to quote a smaller error. In 1998, Adelman, Davier and Höcker,[11] ADH98, did a full re-evaluation using updated values of the data sets used by EJ95 and BW96, obtaining the same error and a central value which was lower but still consistent within errors. ADH98 then incorporated the high quality data from ALEPH, producing a dramatic improvement in the error of the contribution below the mass, and reducing the overall error in by 40%; inclusion of data increased the central value somewhat. Subsequently, Davier and Höcker[22], DH98a, refined the and evaluation of ADH98 by applying pQCD above 1.8 GeV in regions where the data were poor, resulting in another 20% decrease in the error and a decrease in the central value. Most of the changes can be attributed to the effect of using pQCD from 1.8 to 3 GeV, where the old data are rather poor, as seen in Fig. 8. The DH98a evaluation was done before the new BESII data (Fig. 8) were available in this energy range; their pQCD calculations are in very good agreement with the BESII data, and about 15% below the old data, pointing to the reliability of pQCD at these energies. In a subsequent work (DH98b) the same authors applied QCD sum rules at low energies, resulting in slight further reductions in error and central value. The value from DH98b was used in the Czarnecki and Marciano[3] theoretical compilation and also by E821[9] to compare with their new experimental number.
| Ref. | Comment | |
| () | ||
| EJ95[20] | 7024(153) | |
| BW96[12] | 7026(160) | |
| AY95[21] | 7113(103) | ,QCD |
| ADH98[11] | 6950(150) | |
| ADH98[11] | 7011(94) | |
| DH98a[22] | 6951(75) | |
| pQCD | ||
| DH98b[4] | 6924(62) | |
| pQCD, sum rules | ||
| N01[23] | 7021(76) | |
| TY01[24] | 6966(73) | |
| space-like | ||
| E01[25] | 6932(65) | |
| E821[9] | 7350(153) | Expt -[ QED |
| +EW+(Had1)] |
Some preliminary and published theoretical evaluations of (had;1) have appeared since the E821 publication of Brown, et al.[9] Narison[23], N01, has used essentially the same and data sets at low energies and for the resonances as ADH98, with QCD applied to the continuum at the higher energies ( 1.7 GeV), arriving at nearly the same value as ADH98, but with a slightly smaller error. Troconiz and Yndurain[24], TY01, have applied the maximum available data (including some preliminary data) and theory, following the earlier approach of AY95, and also incorporated pion form factor data from pion scattering at low energies, to arrive at a value which compares closely to DH98b, with a slightly larger central value and error.
Finally, Eidelman[13], E01, has produced a preliminary number based entirely on data (except for pQCD at the very highest energies), including the new preliminary results from Novosibirsk and BESII. He obtains a value and error which are almost the same as DH98b.
What can we conclude from this series of determinations? The first thing we note is that within their stated errors, all of the evaluations are in agreement. In particular, the most recent evaluations are in excellent agreement even with their smaller errors, although we note that the DH98b evaluation has the smallest value leading to the largest discrepancy between theory and experiment. Secondly, an analysis which incorporates all of the new and data would be helpful. Eidelman, Davier and Höcker are presently collaborating on such an evaluation. When the final analyses, which include the latest excellent data are completed, we can expect a more reliable value for with a smaller error.
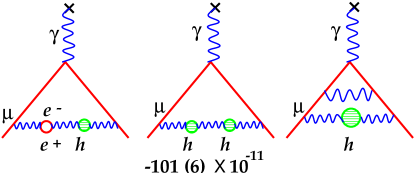
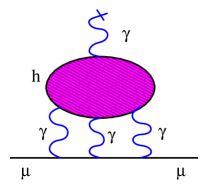
The higher order hadronic contributions, , can be separated into two parts. One part, involving higher order diagrams such as those in Fig. 9, have a relatively small contribution to and the error is negligible:[27] . The other part, involving the hadronic light-on-light diagram in Fig. 10 (LOL), presents special problems because, unlike other hadronic terms, it cannot be estimated based on experimental data. The value used in Czarnecki and Marciano[3] is an average of the values and the errors of two separate determinations[28], [29] (which are in agreement within errors), (had;LOL). Both calculations use models motivated by chiral perturbation theory to calculate the contributions at low energies. The largest contribution comes from the pole term, with lesser contributions from the and poles. Other contributions can be % in size relative to the pole terms, but when added together they largely cancel. After the publication of the new E821 experimental result[9] and after this talk was given at LP01, Knecht and Nyffeler [30] calculated the pion pole contribution using Large- and short-distance properties of QCD. They obtained virtually the same magnitude as in references [28] and [29] but with the opposite sign: . The signs of the and poles also change, however, Knecht and Nyffeler only estimated their magnitude using a VMD model; their total pseudo-scalar contribution is . The sign error has since been acknowledged by the authors of [28] and [29] (see references [31] and [32]). Changing the signs of the pole and axial vector terms, but keeping the other terms as calculated in [28] and [29] the same, increases the theoretical value of by , very close to just reversing the sign on the entire LOL contribution. Knecht and Nyffeler plan in the future to calculate all of the other terms in the hadronic LOL contribution. Several other groups are also considering new ways to tackle this difficult calculation. Ultimately, the hadronic LOL term may prove to be the limiting factor in the theoretical error of .
The theoretical error on has gone down dramatically over the years, and with new, more accurate calculations of the light-by-light contribution, the error and reliability of should continue to improve significantly.
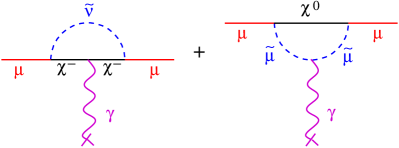
New physics will be reflected by a non-zero value of . Some examples are muon substructure, anomalous gauge couplings, leptoquarks, or supersymmetry. In a minimal supersymmetric model with degenerate sparticle masses (see Fig. 11), the contribution to would be substantial in the case where is large: , where is the sparticle mass. For , GeV. Note that the supersymmetric diagrams (Fig 11) are analogous to the electroweak diagrams (Fig 4). If supersymmetry is to explain all of , then its contribution is large: almost two times bigger than the electroweak contribution. Of course, the presently observed may also be due to a statistical variation in the experimental number or to errors in the experiment or theory. When the additional data are analyzed, and with the continued extensive studies of the theory, one can anticipate that major progress will be made in understanding any non-zero .
3 Experiment
The ongoing muon (g-2) experiment at Brookhaven National Laboratory, E821, had its beginnings in the early 1980’s. Its original goal was to measure to 0.35 ppm, or about 20 times better than the CERN[33] experiment. It received Laboratory approval in 1987, and major construction on the storage ring magnet began in the early 1990’s. The first data were taken in 1997, with one major run in each year 1998-2001. The experimental technique follows the general one used in the CERN experiment with a number of important improvements and innovations.
The Brookhaven AGS delivers up to protons per bunch, with energies of 24 GeV, onto a water-cooled, rotating nickel target. There are 6-12 bunches per second AGS cycle, each about 50 ns wide FWHM and spaced 33 milliseconds apart. Secondary pions emitted from the target with momenta of 3.1 GeV/ are sent down a 72 m straight section of alternating magnetic quadrupoles, where highly polarized muons from forward pion decays are collected. The beam is then momentum-selected for either pions or the slightly lower-momentum muons, and then is injected through a field-free inflector[36] region into a circular storage ring possessing a very homogeneous magnetic field.
For the case of pion injection, with the pion momentum slightly higher than that of the central storage ring momentum, a small fraction ( ppm) of the muons from pion decays will have the correct momenta and directions to be stored. The efficiency of this process is low, and the very high intensity of pions and secondary particles associated with pion interactions with surrounding materials creates severe background problems for the detector system near the injection time (’flash’). An essential improvement over prior experiments was the incorporation of direct muon injection. With muon injection, the number of stored muons is increased by a factor of 10, while the ’flash’ is reduced by a factor of 50 because most of the higher-momentum pions are blocked by beam-line collimators. In the homogeneous B field of the storage ring, charged particles follow a circular path (slightly modified by the electric quadrupole field) which would cause them to strike the inflector after one revolution. Muon injection therefore requires an in-aperture magnetic pulse at around the ring from the injection point (provided by the pulsed ’kicker’) in order to center the muon orbits in the storage region.
With either muon or pion injection, positive (negative) muons are stored in the ring with spins initially polarized anti-parallel (parallel) to their momenta. In a magnetic field (no E-field) the spins precess relative to the muon momenta according to . Here and are the angular frequencies of spin rotation and momentum rotation (or cyclotron angular frequency), respectively. Note that all of the muons precess at the same rate in a given field, regardless of their momenta. Two quantities must be measured with precision to determine : and , each being time averaged over the ensemble of muons. Actually, instead of measuring B, we determine the frequency of precession of the free proton, , in the same average magnetic field as the muons via NMR measurements. The anomaly is given by Eq. 2,
| (2) |
where . is the ratio of the muon and proton magnetic moments determined from other experiments[34],[5]. The analyses of and were independent, and furthermore concealed offsets were maintained in each value so that no one could calculate prior to the completion of the analyses.
The average trajectories of muons in the storage ring can only be known moderately well. Therefore the B field needs to be as uniform as possible to minimize the dependence of a given muon’s precession rate on its exact trajectory in the storage ring. This prohibits the use of a gradient magnetic field to store (focus) the beam. E821 follows the CERN approach of using a quadrupole electrostatic field to provide the focusing. In the presence of the electric field, the precession is described by Eq. 3,
| (3) |
The “magic” , or GeV/, is chosen so that , minimizing the effect of on . Because not all stored muons have the exact magic momentum, a small correction ( ppm) must be applied to the final value for . Equation 3 is strictly valid only for muon motion perpendicular to B; the up-down motion associated with vertical betatron oscillations leads to another small correction of ppm, the so-called “pitch correction”.
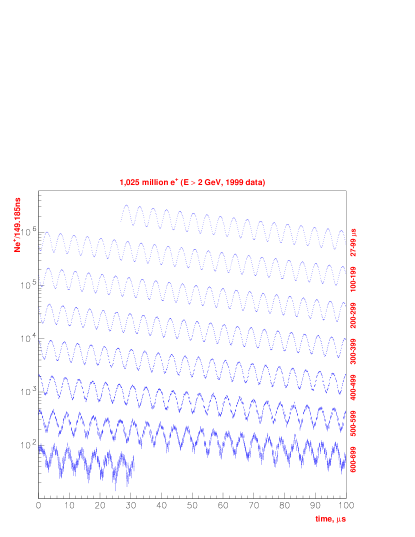
The practical limit to the strength of a ferric field with the required homogeneity is T; E821 chose T, leading to a ring radius of m. The storage ring aperture radius is 4.5 cm, giving a () base-to-base range in stored momenta for pion (muon) injection. The cyclotron period is ns, the precession period is s and the dilated muon lifetime is s. Decays are typically measured for at least ten muon lifetimes, or about 4000 cyclotron and 150 precession periods. A log plot of the 1999 data set, folded into periods, is shown in Fig. 12.
The error on from the combined and data sets from the CERN[6] g-2 experiment is 7 ppm with a 1.5 ppm systematic error. By comparison, E821 must keep the systematic errors in B() and to less than a few tenths of a ppm to approach its experimental precision goal of 0.35 ppm.
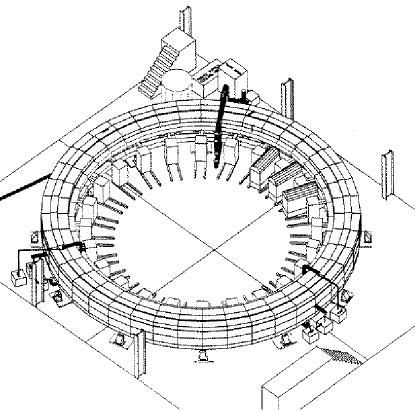
3.1 The Magnet and the Determination of
The storage ring,[35] Fig. 13, is a continuous C-magnet open to the inside. A cross-section view, Fig. 14, shows its essential features. It contains more than 600 tons of magnet steel. Three superconducting coils, which provide exceptional B-field stability with time, are used to power the magnet. The entire magnet is wrapped in thermal insulation to reduce gap changes due to temperature change. The storage region of 4.5 cm radius is defined by a series of circular collimators inside an evacuated chamber. The pole gap is 18 cm high and 53 cm wide.
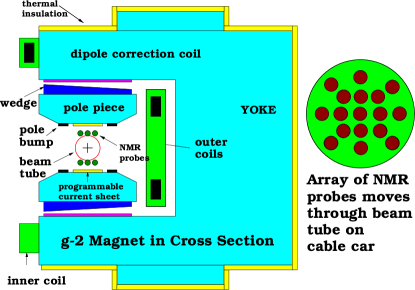
Many shimming options were incorporated in order to achieve the desired field uniformity. The very high-quality steel of the pole tips is decoupled from the lower quality steel and the imperfections (including holes for cryogenic leads, etc.) of the yoke, by means of an air gap. Iron wedges in the gap can be moved radially to locally adjust the dipole field. The thickness and position of iron pole bumps can be adjusted to minimize quadrupole and sextupole fields. Thin sheets of iron were affixed to the pole tips to improve local uniformity. Current-carrying wires attached to circuit boards and mounted on the pole faces, with one set forming a closed loop covering in azimuth and another set going entirely around the ring, provide a final fine-tune of the dipole field.
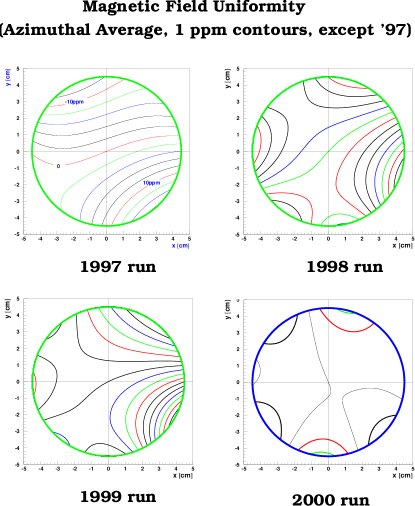
A continuous monitor of the B-field was provided by 360 NMR probes placed in fixed positions around the ring, above and below the storage region. A subset of probes, those most highly correlated to the average B-field, provided feedback to the magnet power supply to compensate for the slight field drifting which are mainly the result of ambient temperature changes. Two separate off-line analyses of the B-field used somewhat different combinations of probes to determine the average field as a function of time, with comparable results. The B-field in the storage region was mapped in 1 cm intervals every three to four days with 17 NMR probes mounted transversely on a movable cable-driven trolley. This was accomplished inside the vacuum, with essentially no geometrical changes to the magnet or vacuum chamber configuration. The NMR probes on the trolley were calibrated against a standard spherical water NMR probe, which was normalized to the precession frequency of a free proton. The fixed probes, in the off-line analysis, tracked the trolley probes to better than 0.15 ppm over time. The steady improvement in the B-field provided by shimming is illustrated in Fig. 15. The marked improvement from 1999 to 2000 is attributable to the replacement of the inflector, which had a damaged superconducting fringe-field shield.
The distribution of muons inside the storage region was determined from an analysis of the debunching of the beam as a function of time. At the time of injection, muons are localized in the ring with a full width at half maximum of about 120 degrees. As a result, the time spectrum from a given detector at early times will contain oscillations with a period equal to the cyclotron period (the so-called “fast rotation” structure). Muons with high momenta have smaller cyclotron frequencies than those with low momenta, causing the bunches to spread out around the ring and the amplitude of the oscillations to diminish with time (“debunching” lifetime ). The analysis of the debunching versus time gave the radius of curvature distribution of the muons, which in combination with simulations of the betatron motion of the muons produces the radial and vertical distribution of muons in the storage aperture. The distributions thus deduced were folded geometrically with the map of NMR frequencies to obtain . Corroborating information on the horizontal and vertical distributions of muons, as well as information on the betatron motion, at early times, was provided by scintillating fiber hodoscopes which could be inserted into the storage region. The hodoscopes were sufficiently thin that useful beam profile data could be taken for many tens of microseconds before the beam was degraded.
The final value for the average field is Hz (0.4 ppm). The sources of systematic errors are given in Table 3. The improvements in the 2000 data set are the installation of a new inflector with far less fringe field, greatly reducing the first item in the Table, and better trolley calibrations.
| Source of errors | Error (ppm) |
|---|---|
| Inflector fringe field | |
| Fixed probe calibration | |
| Fixed probe interpolation | |
| Trolley measurements | |
| distribution | 0.12 |
| Absolute calibration | 0.05 |
| Others† | 0.15 |
| Total Syst error on | 0.4 |
† higher multipoles, trolley temperature stability, kicker eddy currents.
3.2 Determination of
The decay positrons from have energies in the range GeV. In the muon rest frame, the higher energy positrons are preferentially emitted parallel to . When the muon spin is parallel to the muon momentum, there will be more high energy muons in the lab frame than when the directions are anti-parallel. The number of positrons in the lab frame above a given energy threshold versus time therefore oscillates at the precession frequency according to Eq. 4,
| (4) | |||||
where each of and depend strongly on , while depends slightly on .
The positrons, generally having lower momenta than the muons, are swept by the B field to the inside of the storage ring, where they are intercepted by 24 scintillating fiber/lead electromagnetic calorimeters[37] uniformly spaced around the ring. The typical energy resolution of the calorimeters is . Since a low energy positron arrives at the detectors more quickly after muon decay than a high energy positron (the average distance traveled is less), the actual measured times at the detectors relative to the muon decay time will depend slightly on energy, therefore depends slightly on . is highly correlated to , implying the need to accurately calibrate the energy scale of the calorimeters. They were calibrated, on average, to better than 0.2%, using the observed energy spectra of decay positrons as a function of time. This corresponds to an 0.02 ppm systematic error in . The average positron time measurement was stable to 20 ps over any 200 time interval, as determined by a laser calibration system, also giving about an 0.1 ppm systematic error.
Each calorimeter is equipped with 4 photomultiplier tubes, whose sum is sent to a waveform digitizer (WFD)[38] which samples the photomultiplier pulse height every 2.5 ns. Both the time of arrival and the energy of the positron are determined from the WFD information.
For 1999, the analysis occurred in two steps. First, in the production step, WFD data were converted to positron energies and times. There were two separate productions of the data. They each developed independent algorithms to handle the WFD data, which eventually evolved to become similar. The second step involved performing minimization fits to the data in Fig. 12 to obtain . The parent distribution in Eq. 4 provided a good fit to the 1998 data sample, with five variable parameters: , , , and . It did not however provide a good fit to the 1999 data, which has 15 times more positrons. It was necessary to account for small but noticeable effects from pulses overlapping in time at high rates (pile-up), betatron motion of the stored muons, and muon losses.
There were four independent analyses of the positron time spectra for the 1999 data set, two for each production. They used different methods to handle these additional effects. The time spectrum, with these additional effects, can be described by a 14 parameter function, Eq. 5 (not all parameters are necessarily variable in a fit):
| (5) | |||||
The pile-up term, p(t), with parameters , , , is given by Eq. 6
| (6) | |||||
At times close to injection, the bunching of the muons leads, in addition to the previously mentioned oscillations, to an enhancement of the pileup. The oscillations are eliminated from the time spectra by using a bin width , adding to each arrival time a time uniformly randomized over , and summing all detectors around the ring. The pile-up enhancement is accounted for by the last term in Eq. 6; the constants are held fixed to values determined in separate pile-up studies.
Two of the analyses constructed a simulated pileup time spectrum by combining single positron pulses, from data, into pile-up pulses. The pileup spectrum was then subtracted from the primary spectrum, thus eliminating the p(t) term from their fits. A third analysis varied and , with held fixed to the value determined by a fit to an artificial pileup spectrum. Fits made with variable produced a result consistent with other methods, but the statistical error on was doubled as a consequence of the strong correlations of to and .
The amplitude of pile-up was generally less than 1% even at the earliest decay times, with an asymmetry small compared to the (g-2) asymmetry, . The artificial pileup spectrum gave the expected lifetime, and when subtracted from the main spectrum, did a very good job of eliminating events above the maximum electron energy of 3.1 GeV, which apart from energy resolution effects could only be due to pileup. The properties of the artificial pile-up spectrum matched very well with the results of multi-parameter pile-up fitting.
The coherent betatron oscillation (CBO) term, b(t), with parameters , , , and , is described by Eq. 7,
| (7) |
The need for b(t) is due to the effects of betatron motion of the muons combined with the restricted aperture of the inflector. Muons are injected into the ring through the inflector, whose aperture was considerably smaller than the storage ring aperture because of mechanical and geometrical limitations. This creates a muon beam with narrow horizontal (1.8 cm) and vertical (5.6 cm) waists at the inflector exit at injection time. The more important horizontal waist case will be discussed here. In a perfectly uniform B field with no electric field, the muon trajectories, projected into the plane of the magnet, are circles. After the muons are kicked, the position of the horizontal waist would ideally be in the center of the storage region. The kick, however, was generally less than 100% of its optimum value. Therefore the average radius of muons at the narrow waist, at injection time, was larger than the central storage region radius. At 180 degrees around the ring from the narrow waist, the muons are spread out to fill the ring aperture, and have an average radius more nearly equal to the central ring radius. The acceptance of the electron calorimeters depends to a slight extent on the horizontal width and especially on the average radial position of the muon beam. Thus the detector positron acceptance will be different at the narrow waist compared to the opposite side of the ring. When we add electrostatic focusing, the position of the narrow waist (or focus) will move around the ring at the so-called CBO frequency, which is the cyclotron frequency minus the horizontal betatron frequency, . For the field index , kHz. As a result, we get a small oscillation at kHz superimposed on the time spectrum. The amplitude of the CBO is typically a few tenths of a percent of the total number of counts, and is long, about 100 s.
One analysis allowed all four CBO parameters to vary. Two kept fixed to the value obtained from a Fourier transform of the residuals from a five-parameter fit. The frequencies from the Fourier transform and the fit were in good agreement.
The muon loss term, Eq. 8, has two parameters, and ,
| (8) |
Muon losses are thought to be caused by the slight drift of the orbits of muons whose trajectories bring them close to collimators. The drift could be caused by the small non-uniformities in the E and B- fields, although the exact mechanism is not known. Indeed, when the beam is ’scraped’ for about right after injection, by temporarily displacing the stored muon beam several millimeters vertically and horizontally in order to force the loss of muons with trajectories close to the collimators. The rate of muon loss is markedly reduced after the scraping is turned off, compared to the no scraping case. After scraping, losses are generally less than 1% at early decay times, with the rate of losses decreasing with a short lifetime of . In addition there was a roughly constant loss rate of per muon lifetime at all decay times, as determined by comparing the measured decay rate with that expected from special relativity. The two analyses which allowed both parameters to vary obtained the same loss lifetime as was observed in a third analysis which held fixed to the value determined using separate muon loss detectors.
It is important to realize that only two of the 14 parameters in Eq. 5 have a large correlation to : and . The latter parameter received a great deal of study during the pile-up analysis. The former introduces no systematic error, but increases the statistical error by a factor .
| # Par. | R(ppm) | |
|---|---|---|
| 13 | ||
| 10 | ||
| 9 | ||
| 3 | ||
| Avg. |
| Source of errors | Error (ppm) |
|---|---|
| Pile-up | |
| AGS background | |
| Lost muons | |
| Timing shifts | |
| E field, pitch | 0.08 |
| Binning, fit procedure | 0.07 |
| Debunching | 0.04 |
| Gain changes | 0.02 |
| Total Syst error on | 0.3 |
The fourth analysis was the novel “ratio fit”. After pile-up subtraction, events were randomly assigned to four separate time histograms. Then, the ratio in Eq. 9 was formed:
| (9) | |||||
where , , , and . The muon lifetime cancels, and is sufficiently insensitive to the CBO and the muon losses that these effects can be neglected in the fit. The insensitivity to the CBO is a consequence of being not so different from . We arrive at a three parameter fit which has different responses to systematic errors compared to the conventional multi-parameter fits.
The results of the four analyses are given in Table 4. All of the results are well within the bounds expected for correlated data sets. The final value for is the average of these results, Hz(1.3 ppm), after a correction of ppm for the effects of the electric field in Eq. 3 and for vertical betatron oscillations (“pitch” correction).[8] Note that the data are not sensitive to the sign of ; this however is well-determined from many other experimental measurements, and is implicit in the value of which we use to extract the value of . The sources of systematic error in are given in Table 5. The AGS background is the result of unwanted particle injection into the ring after the initial injection. The improvements for the 2000 data run were the addition of a sweeper magnet in the beam-line to eliminate errors due to the AGS background, and an increase in the number of lost muon detectors in order to reduce the muon loss error.
4 Conclusions and Outlook
The muon anomalous magnetic moment can be both measured and calculated (within the Standard Model) to a high precision, and given its high sensitivity to new physics, its measurement affords an exceptional opportunity to probe for new physics beyond the Standard Model.
The new world average value of shows a ppm difference from the Czarnecki and Marciano[3] theory compilation, after the sign of the LOL pole term is corrected. Many theoretical ideas have been put forward to explain any difference, including supersymmetry, leptoquarks, muon substructure, etc. It could of course also be explained by a statistical fluctuation, an error in the experiment, or an error in the Standard Model calculation.
All aspects of the theoretical calculation of are being heavily scrutinized. New high quality data from VEPP-2M and Beijing as well as decay data from LEP, are being analyzed now, and should have an impact on in the next few months. Longer term, Novosibirsk and Beijing have upgrade plans, and DANE (and perhaps the B-factories and Cornell) have plans to use the radiative return process to measure cross sections. Further calculations of the light-by-light term are being considered by several groups. One can reasonably expect a continued steady improvement in the error and reliability of .
In E821, analysis is under way on the 4 billion positrons () from the 2000 run (about four times larger than the 1999 data set) and on the 3 billion electrons () from the 2001 run. Systematic errors are expected to be reduced for both data sets. Once these data are analyzed, it should be possible to make a more definitive statement concerning whether the measured anomaly agrees with theory. Comparison of the and anomalies is a test of both the systematic errors in E821 and also CPT invariance. With another data run, E821 expects to achieve ppm statistical error on and an estimated ppm systematic error, not far from the original goal of 0.35 ppm overall error.
It is interesting to note that any new physics affecting may also lead to a non-zero permanent electric dipole moment for the muon, through its CP violating part. Assuming that the CP violating phase for new physics , then dimensional arguments, along with the observed value for , give[39] . Even if experiment and theory were to agree, the muon EDM is interesting in its own right: it is the only currently accessible EDM from a second generation particle. Comparing with the electron, the current limit on the electron dipole moment is . If the EDM scales by the first power of the mass, then a muon measurement is competitive with that of the electron. There are speculations, however, that the electron EDM could be small due to an accidental cancellation which may not apply to the muon. Or, if the scaling is with the square of the mass or higher, the muon then becomes more sensitive than the electron to new physics.[40] There are a number of models which predict in the range to .[39]
The presence of an EDM adds the term
| (10) |
to Eq. 3, where the EDM is given by . In the (g-2) experiment, the effect of the dominant term is to tip the precession vector radially by an angle . This causes an increase in the precession frequency to . It also causes an oscillation about zero of the average vertical component of the positron momenta, which can be observed as an oscillation, with frequency , in the average vertical position of positrons on the face of the calorimeters.
In the unlikely event that all of can be attributed to a muon EDM, then . The CERN (g-2)[6] experiment has set the best limit on the muon EDM so far, , deduced from limits on the vertical oscillations. While this value for is larger than any theory predicts, it is nevertheless not ruled out by CERN limit. E821 expects to reduce the limit by about a factor of five from an improved measurement of the vertical oscillations.
A dedicated experiment to measure the muon EDM to the level is currently being developed at Brookhaven National Laboratory.[41] It would use a new technique where a muon momentum and an applied electric field would be selected so that the second term cancels the first term in Eq. 3. One is only left with the motion in a vertical plane described by Eq. 10. In this technique, there is a very large enhancement of the EDM signal relative to the “noise” over the technique used in the g-2 experiments. It is planned to mount this experiment over the next few years.
5 Acknowledgments
The author would like to thank R. Carey, D. Hertzog, K. Jungmann and Y. Semertzidis for helpful comments on this manuscript. The author’s work is supported by the U.S. National Science Foundation. Opinions regarding the theoretical content of are solely those of the author and do not necessarily reflect the opinions of the E821 experiment. E821 is supported by the U.S. Department of Energy, the U.S. National Science Foundation, the German Bundesminister für Bildung und Forschung, the Russian Ministry of Science, and the U.S.-Japan Agreement in High Energy Physics.
References
- [1] H.N. Brown2, G. Bunce2, R.M. Carey1, P. Cushman9, G.T. Danby2, P.T. Debevec7, M. Deile11, H. Deng11, W. Deninger7, S.K. Dhawan11, V.P. Druzhinin3, L. Duong9, E. Efstathiadis1, F.J.M. Farley11, G.V. Fedotovich3, S. Giron9, F. Gray7, D. Grigoriev3, M. Grosse-Perdekamp11, A. Grossmann6, M.F. Hare1, D.W. Hertzog7, V.W. Hughes11, M. Iwasaki10, K. Jungmann6, D. Kawall11, M. Kawamura10, B.I. Khazin3, J. Kindem9, F. Krienen1, I. Kronkvist9, R. Larsen2, Y.Y. Lee2, I. Logashenko1, R. McNabb9, W. Meng2, J. Mi2, J.P. Miller1, W.M. Morse2, D. Nikas2, C. Onderwater7, Y. Orlov4, C.S. Özben2, J. Paley1, C. Polly7, J. Pretz11, R. Prigl2, G.zu Putlitz6, S.I. Redin11, O. Rind1, B.L. Roberts1, N.M. Ryskulov3, S. Sedykh7, Y.K. Semertzidis2, Yu.M. Shatunov3, E. Sichtermann11, E. Solodov3, M. Sossong7, A. Steinmetz11, L.R. Sulak1, C. Timmermans9, A. Trofimov1, D. Urner7, P. von Walter6, D. Warburton2 D. Winn5, A. Yamamoto8, D. Zimmerman9 1Boston University, Boston, Massachusetts 02215, USA 2Brookhaven National Laboratory, Physics Dept., Upton, NY 11973, USA 3Budker Institute of Nuclear Physics, Novosibirsk, Russia 4Newman Laboratory, Cornell University, Ithaca, NY 14853, USA 5Fairfield University, Fairfield, Connecticut 06430, USA 6University of Heidelberg, Heidelberg 69120, Germany 7University of Illinois, Physics Dept., Urbana-Champaign, IL 61801, USA 8KEK, High Energy Accelerator Research Organization, Tsukuba, Ibaraki 305-0801, Japan 9University of Minnesota, Physics Dept., Minneapolis, MN 55455, USA 10Tokyo Institute of Technology, Tokyo, Japan 11Yale University, Physics Dept., New Haven, CT 06511,USA
- [2] Van Dyck, Schwinberg, Dehmelt, Phys. Rev. D34, 722(1986).
- [3] A. Czarnecki and W.J. Marciano, Nucl. Phys. (Proc. Suppl.) B76, 245 (1999).
- [4] M. Davier and A. Höcker, Phys. Lett. B435, 427 (1998).
- [5] D.E. Groom, et al, the Particle Data Group, Eur. Phys. J C15, 1 (2000).
- [6] J. Bailey, et al, Nucl. Phys. B150, 1 (1979).
- [7] R.M. Carey, et al., Phys. Rev. Lett. 82. 1632-1635(1999).
- [8] H.N. Brown, et al., Phys. Rev. D62, 091101 (2000).
- [9] H.N. Brown, et al., Phys. Rev. Lett. 86, 2227 (2001).
- [10] T. Kinoshita, private communication.
- [11] R. Alemany, M. Davier, A. Höcker, Eur. Phys. J. C2, 123 (1998).
- [12] D.H. Brown and W. Worstell, Phys. Rev. D54, 3237 (1996).
- [13] S. Eidelman, I. Logashenko, CMD2 collaboration, private communication.
- [14] Data and plot from A. Denig, private communication, also see the contributed paper in this conference by the KLOE collaboration, hep-ex/0107023.
- [15] BESII collaboration, Phys. Rev. Lett. 84, 594 (2000); Preliminary data and plot from Z. Zhao, private communication.
- [16] M. Davier, private communication.
- [17] S.I. Eidelman and V.N. Ivanchenko, Nucl. Phys. Proc. Suppl. 40, 131 (1995).
- [18] K. Melnikov, SLAC-PUB-8844, hep-ph/0105267, May 2001.
- [19] Data from Cornell, Jon Urheim, private communication.
- [20] S. Eidelman and F. Jegerlehner, Z. Phys. C67, 585( 1995).
- [21] K. Adel and F.J. Yndurain, hep-ph/9509378, 1995 and Rev. Acad. Ciencas (Esp.), 92, 736 (1985).
- [22] M. Davier and A. Höcker, Phys. Lett. B419, 419 (1998).
- [23] S. Narison, hep-ph/0103199, March 2001; Phys. Lett. B513, 53( 2001).
- [24] J.F. Troconiz and F.J. Yndurain, hep-ph/0106025, 2001.
- [25] S. Eidelman, preliminary result from Novosibirsk, private communication.
- [26] W. Marciano and B. Roberts, hep-ph/0105056, May 2001.
- [27] B. Krause, Phys. Lett. B390, 392 (1997).
- [28] M. Hayakawa and T. Kinoshita, Phys. Rev. D57, 465 (1998).
- [29] J. Bijnens, E. Palanta, J. Prades, Nucl. Phys. B474, 379 (1996).
- [30] M. Knecht and A. Nyffeler, hep-ph/0111058, 6 Nov 2001. Also see M. Knecht, A. Nyffeler, M. Perrottet, and E. de Rafael, hep-ph/0111059, 6 Nov 2001.
- [31] M. Hayakawa and T. Kinoshita, hep-ph/0112102, 16 Dec 2001.
- [32] J. Bijnens, E. Palanta, J. Prades, hep-ph/0112255, 19 Dec 2001.
- [33] J. Bailey et al., Nucl. Phys. B150, 1 (1979).
- [34] W. Liu, et al., Phys. Rev. Lett. 82, 711 (1999).
- [35] G.T. Danby, et al., Nucl. Instrum. Methods A457, 51 (2001).
- [36] F. Krienen, D. Loomba and W. Meng, Nucl. Instrum. Methods A283, 5 (1989). A. Yamamoto, et al., Proc. of 15th Int. Conf. on Magnetic Technology, Science Press Beijing, 246 (1998).
- [37] S. Sedykh, et al., Nucl. Instrum. Methods A455, 346 (2000).
- [38] R. Carey, et al., to be published, Nucl. Instrum. and Methods.
- [39] J.L.Feng, K.T. Matchev and Y. Shadmi, “Theoretical expectations for the muon’s electric dipole moment,” hep-ph/0107182.
- [40] K.S. Babu, S.M. Barr and I. Dorsner, “The scaling of lepton dipole moments with lepton mass,” hep-ph/0012303.
- [41] R.Carey, et al., “Request for R&D Funds Toward a Proposal for the Muon Electric Dipole Moment Experiment”, submitted to the Brookhaven National Laboratory Program Advisory Committee, Fall, 2001, http://www.bnl.gov/edm/.