SLAC-PUB-9034
BABAR-PROC-01/82
Three body decays of and mesons
Antimo Palano
INFN and University of Bari, Italy
(for the B AB AR Collaboration)
Abstract
Results are presented on the study of three body decays of , where and . The data have been collected by the BaBar experiment at SLAC and are extracted from continuum annihilations at the energy.
Presented at Hadron 2001, IX International Conference on Hadron Spectroscopy
August 25–September 1, 2001, Protvino, Russia
Stanford Linear Accelerator Center, Stanford University, Stanford, CA 94309
Work supported in part by Department of Energy contract DE-AC03-76SF00515.
1 Introduction
New generation experiments are providing large data sets for charm physics with statistics which supersede most previous measurements. The Dalitz plot analyses of 3-body charm decays have been performed in the past but these new large and clean samples will allow high precision measurements that were never before possible.
The Dalitz plot analysis of three-body decays is a relatively new technique in development for charm physics studies. This method of analysis is the most complete way of analyzing the data since it allows measurement of both decay amplitudes and phases. The final state is the result of the interference of all intermediate states. The significant results provided by these studies are:
-
•
Accurate measurements of branching fractions.
-
•
A study of Final State Interactions.
-
•
A study of CP violation in rates and decay amplitudes.
-
•
New input to several old unsolved problems in light meson spectroscopy, in particular to the scalar mesons puzzle.
Factorization models assume the weak decay amplitudes to be real. The fact that the observed amplitudes have a relative complex phase is a consequence of final state interaction.
CP violation is expected to be small in charm decays () [1]. Two amplitudes with different phases are needed:
In singly Cabibbo-suppressed decays penguin terms may provide a weak phase, while Final State Interactions provide a strong phase shift. Under CP the weak phases change sign but the strong ones do not. Any difference between and in the Dalitz plot would be evidence for CP violation.
Throughout this paper charge conjugate modes, where not explicit, are implied.
2 The BaBar Experiment
The PEPII Collider is an asymmetric storage ring which collides 9 GeV electrons with 3.1 GeV positrons with a peak luminosity of 4.2 . The resonance is produced with in the laboratory frame at zero crossing angle. Details on the layout of the apparatus, trigger conditions and data processing can be found in previous publications [2].
The resonance sits on a large continuum background with a contribution from of 1.30 nb. The power of BaBar for studying charm physics is based on:
-
•
Relatively small combinatorics because of interactions.
-
•
Good vertexing.
-
•
Good Particle Identification.
-
•
Detection of all possible final states, with charged tracks and ’s.
-
•
Very high statistics.
The BaBar experiment is continuously collecting data. This work is based on the data taken during 1999/2000 and corresponds to an integrated luminosity of unless otherwise specified.
3 Study of
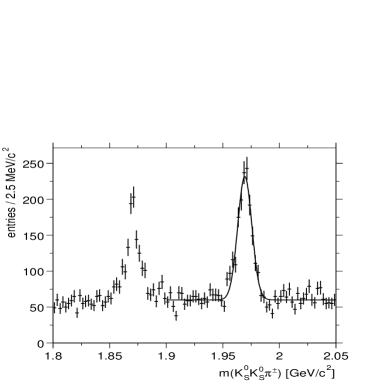
The resonance has been measured with spin 0 or 2 in different experiments. It has been a candidate for being the lowest lying scalar or tensor glueball. It has been observed in decay, central production and collisions [3]. Details on the selection criteria used to isolate the final state can be found in ref. [4]. The mass spectrum (relative to an integrated luminosity of 18.4 ) is plotted in fig. 1 and shows signals from and .
 |
 |
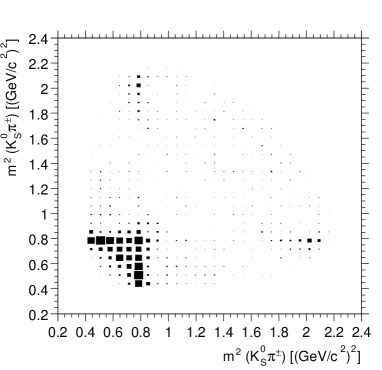
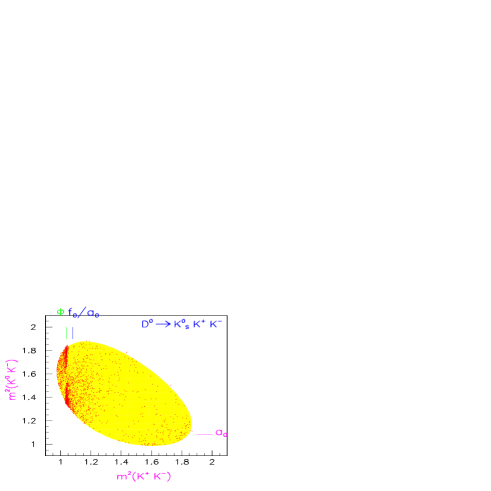
The background subtracted Dalitz plot and its projection are shown in fig. 2. Strong accumulations in the region of the can be seen. A preliminary Dalitz plot analysis shows that the data cannot be described with alone but require the presence of the final state.
4 Selection of
’s are required to come from a decay:
Therefore the charge of the slow gives the flavour of the and that of the (apart from the contribution from DCSD, which is expected to be ).
The selection of the channel starts with the reconstruction of the and vertices. The slow are refitted using the beam spot constraint to improve the resolution, (beam spot size: ). The center of mass momentum of the () has been required to be greater then 2.2 GeV/c.
The mass difference:
where the slow pion has a momentum below 0.6 GeV/c is plotted in fig. 3. Fig. 3a) and fig. 3b) show respectively the distribution before and after having required a 2.5 cut around the mass.
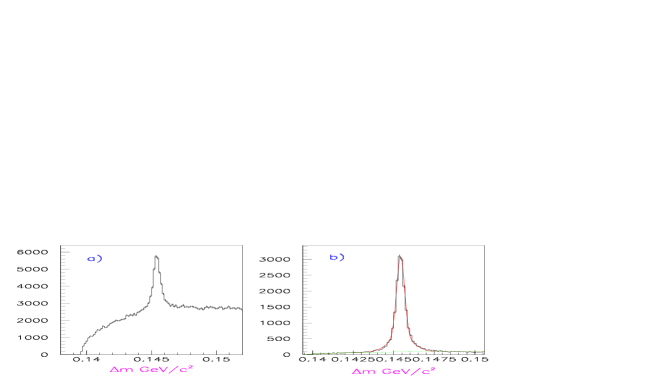
Fitting the width using a single Gaussian and a threshold function , we obtain . Performing now a 2.0 cut on we obtain the shown in fig. 4. The width obtained fitting only one Gaussian and a linear background is: .
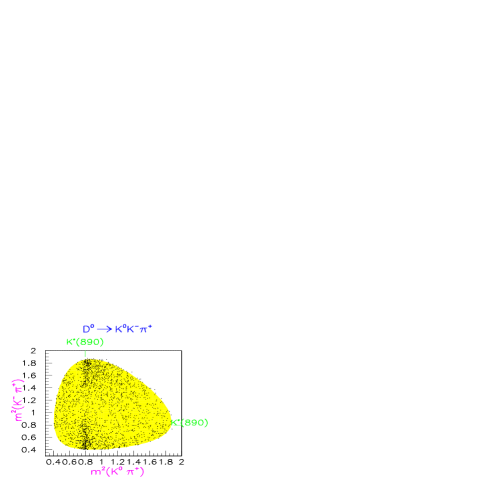
The Dalitz plot of , obtained by selecting events within 2.5 of the mass, is shown in fig. 5 (15753 events) and its projections are shown in fig. 6. The background fraction, estimated to be 4.1 %, has not been subtracted.
This Dalitz plot reveals a complex structure. Several intermediate resonant states involving , , , , resonances can be seen. Strong interferences can also be seen. In particular, resonance shows up as a uniform horizontal depletion suggesting interference with a broad scalar resonance.
5 Selection of
The decay contains two possible decay modes:
The charge of the pion separates the two decay modes. Diagrams contributing to the two decay channels are shown in fig. 7.

 |
 |
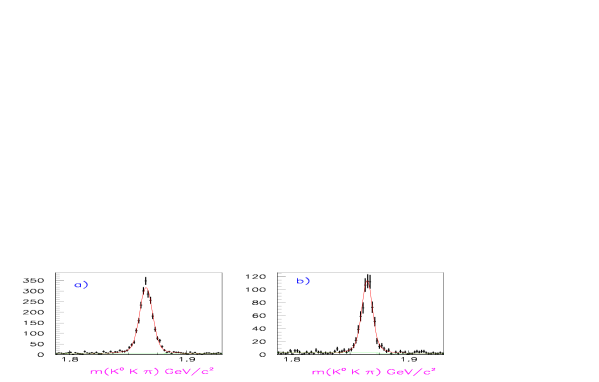
The channels have been isolated using similar cuts on the corresponding distribution. Requiring one of the two charged tracks to be positively identified as a kaon we obtain the mass distributions for the two decay modes shown in fig. 8.
The fitted widths and yields obtained using only one Gaussian and a linear background are the following:
The above yields indicate that branching fractions for the above decay channels are different.
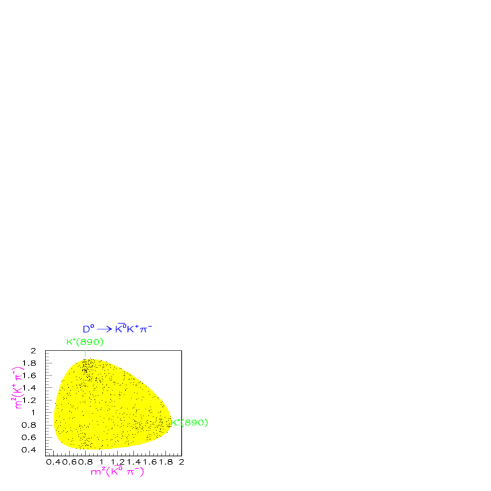
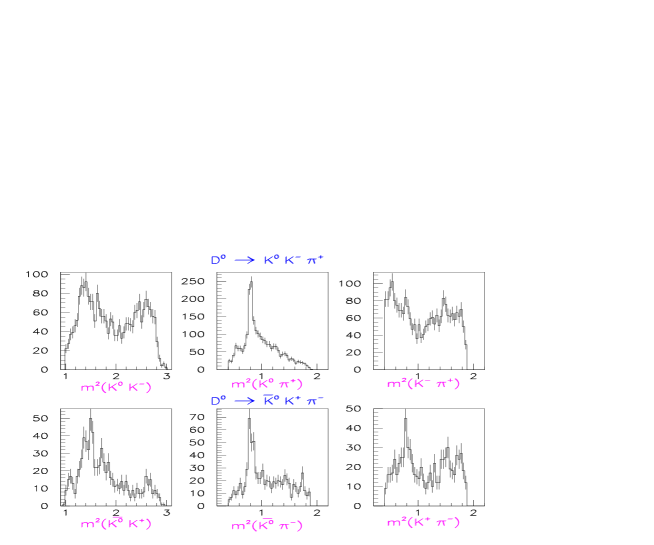
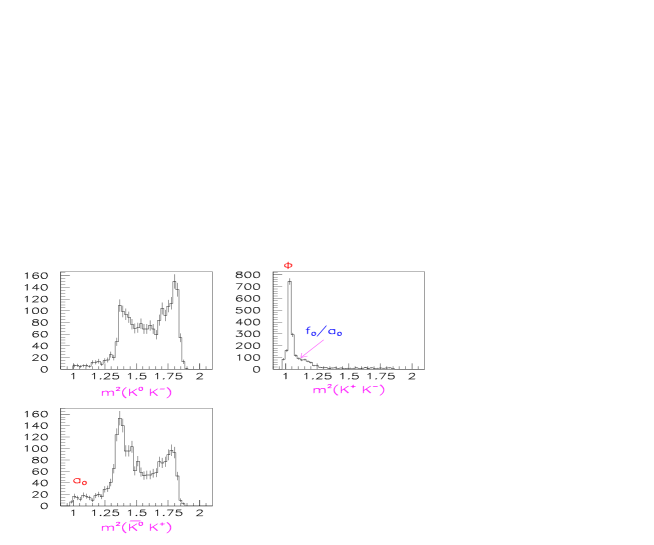
The two Dalitz plots are shown in fig. 9 and their projections are shown in fig. 10. The background fractions for decays a) and b) have been estimated to be 4 % and 5% respectively and have not been subtracted.
The decay is dominated by with a small contribution from . We also observe the presence of broad structure. The decay shows more symmetric and contributions.

6 Selection of
The channel has been isolated performing a similar cut and requiring at least one of the two charged tracks to be positively identified as a kaon. The mass spectrum is shown in fig. 11.
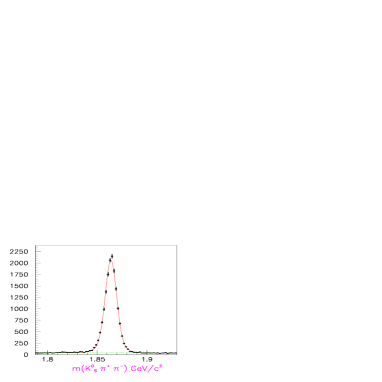
The width obtained fitting the mass spectrum with one Gaussian and a linear background is (3.7 0.1) and the yield is 2089 events.
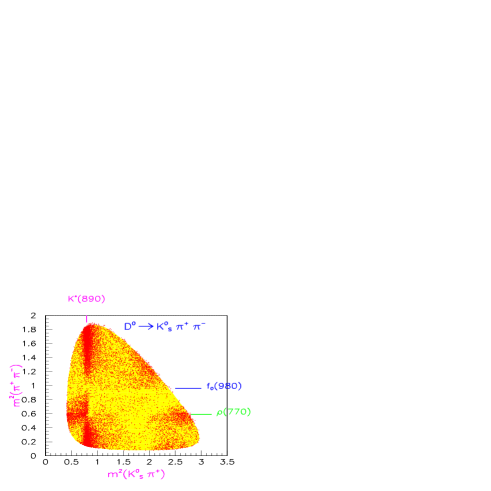
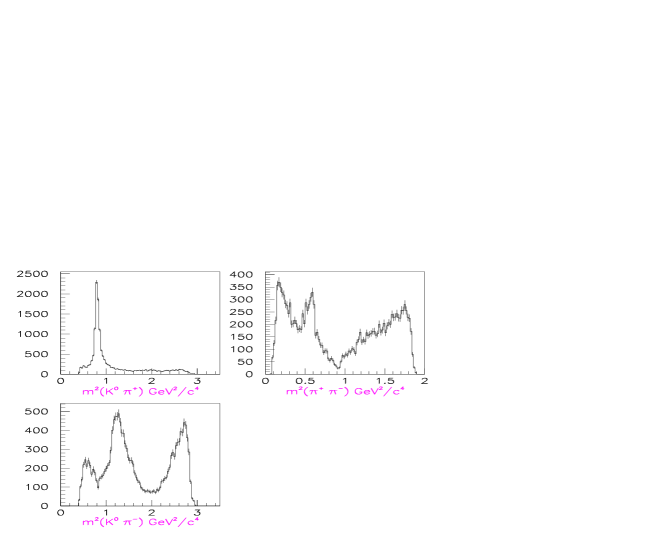
The Dalitz plot of is shown in fig. 12 and contains a background fraction of 3 % (not subtracted). The corresponding projections are shown in fig. 13.
The presence of intermediate states involving , and resonances is clearly visible.
7 Conclusions
Charm Physics can be performed at B-factories with high statistics and small backgrounds. The Dalitz plot analysis as well as measurements of CP asymmetries in the decay amplitudes and rates for different charmed mesons are in progress.
In the near future, Charm Physics will be dominated by B-factories and /charm factories. Present available statistics for Dalitz charm decays from fixed target and B-factories are: 1–5 events for Cabibbo allowed, 1–10 events for Cabibbo suppressed and 50–300 events for double Cabibbo suppressed decays.
Given the large data samples being accumulated, we expect in the next few years an increase of these yields by a factor 20. This will allow charm physics to be rewritten with errors on branching fractions reduced by more than a factor 10.
References
- [1] M. Golden and B. Grinstein, Phys. Lett. B222 501 (1989).
- [2] B. Aubert et al., The BaBar Detector, SLAC-PUB-8569, hep-ex/0105044, to appear in NIM.
- [3] D.E. Groom et al., The European Physical Journal C15 (2000) 1.
- [4] T. Deppermann (BaBar Collaboration), Dalitz Analyses of and , these proceedings.