Experimental Tests of the Standard Model
Abstract:
The current status of experimental tests of the electroweak sector of the Standard Model is reviewed.
BHAM-HEP/01-02
31 October 2001
1 Introduction
The field of precise experimental tests of the electroweak sector of the Standard Model encompasses a wide range of experiments. The current status of these is reviewed in this report, with emphasis placed on new developments in the year preceding summer 2001. A theme common to many measurements is that theoretical and experimental uncertainties are comparable. The theoretical uncertainties, usually coming from the lack of higher-order calculations, can be at least as hard to estimate reliably as the experimental errors.
At low energies, new hadronic cross-section results in e+e- collisions are discussed. The new measurement of the muon anomalous magnetic moment at Brookhaven is reported and compared with recent Standard Model calculations. Results from the now complete LEP data sample are reviewed, together with recent results from the Tevatron, HERA and SLD. The synthesis of many of these results into a global test of the Standard Model via a comprehensive fit is summarised. Finally, prospects for the next few years are considered.
Many results presented here are preliminary: they are not labelled explicitly for lack of space. References should be consulted for details.
2 R and
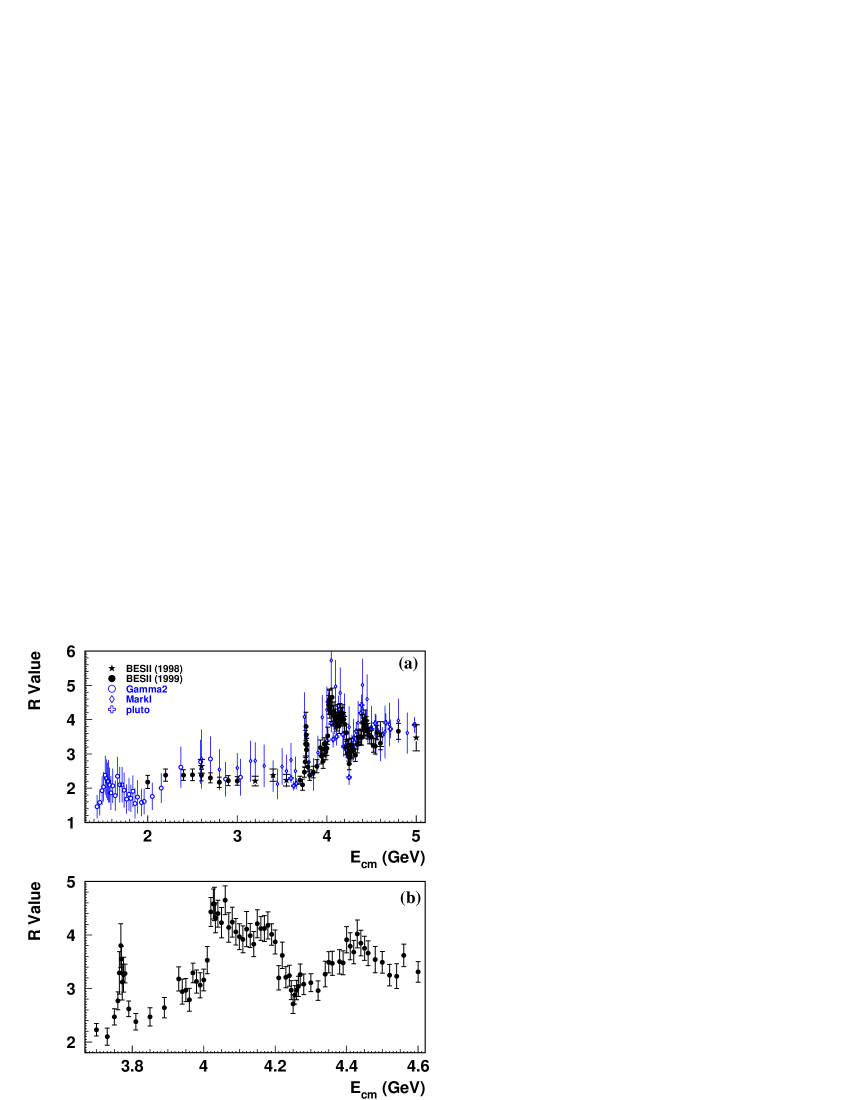
The BES-II detector at the BEPC electron-positron collider in Beijing, China, has been operating since 1997. Many measurements have been made in the centre-of-mass energy range GeV, but of relevance to electroweak physics are those of the ratio
where the denominator, , is the lowest-order QED prediction. The BES measurements [1] of R are presented in Figure 1, where the improvement in quality over previous, often very early, measurements is clear. Around 1000 hadronic events are used at each energy, and an average precision of 6.6% is obtained at each of the 85 energy points. The point-to-point correlated error is estimated to be 3.3%, providing a factor of 2 to 3 improvement over earlier measurements.
In order to achieve such an improvement, detailed studies of the detector acceptance for hadronic events at low were made, in collaboration with the Lund Monte Carlo team. The experimental acceptance for hadronic events varies in the range 50 to 87% from 2 to 4.8 GeV respectively, so the modelling at low is of most concern. Good descriptions of the hadronic event data were obtained from a tuned version of the LUARLW generator, and the hadronic model-dependent uncertainty is estimated to be as low as 2-3%.
At even lower energies, analysis continues of the large data sample from CMD-2 [2] at the VEPP-2M e+e- collider at Novosibirsk taken over GeV. Many exclusive final-states are studied, with the main contribution to the overall cross-section arising from production.
A key application of the low energy R measurements is in the prediction of the value of the electromagnetic coupling at the Z0 mass scale. This is modified from its zero-momentum value, , by vacuum polarisation loop corrections:
The contributions from leptonic and top quark loops ( and , respectively) are sufficiently well calculated knowing only the particle masses. The term contains low-energy hadronic loops, and must be calculated via a dispersion integral:
The R data points must, at least, be interpolated to evaluate this integral. More sophisticated methods are employed by different authors, and use may also be made of decay spectral function data via isospin symmetry. A recent calculation [3] using minimal assumptions has obtained , approximately a factor two more precise than a previous similar estimate which did not use the new BES-II data. With extra theory-driven assumptions, an error as low as may be obtained [4].
Prospects for further improvements in measurements of the hadronic cross-section at low energies are good: an upgraded accelerator in Beijing should give substantially increased luminosity; CLEO proposes to run at lower centre-of-mass energies than before to examine the region from 3 to 5 GeV; DANE may be able to access the low energy range with radiative events; and finally the concept of a very low energy ring to work together with the present PEP-II LER could give access to the poorly covered region between 1.4 and 2 GeV.
3 The Muon Anomalous Magnetic Moment g-2
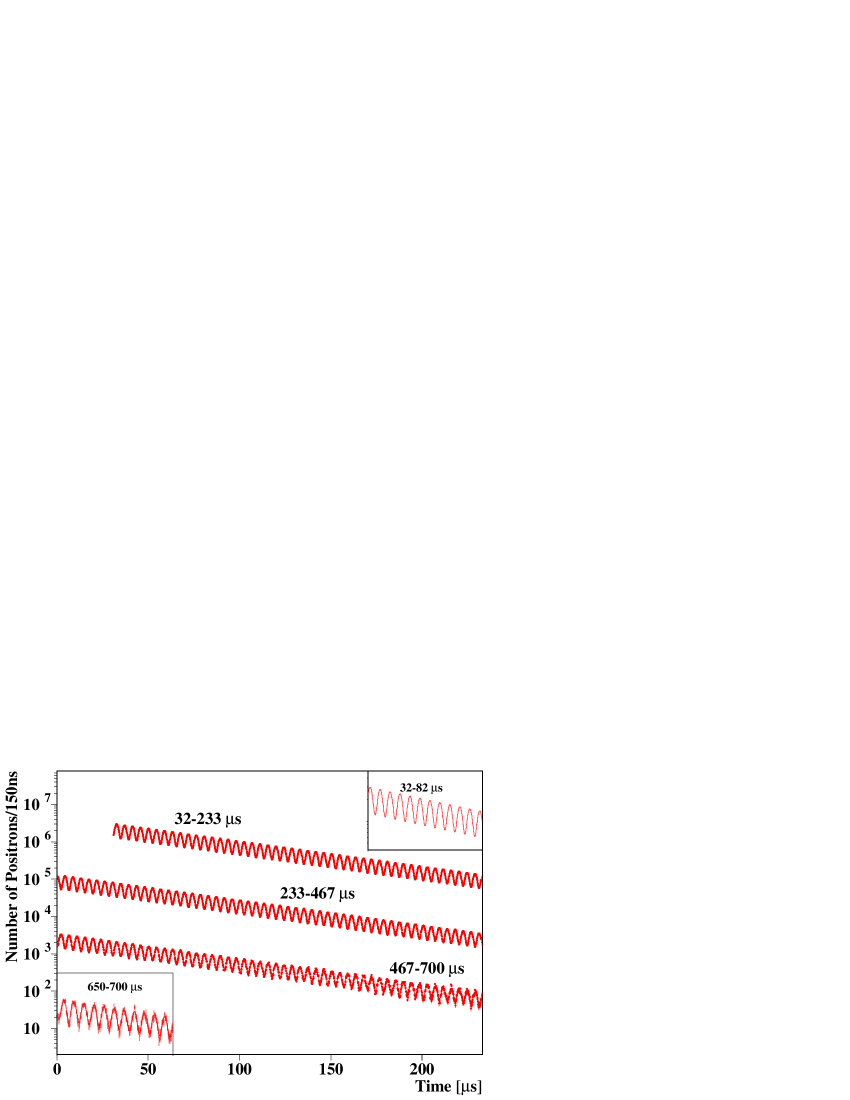
The Brookhaven E821 experiment has recently reported [5] a new measurement of the muon anomalous magnetic moment, , by measuring the spin-precession frequency, , of polarised muons in a magnetic field:
The muons circulate in a special-purpose storage ring constructed to have an extremely uniform magnetic field across its aperture. The spin-precession frequency is measured by observing the time variation of production of decay electrons above a fixed energy cut-off (2 GeV), as shown in Figure 2. The mean bending field is measured using two sets of NMR probes: one fixed set mounted around the ring and used for continuous monitoring, and another set placed on a trolley which can be pulled right around the evacuated beam chamber. In practice, the magnetic field is re-expressed in terms of the mean proton NMR frequency, , and extracted from:
where and is the ratio of muon to proton magnetic moments.
The latest E821 result, obtained using decays is [5]:
The overall precision obtained is relatively 1.3 parts per million: 1.2 ppm from statistics and 0.5 ppm from systematic errors. Data from a further and are in hand, and should result in a factor two improvement in the near future.
Interpretation of this result in terms of the Standard Model and possible new physics requires detailed calculations of loop corrections to the simple QED vertex, which gives the original at lowest order. The corrections may be subdivided into electromagnetic (QED), weak and hadronic parts according to the type of loops. The QED and weak terms are respectively calculated to be , and . The hadronic corrections, although much smaller than the QED correction, provide the main source of uncertainty on the predicted . To , the dominant corrections may be subdivided into the lowest and higher-order vacuum polarisation terms and higher-order “light-on-light” terms. The lowest-order (vacuum polarisation) term is numerically much the largest. It can be calculated using a dispersion relation:
where is a known bounded function. As for , optional additional theory-driven assumptions may be made. Recent estimates of the lowest-order vacuum polarisation term are shown in Table 1. There is some ambiguity at the level of 5 about the treatment of further photon radiation in some of these calculations, as it may be included either here or as a higher-order correction, depending also on whether the input experimental data includes final-states with extra photons. The estimates agree with each other within the overall errors, which is not surprising since the data employed is mostly in common. It is notable that the best value available at the time of the E821 publication was that of Davier and Höcker (“DH(98/2)”), which is numerically the lowest of the calculations.
| Authors | Based on | (LO; hadronic) / 10-10 |
|---|---|---|
| BW(96) [6] | e+e- data | 703 16 |
| ADH(98) [7] | e+e- data | 695 15 |
| ADH(98) [7] | e+e- & data | 701 9 |
| DH(98/1) [8] | e+e- & data | 695 8 |
| DH(98/2) [9] | e+e- & data, QCD sum rules | 692 6 |
| N(01) [10] | e+e- & data | 702 8 |
| J(01) [11] | e+e- & data | 699 11 |
| dTY(01) [12] | e+e- & data | 695 6 |
| CLS(01) [13] | QCD+renormalons & data | 700 9 |
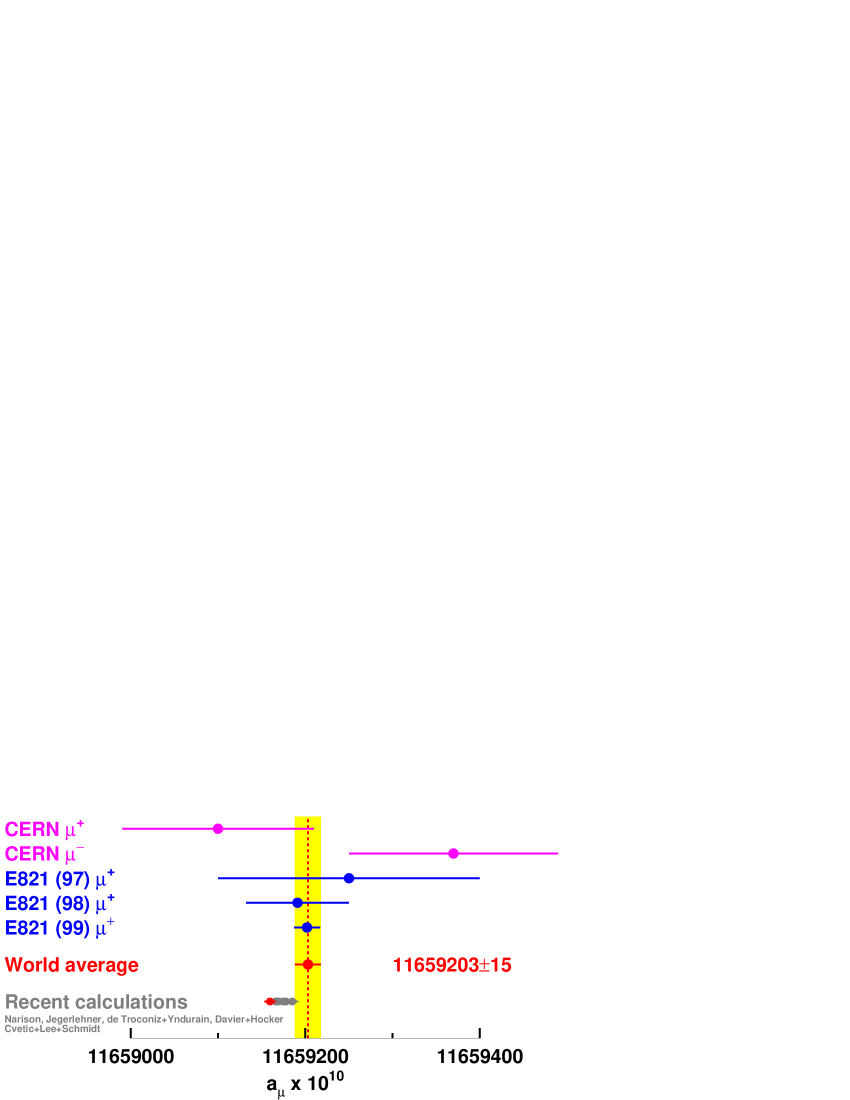
The summed corrections are shown in figure 3 and compared with the new and previous measurements [14]. The major experimental improvement from the new E821 measurement is striking. At the time of publication, the most precise available calculation of led to a difference between data and theory of around 2.6 standard deviations [5]. More recent calculations reduce that difference, in some cases to the one standard deviation level, thus also suggesting that the error on the prediction may have been too optimistic. At present there is therefore no reason to consider as giving evidence of physics beyond the Standard Model. The accuracy of the theoretical predictions will be even more severely challenged by an experimental measurement with a factor two smaller error, as expected in the near future. Theoretical progress is essential to obtain a maximum physics return from such a precise measurement.
4 Recent News from the Z0 Pole
Measurements of the Z0 cross-section, width, and asymmetries have been available for many years from LEP and SLD data, and most results have now been finalised [15, 16]. Recently new results [17] have become available on the b quark forward-backward asymmetry () from ALEPH and DELPHI, using inclusive lifetime-based b-tagging techniques and various quark charge indicators. Substantial improvements are obtained over earlier lifetime-tag measurements, so that this type of asymmetry measurement now has a comparable precision to that using a traditional lepton tag. The lepton and lifetime results are compatible, and together give a LEP average Z pole asymmetry of
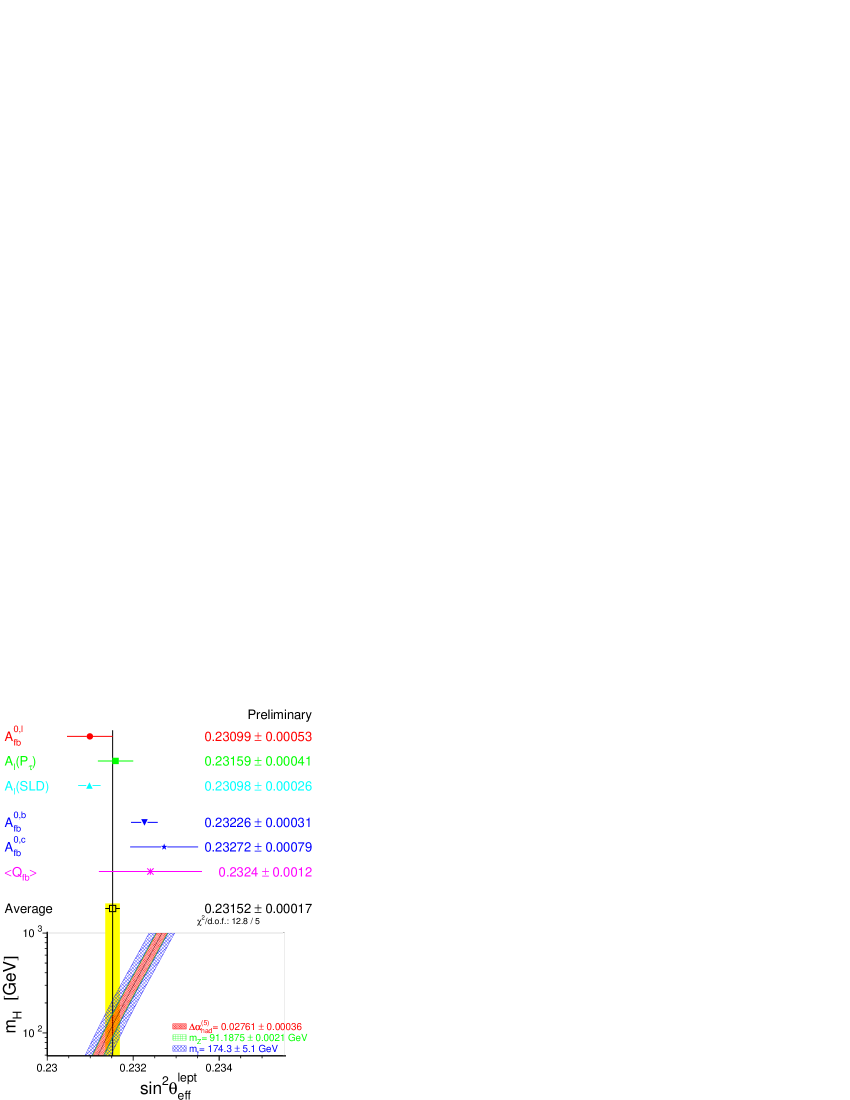
This result may be compared with other asymmetry measurements from LEP and SLD by interpreting in terms of . In doing this, it is effectively assumed that the b quark couplings are given by their Standard Model values. The result is shown in figure 4, comparing to values derived from the leptonic forward-backward asymmetry from LEP () [15]; that from the polarisation measurements () [18]; from the left-right polarisation asymmetry at SLD [16]; from the charm forward-backward asymmetry [19]; and from inclusive hadronic event forward-backward asymmetry measurements () [20]. The two most precise determinations of , from and , differ at the level of 3.2 standard deviations. This might suggest that the b quark couplings to the Z0 differ from the Standard Model expectations, but such an interpretation is not compelling at present, and direct measurements via the left-right polarised forward-backward b quark asymmetry at SLD are not precise enough to help. Future improvements in b quark asymmetry measurements using the existing LEP data samples may help elucidate this issue, but scope for such improvement is limited.
5 LEP-2 and Fermion-Pair Production
| Model | Limit (TeV) |
|---|---|
| 0.678 | |
| 0.463 | |
| 0.436 | |
| LR | 0.800 |
| Sequential | 1.89 |
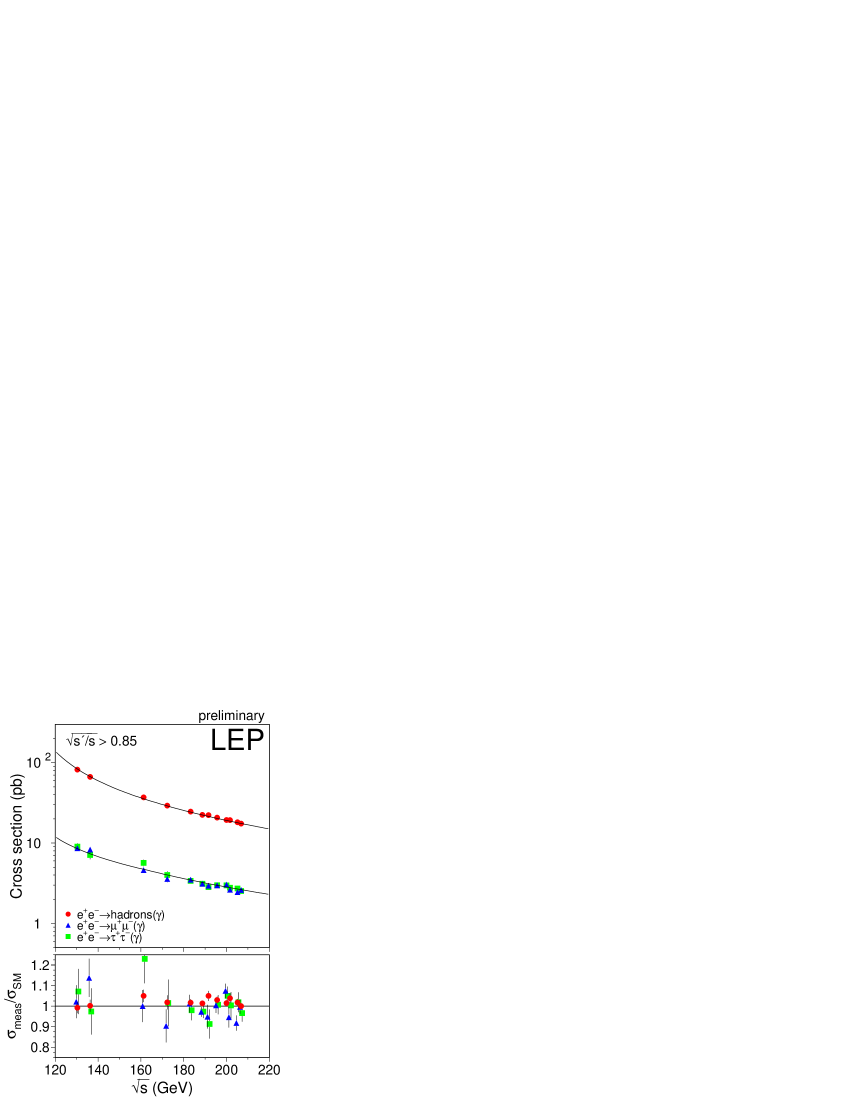
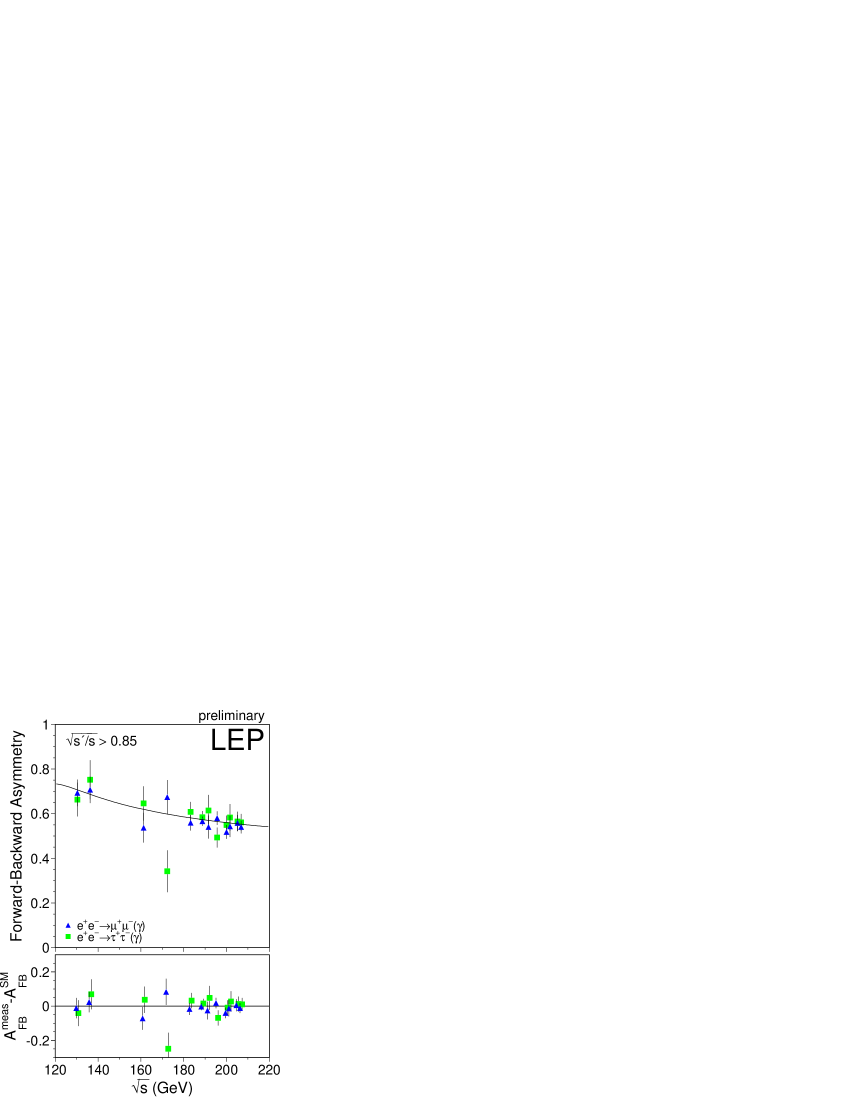
With the completion of LEP-2 data-taking at the end of 2000, the integrated luminosity collected at energies of 161 GeV and above has reached 700 pb-1 per experiment, in total giving each 1 fb-1 from the entire LEP programme. Following on from the measurements of the LEP-1 Z lineshape and forward-backward asymmetries, studies of fermion-pair production have continued at LEP-2. At these higher energies, fermion-pair events may be subdivided into those where the pair invariant mass has “radiatively returned” to the Z region or below, and non-radiative events with close to the full centre-of-mass energy. The cross-sections and forward-backward asymmetries for non-radiative events at the full range of LEP-2 energies are shown in Figures 6 and 6 for hadronic, muon and tau pair final states, averaged between all four LEP experiments [21]. Analogous measurements have been made for electrons, b and c quarks [21]. The Standard Model expectations describe the data well. Limits can be placed on new physics from these data [21]. As an example, limits may be placed on new Z′ bosons which do not mix with the Z0, as indicated in Table 2.
6 Z’s and W’s at Colliders with Hadrons
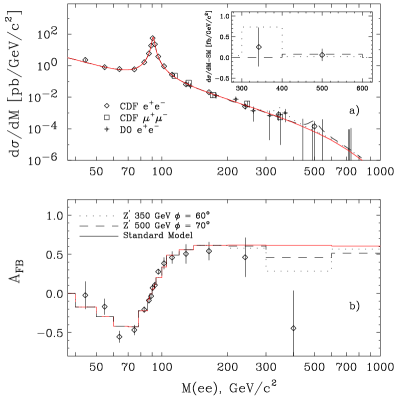
Electroweak fermion-pair production has also been studied at the Tevatron, in the Drell-Yan process. Updated results on high mass electron pairs were presented at this conference [22, 23]: both cross-sections and asymmetries are well described by the Standard Model expectations, and extend beyond the LEP-2 mass reach to around 500 GeV (see Figure 7). As indicated in the figure, there is some sensitivity to new physics models, and improvements on that of LEP should come with the Run 2 data.
| Experiment | Sample | Mass (GeV) |
|---|---|---|
| UA2 | W e | 80.3600.370 |
| CDF | Run 1A | 80.4100.180 |
| CDF | Run 1B | 80.4700.089 |
| D0 | Run 1A | 80.3500.270 |
| D0 | Run 1B | 80.4980.084 |
| All p data | 80.4540.060 | |
W production in p collisions provided, before LEP-2, the only direct measurements of the W mass, using reconstructed electron and muon momenta and inferred missing momentum information. The main results from CDF and D0 from Run 1 data have been available for some time [24]. D0 have recently updated their Run 1 results with a new analysis making use of electrons close to calorimeter cell edges [23]. The main importance of the extra data is to allow a better calorimeter calibration from Z events. Measurements of the W mass from the Tevatron are summarised in Table 3.
The high tail of the distribution of the transverse mass of the lepton-missing momentum system provides information about the W width. CDF finalised their Run 1 result ( 2.05 GeV) [25] some time ago. D0 presented a new measurement using all the Run 1 data, of 2.23 GeV, at this conference [23].
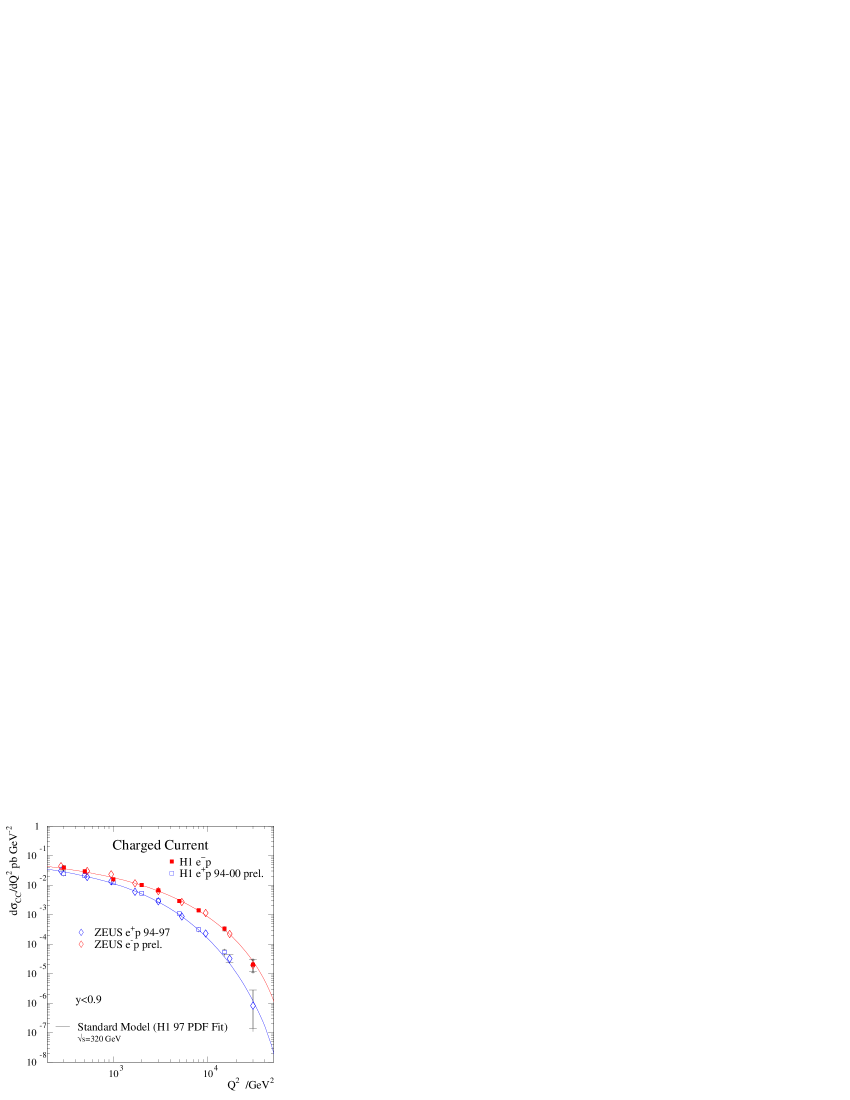
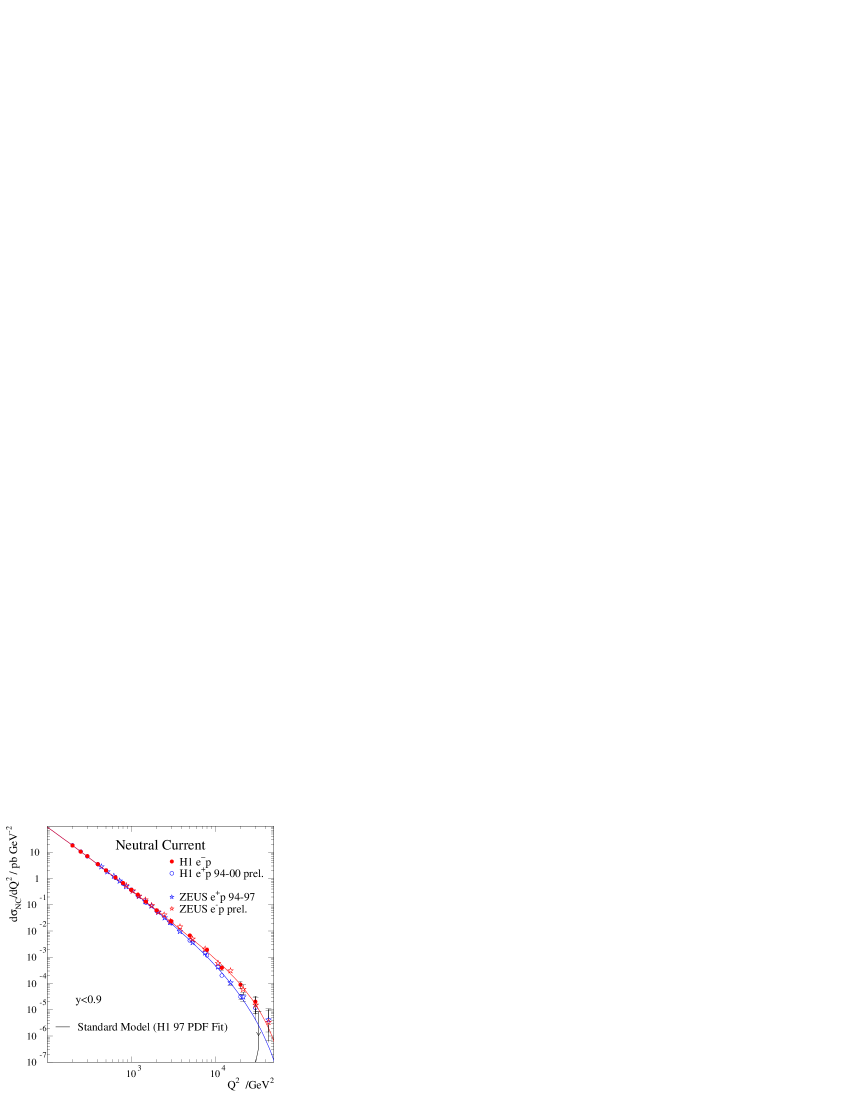
The presence of the W and Z bosons is primarily probed at HERA via t-channel exchange. The charged and neutral current differential cross-sections as a function of are shown in Figures 9 and 9 respectively. The charged current process proceeds only by W exchange, and is sensitive to the W mass via the propagator term (and also, indirectly, via the overall normalisation). The effect of Z0 exchange can be seen in the high- neutral current region where it gives rise to a difference between the e-p and e+p cross-sections.
Real W production may also have been observed at HERA, by looking for events with high transverse momentum electrons or muons, missing transverse momentum, and a recoiling hadronic system. For transverse momenta of the recoiling hadronic system above 40 GeV, H1 and ZEUS together observe 6 events compared to an expectation of 2.00.3, which is 90% composed of W production and decay [28]. These events have been interpreted as possible evidence of new physics, but within the framework of the Standard Model their natural interpretation is as W production.
7 W Physics at LEP-2
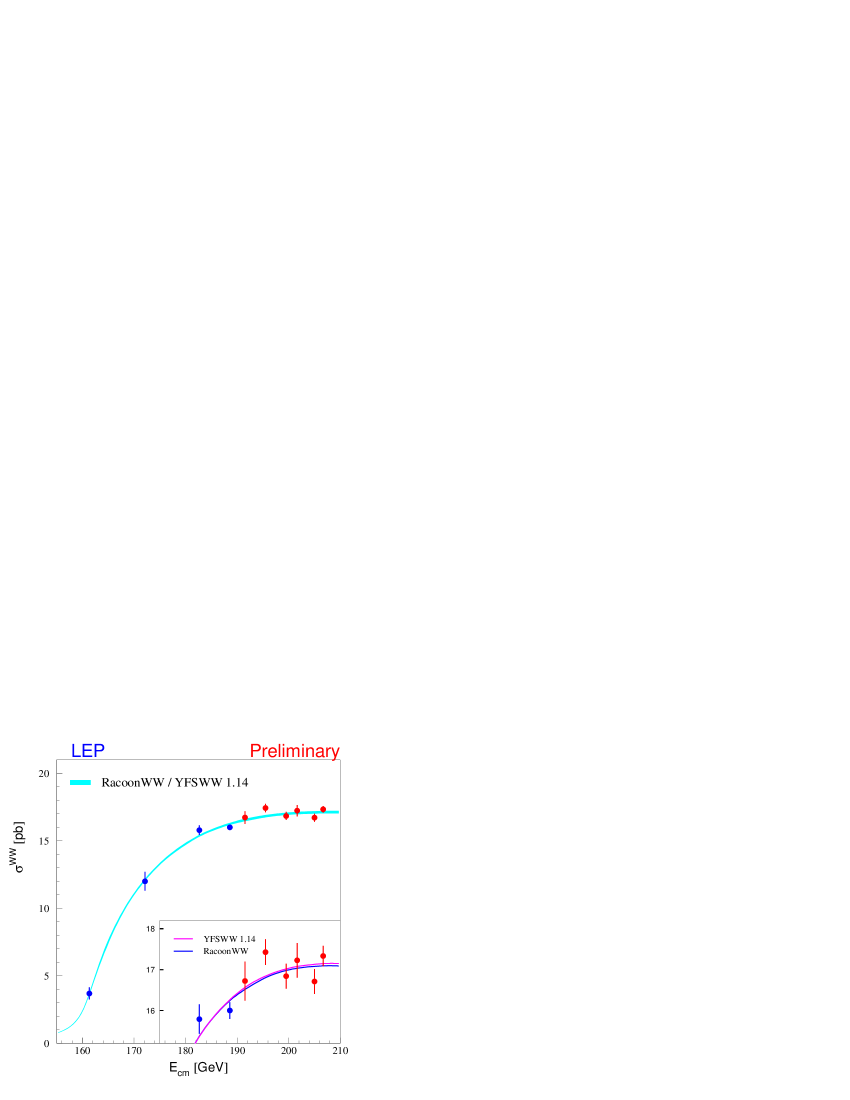
Each LEP experiment now has a sample of around 12000 W-pair events from the full LEP-2 data sample. Event selections are well established, and have needed only minor optimisations for the highest energy data. Typical selection performances give efficiencies and purities in the 80-90% range for almost all channels – channels with decays being the most challenging. The measured W-pair cross-section [29] is shown in Figure 10, and compared to the predictions of the RacoonWW [30] and YFSWW [31] Monte Carlo programs. These programs incorporate full corrections to the doubly-resonant W-pair production diagrams, and give a cross-section approximately 2% lower than earlier predictions. The agreement can be tested by comparing the experimental and predicted cross-sections as a function of centre-of-mass energy. The new calculations describe the normalisation of the data well, the old ones over-estimate it by between two and three standard deviations of the experimental error [29].
The selected W-pair events are also used to measure the W decay branching ratios. The combined LEP results [29] are shown in Table 5. The leptonic results are consistent with lepton universality, and so are combined to measure the average leptonic branching ratio, corrected to massless charged leptons. This measurement now has a better than 1% relative error, and is consistent with the Standard Model expectation of 10.83%. It is significantly more precise than a value extracted from the Tevatron W and Z cross-section data, assuming Standard Model production of W’s, which is Br(W% [32].
| Decay mode | Branching ratio (%) |
|---|---|
| W e | 10.540.17 |
| W | 10.540.16 |
| W | 11.090.22 |
| W | 10.690.09 |
| W hadrons | 67.920.27 |
| Sample | W Mass (GeV) |
|---|---|
| ALEPH (1997-2000) | 80.4770.0380.032 |
| DELPHI (1997-2000) | 80.3990.0450.049 |
| L3 (1997-2000) | 80.3890.0480.051 |
| OPAL (1997-1999) | 80.4910.0530.038 |
| 80.4480.0330.028 | |
| 80.4570.0300.054 | |
| From (161 GeV) | 80.400.21 |
| LEP combined | 80.4500.039 |
The W mass and width are measured above the W-pair threshold at LEP-2 by direct reconstruction of the W decay products [33], using measured lepton momenta and jet momenta and energies. Events with two hadronically decaying W’s (“”), or where one W decays hadronically and the other leptonically (“”), are used by all experiments. A kinematic fit is made to the reconstructed event quantities, constraining the total energy and momentum to be that of the colliding beam particles, thus reconstructing the unobserved neutrino in mixed hadronic-leptonic decay events. This fit significantly improves the resolution on the W mass. The reconstructed mass distributions can be fitted to obtain the W mass, or the W mass and width together. Other, more complicated, techniques to extract the most W mass information from the fitted events are used by some experiments. ALEPH and OPAL also use the small amount of information contained in events, which has been included in the results quoted.
After the kinematic fit, the W mass statistical sensitivity is very similar for the two event types. The systematic error sources are largely different between the two channels: the main correlated systematics come from the knowledge of the LEP beam energy, and hadronisation modelling. The W mass measurements obtained by the four LEP experiments, and averaged by channel, are shown in table 5. There is good consistency between all the measurements, and the overall precision [34] now improves significantly on the 60 MeV from hadron colliders. If the W width is also fitted, the W mass measurement is essentially unchanged, and a LEP combined value of GeV is found.
The 39 MeV error on the combined LEP result includes 26 MeV statistical and 30 MeV systematic contributions. Systematic errors are larger in the channel (see Table 5), having the effect of deweighting that channel, to just 27%, in the average. With no systematic errors this deweighting would not occur, and the statistical error would be 22 MeV. The main systematic errors on the combined result are as follows [34]: The LEP beam energy measurement contributes a highly correlated 17 MeV to all channels; hadronisation modelling uncertainties contribute another 17 MeV; “final-state interactions” (FSI) between the hadronic decay products of two W’s contribute 13 MeV; detector-related uncertainties – different for the different experiments – contribute 10 MeV; and uncertainties on photonic corrections contribute 8 MeV. The main improvements that are expected before the results are finalised lie in the areas of the LEP beam energy, where a concerted programme is in progress to reduce the error, and the final-state interactions.
The basic physical problem which gives rise to the uncertainty over final-state interactions is that when two W’s in the same event both decay hadronically, the decay distance is smaller than typical hadronisation scales. The hadronisation of the two systems may therefore not be independent, and so hadronisation models tuned to Z0 decays may not properly describe them. Phenomenological models are used to study possible effects, subdividing them into “colour reconnection” in the parton-shower phase of the Monte Carlo models, and possible Bose-Einstein correlations between identical particles formed in the hadronisation process.
A substantial effort has been spent in understanding the possible effects of FSI models. Recent work, in a collaborative effort between all four LEP experiments, has focused on determining the common sensitivity to different models between different experiments, and on developing ways to measure visible effects predicted by the models.
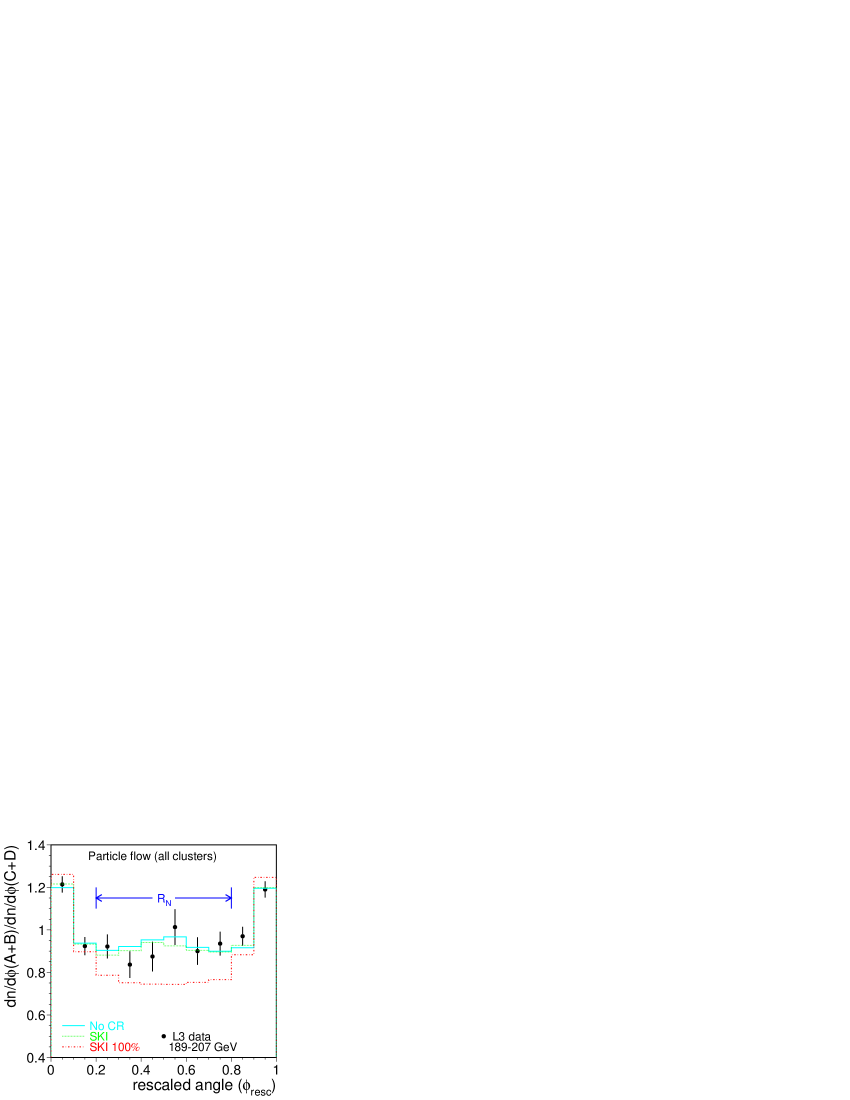
Sensitivity to the effect of colour reconnection models has been obtained by studying the particle flow between jets in events [36]. This is illustrated in Figure 12. The data show some sensitivity to the effects as predicted in the colour reconnection models, and work continues to combine results from the four LEP experiments to improve the sensitivity.
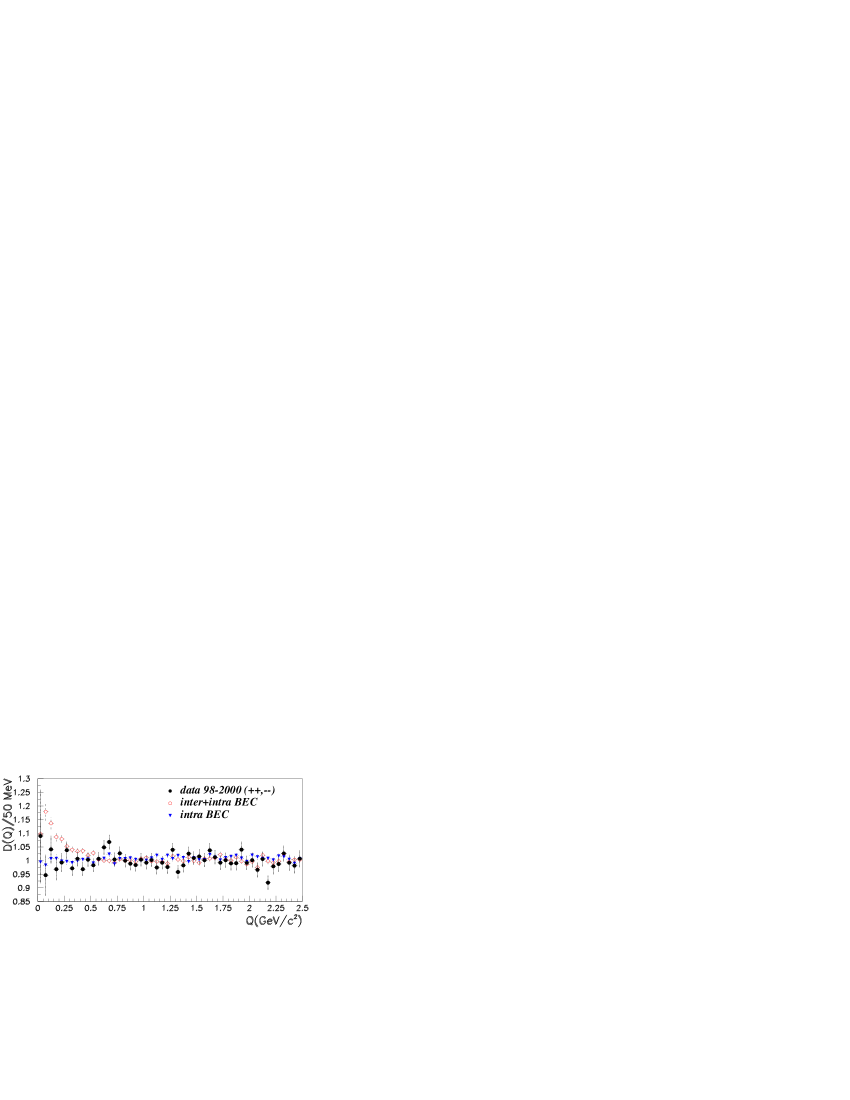
Bose-Einstein correlations are also being studied in data [38], in this case by comparing the two-particle correlation functions, , for single hadronically decaying W’s in events (), and for events (). This may be expressed as [39]:
where is evaluated from mixing hadronic W decays from decays, and is any extra part arising from correlations between particles from different W decays in events. Alternatively the ratio may be examined:
An observed distribution is shown in Figure 12: a deviation from unity at low would most clearly signal the effect of Bose-Einstein correlations between particles from different W’s. As illustrated in this figure, no evidence is observed of such an effect. As for colour reconnection, work is in progress to derive combined LEP results in order better to constrain the possible effect on the W mass measurement.
8 Tests of the Gauge Couplings of Vector Bosons
The gauge group of the Standard Model dictates the self-couplings of the vector bosons, both in form and strength. The direct measurement of these couplings therefore provides a fundamental test of the Standard Model gauge structure. Electroweak gauge couplings have been measured directly at both LEP and the Tevatron: at present constraints from LEP are more stringent.
W-pair production at LEP-2 involves the triple gauge coupling vertex in two of the three lowest-order doubly-resonant diagrams. Sensitivity to possible anomalous couplings is found in the W-pair cross-section, and the W production and decay angle distributions. Measurements have been reported at previous conferences [40], but no combined LEP results have been released recently because [30, 41] higher-order corrections, previously neglected, are thought to be comparable to the current experimental precision [42].
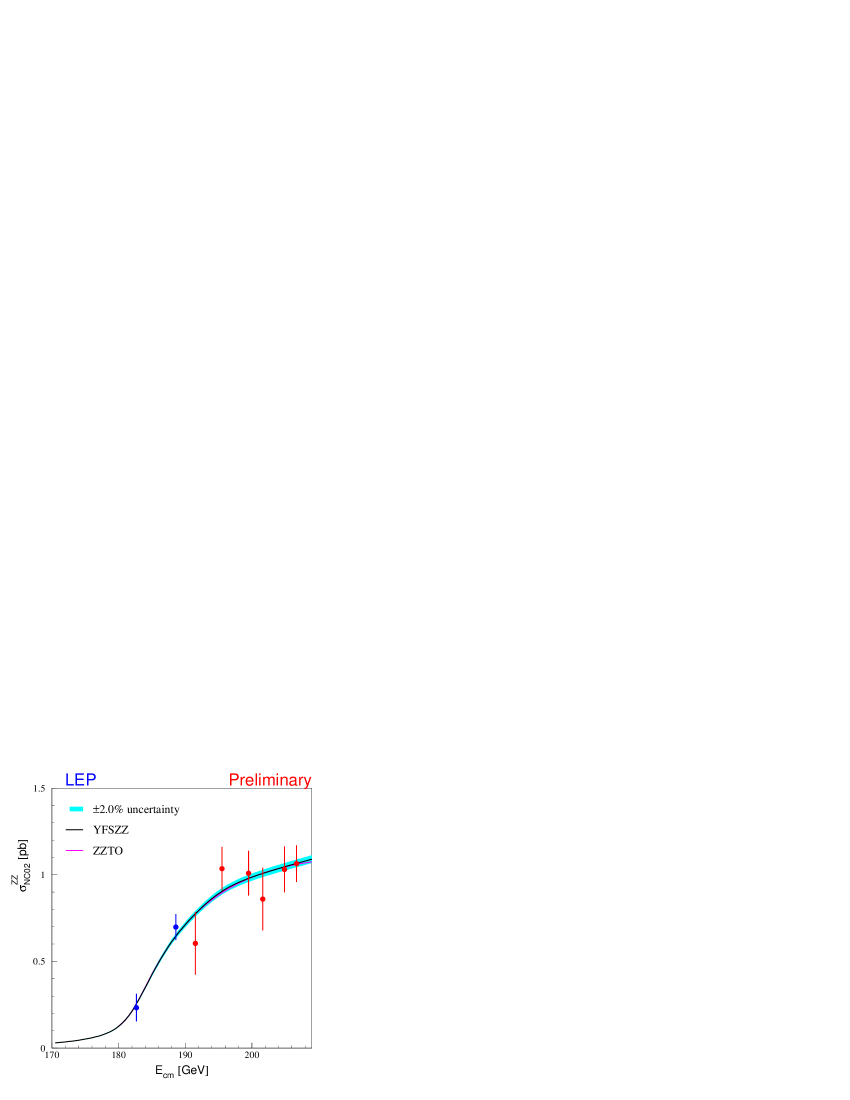
Other measurements of triple gauge boson couplings are made at LEP-2 [45] in the neutral vector boson processes of Z0 and Z0Z0 production. The cross-section measured for the latter process is shown in Figure 13 and is well-described by Standard Model predictions. Measurements of quartic gauge couplings have also been made at LEP-2, and were discussed in detail in other contributions to this conference [46].
9 Global Electroweak Tests
Many of the individual results reported in preceding sections may be used together to provide a global test of consistency with the Standard Model. If consistency with the model is observed, it is justifiable to go on to deduce, in the framework of the Standard Model, the unknown remaining parameter, the mass of the Higgs boson, . The LEP electroweak working group has, for a number of years, carried out such global tests via a combined fit to a large number of measurements sensitive to Standard Model parameters. These results are reported here for the data available at this conference. These global fits use the electroweak libraries ZFITTER version 6.36 [47] and TOPAZ0 version 4.4 [48] to provide the Standard Model predictions. Theoretical uncertainties are included following detailed studies of missing higher order electroweak corrections and their interplay with QCD corrections [49]. The precise LEP, SLD and Tevatron electroweak data are included, as are as measured in neutrino-nucleon (“N”) scattering111A new N scattering result was reported by the NuTeV Collaboration [51] during the final stage of preparation of this contribution. The result obtained differs from the expected value by three standard deviations. [50] and, new this year, atomic parity violation (“APV”) measurements in caesium [52].
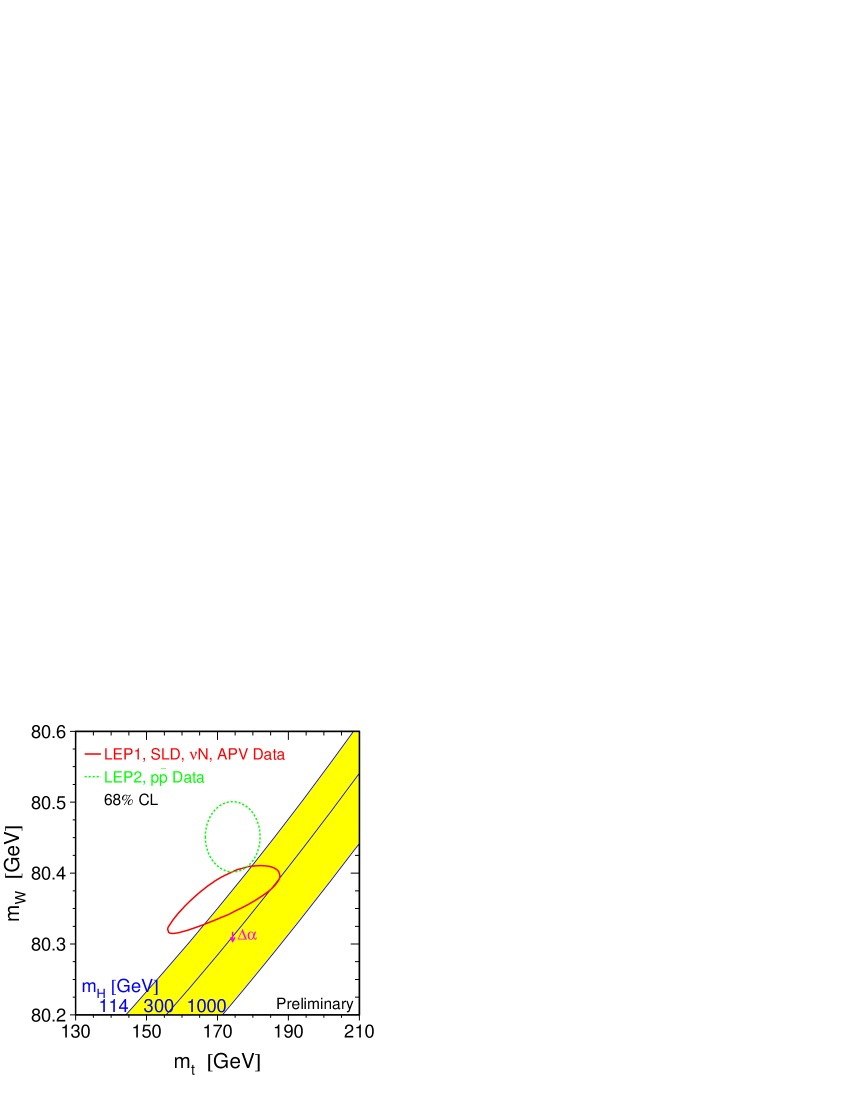
Before making the full fit, the precise electroweak data from LEP and SLD can be used together with , the N and APV results to predict the masses of the top quark, , and of the W, . The result obtained is shown in Figure 14 by the solid (red) contour. Also shown are the direct measurements (dotted/green contour) of GeV from the Tevatron [53] and GeV obtained by combining LEP and p results; and the expected relationship between and in the Standard Model for different (shaded/yellow). It can be seen that the precise input data predict values of and consistent with those observed – in both cases within two standard deviations – demonstrating that the electroweak corrections can correctly predict the mass of heavy particles. For the W, the precision of the prediction via the Standard Model fit is similar to that of the direct measurement. For the top mass, the measurement is twice as precise as the prediction. It is observed in addition that both the precise input data and the direct / measurements favour a light Higgs boson rather than a heavy one.
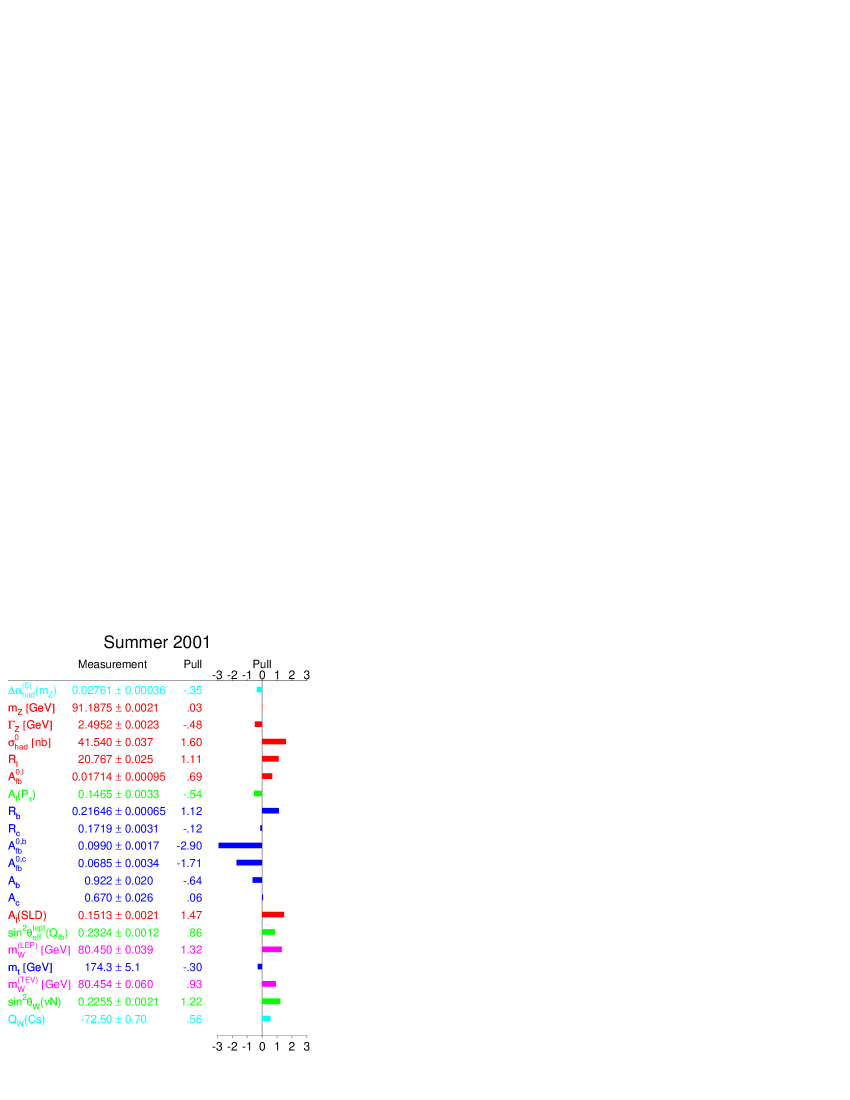
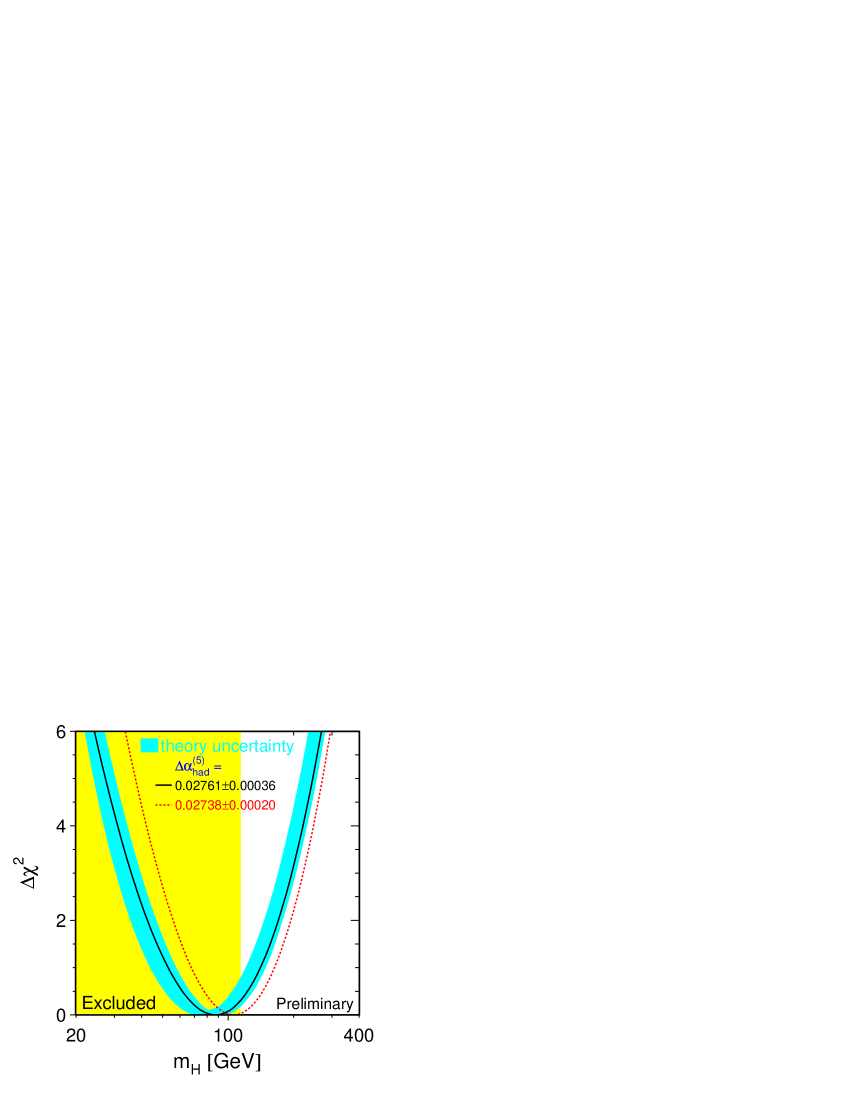
Going further, the full fit is made including also the and measurements. The overall of the fit is 22.9 for 15 degrees of freedom, corresponding to an 8.6% probability. To provide an impression of the contributions to this , the best-fit value of each input datum is compared with the actual measurement, and the pull calculated as the difference between observation and best-fit divided by the measurement error. The results are shown in Figure 15. The poorest description is of , which is a reflection of the same disagreement discussed earlier in Section 4. The best fit value of the Higgs mass is GeV, where the error is asymmetric because the leading corrections depend on . The variation above the minimum value of the as a function of the mass of the Higgs boson, , is shown in Figure 16. The darker shaded/blue band enclosing the curve provides an estimate of the theoretical uncertainty on the shape of the curve. This band is a little broader than previously estimated because of the inclusion of a new higher-order (fermionic two-loop) calculation of [54]. This has little effect via but does have an impact via . This latter effect is controversial, and may well overestimate the true theoretical uncertainty, but it is currently included as equivalent two-loop calculations for Z widths and the effective mixing angle are not available. The curve may be used to derive a constraint on the Standard Model Higgs boson mass, namely GeV at 95% C.L. Also shown in the Figure is the effect of using an alternative theory-driven estimate of the hadronic corrections to [4] (dashed curve). The effect on the prediction is sizable compared to the theoretical uncertainty, for example. The 95% C.L. upper limit on moves to 222 GeV with this estimate.
10 A Forward Look, and Conclusions
The eleven years of data-taking by the LEP experiments, plus the contributions of SLD, have established that Standard Model radiative corrections describe precision electroweak measurements. Data analysis is close to complete on the LEP-1 data, taken from 1989-1995. Work continues to finish LEP-2 analyses, and final results can be expected over the next couple of years. Improvements can still be expected in the W mass measurement, from better understanding of final-state interaction effects in particular, and in gauge-coupling measurements where the full data sample is not yet included.
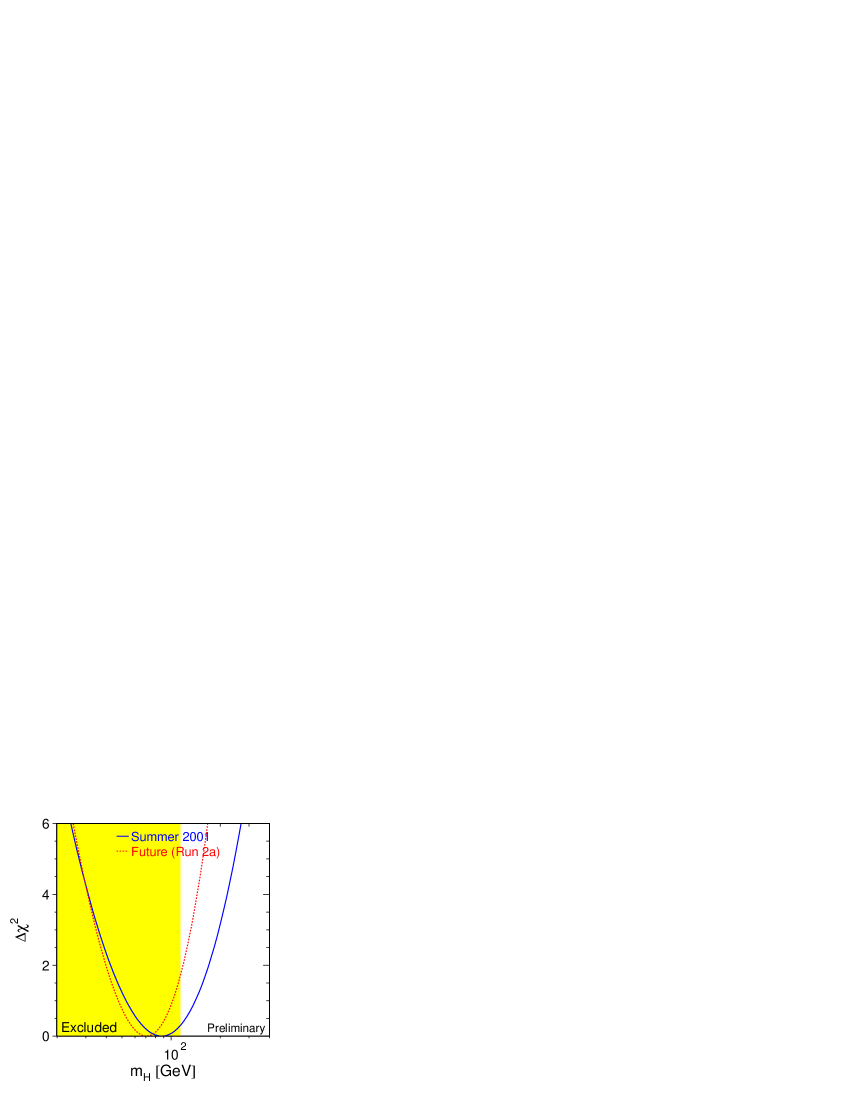
At the Tevatron, Run 2 data-taking has recently begun. Although luminosities are so far low, the expectation remains of accumulating 2 fb-1 in the next couple of years, which should allow a W mass measurement with 30 MeV precision from each experiment [55], and a top mass measured to 3 GeV. Combining the former result with the final results from LEP-2 should provide a world average W mass measurement error close to 20 MeV. The effect such improvements could have, for example on the global fit as a function of , are shown in Figure 17 (the central value of employed for the future is, of course, arbitrarily selected).
Further substantial improvements in precision will have to wait for the LHC and a future linear collider. The LHC should improve the W and top mass precisions by a further factor two. The main improvement would, of course, come from a discovery of the Higgs boson, and a direct indication of whether it is the simplest Standard Model particle.
In summary, precise tests of the electroweak sector of the Standard Model have been made by a wide range of experiments, from the g-2 measurement in muon decays to LEP and the Tevatron. Many of these tests have a high sensitivity to radiative corrections, and the radiative correction structure is now rather well-established. Two and three-loop calculations are essential in making sufficiently precise predictions for some processes, and more progress is still needed. A small number of measurements, for example the measurement of from the b forward-backward asymmetry at LEP, show two or three standard deviation differences from expectation which might point to possible cracks in the Standard Model description, but none are compelling at present. Further improvements in the quality of tests will arrive slowly over the next few years: in particular further elucidation of the electroweak symmetry-breaking mechanism will likely have to await an improved discovery reach for a Higgs boson.
Acknowledgments
The preparation of this talk was greatly eased by the work of the LEP electroweak working group, and cross-LEP working groups on the W mass, gauge coupling and fermion-pair measurements. In particular, I thank Martin Grünewald for his unstinting help, and Chris Hawkes for comments on this manuscript. I also benefitted from the assistance of P. Antilogus, E. Barberio, A. Bodek, D. Cavalli, G. Chiarelli, G. Cvetic, Y.S. Chung, M. Elsing, C. Gerber, F. Gianotti, R. Hawkings, G.S. Hi, J. Holt, F. Jegerlehner, M. Kuze, I. Logashenko, K. Long, W. Menges, K. Mönig, A. Moutoussi, C. Parkes, B. Pietrzyk, R. Tenchini, J. Timmermans, A. Valassi, W. Venus, H. Voss, P. Wells, F. Yndurain and Z.G. Zhao.
References
- [1] J.Z. Bai et al., BES Collaboration, hep-ex/0102003; J.C. Chen, these proceedings.
- [2] See, for example, R.R. Akhmetshin et al., CMD-2 Collaboration, Nucl. Phys. A 675 (2000) 424c.
- [3] H. Burkhardt and B. Pietrzyk, preprint LAPP-EXP 2001-03, to appear in Physics Letters.
- [4] A.D. Martin, J. Outhwaite and M.G. Ryskin, Phys. Lett. B 492 (2000) 69.
- [5] H.N. Brown et al., Muon g-2 Collaboration, Phys. Rev. Lett. 86 (2001) 2227; I. Logashenko, these proceedings.
- [6] D.H. Brown and W.A. Worstell, Phys. Rev. D 54 (1996) 3237.
- [7] R. Alemany, M. Davier and A. Höcker, Eur. Phys. J. C 2 (1998) 123.
- [8] M. Davier and A. Höcker, Phys. Lett. B 419 (1998) 419.
- [9] M. Davier and A. Höcker, Phys. Lett. B 435 (1998) 427.
- [10] S. Narison, Phys. Lett. B 513 (2001) 53.
- [11] F. Jegerlehner, hep-ph/0104304.
- [12] J.F. de Troconiz and F.J. Yndurain, hep-ph/0106025.
- [13] G. Cvetic, T. Lee and I. Schmidt, hep-ph/0107069.
-
[14]
J. Bailey et al.., Nucl. Phys. B 150 (1979) 1;
R.M. Carey et al., Muon g-2 Collaboration, Phys. Rev. Lett. 82 (1999) 1632; H.N. Brown et al., Muon g-2 Collaboration, Phys. Rev. D 62 (2000) 091101. -
[15]
R. Barate et al., ALEPH Collaboration,
Eur. Phys. J. C 14 (2000) 1;
P. Abreu et al., DELPHI Collaboration, Eur. Phys. J. C 16 (2000) 371;
M. Acciarri et al., L3 Collaboration, Eur. Phys. J. C 16 (2000) 1;
G. Abbiendi et al., OPAL Collaboration, Eur. Phys. J. C 19 (2001) 587;
M. Paganoni, these proceedings. - [16] K. Abe et al., SLD Collaboration, Phys. Rev. Lett. 84 (2000) 5945; K. Abe et al., SLD Collaboration, Phys. Rev. Lett. 86 (2001) 1162; V. Serbo, these proceedings.
-
[17]
ALEPH Collaboration, ALEPH 2001-026 CONF
2001-020;
DELPHI Collaboration, DELPHI 2001-027 CONF 468;
P. Hansen, these proceedings. -
[18]
D. Buskulic et al., ALEPH Collaboration,
Z. Physik C 69 (1996) 183; ALEPH Collaboration, ALEPH 96-097 CONF
98-037;
P. Abreu et al., DELPHI Collaboration, Eur. Phys. J. C 14 (2000) 585;
M. Acciarri et al., L3 Collaboration, Phys. Lett. B 429 (1998) 387;
G. Abbiendi et al., OPAL Collaboration, Eur. Phys. J. C 21 (2001) 1;
M. Casado, these proceedings. - [19] See, for example, P. Hansen, these proceedings.
-
[20]
D. Buskulic et al., ALEPH Collaboration,
Z. Physik C 71 (1996) 357;
P. Abreu et al., DELPHI Collaboration, Phys. Lett. B 277 (1992) 371;
M. Acciarri et al., L3 Collaboration, Phys. Lett. B 439 (1998) 225;
P.D. Acton et al., OPAL Collaboration, Phys. Lett. B 294 (1992) 436. - [21] J Holt, these proceedings; LEPEWWG f subgroup, note LEP2FF/01-02.
- [22] T. Affolder et al., CDF Collaboration, Phys. Rev. Lett. 87 (2001) 131802.
- [23] C. Gerber, these proceedings.
-
[24]
T. Affolder et al., CDF Collaboration,
Phys. Rev. D 64 (2001) 052001;
S. Abachi et al., D0 Collaboration, Phys. Rev. Lett. 84 (2000) 222. - [25] T. Affolder et al., CDF Collaboration, Phys. Rev. Lett. 85 (2000) 3347.
-
[26]
C. Adloff et al., H1 Collaboration,
Eur. Phys. J. C 19 (2001) 269; H1 Collaboration, paper
EPS-2001-787 submitted to this conference;
ZEUS Collaboration, papers EPS-2001-631 and EPS-2001-633 submitted to this conference. -
[27]
C. Adloff et al., H1 Collaboration,
Eur. Phys. J. C 19 (2001) 269; H1 Collaboration, paper
EPS-2001-787 submitted to this conference;
ZEUS Collaboration, papers EPS-2001-630 and EPS-2001-632 submitted to this conference. - [28] H1 Collaboration, paper EPS-2001-802 submitted to this conference.
- [29] The LEP Collaborations and the LEP WW Working Group, note LEPEWWG/XSEC/2001-03; R. Chierici, these proceedings.
- [30] A. Denner, S. Dittmaier, M. Roth and D. Wackeroth, Nucl. Phys. B 587 (2000) 67; M. Roth, these proceedings.
- [31] S. Jadach et al., Comput. Phys. Commun. 140 (2001) 432.
- [32] S. Eno et al., note CDF/ANAL/ELECTROWEAK/CDFR/5139, D0note 3693.
-
[33]
ALEPH Collaboration, ALEPH 2001-020 CONF
2001-017;
DELPHI Collaboration, DELPHI 2001-103 CONF 531;
L3 Collaboration, L3 Note 2637;
OPAL Collaboration, OPAL Physics Notes PN422 and PN480;
H. Ruiz, these proceedings. - [34] The LEP Collaborations and the LEP W Working Group, note LEPEWWG/MASS/2001-02; H. Ruiz, these proceedings.
- [35] L3 Collaboration, L3 Note 2683.
- [36] D. Duchesneau, these proceedings.
- [37] DELPHI Collaboration, DELPHI 2001-060 CONF 488.
- [38] O. Pooth, these proceedings.
- [39] S.V. Chekanov, E.A. de Wolf and W. Kittel, Eur. Phys. J. C 6 (1999) 403.
- [40] See, for example, S. Jezequel, in 30th International Conference on High Energy Physics, Ed. by C. Lim and T. Yamanaka.
- [41] S. Jadach et al., Comput. Phys. Commun. 140 (2001) 475.
- [42] S. Villa, these proceedings.
- [43] The LEP Collaborations and the LEP WW Working Group, note LEPEWWG/XSEC/2001-03; H. Rick, these proceedings.
-
[44]
S. Jadach, W. Placzek and B.F.L. Ward,
Phys. Rev. D 56 (1997) 6939;
G. Passarino, in hep-ph/0005309. - [45] A. Oh, these proceedings.
- [46] F. Piccinini, these proceedings; M. Biglietti, these proceedings.
- [47] D.Y. Bardin et al.. Comput. Phys. Commun. 133 (2001) 229.
- [48] G. Montagna et al., Comput. Phys. Commun. 117 (1999) 278.
- [49] CERN Yellow Report 95-03, eds. D. Bardin, W. Hollik and G. Passarino; D. Bardin, M. Grünewald and G. Passarino, hep-ph/9902452.
- [50] K. McFarland et al., CCFR/NuTeV Collaboration, Eur. Phys. J. C 1 (1998) 509; K. McFarland for the NuTeV Collaboration, hep-ex/9806013.
- [51] G.P. Zeller et al., hep-ex/0110059.
-
[52]
C.S. Wood et al.,
Science 275 (1997) 1759;
S.C. Bennett and C.E. Wieman, Phys. Rev. Lett. 82 (1999) 2484;
A. Derevianko, Phys. Rev. Lett. 85 (2000) 1618;
M.G. Kozlov, S.G. Porsev and I.I. Tupitsyn,Phys. Rev. Lett. 86 (2001) 3260. - [53] L. Demortier et al., The Top Averaging Group for the CDF and D0 Collaborations, preprint FERMILAB-TM-2084.
- [54] A. Freitas, W. Hollik, W. Walter, G. Weiglein, Phys. Lett. B 495 (2000) 338.
- [55] See, for example, G. Chiarelli, these proceedings.