A combined analysis technique for the
search for fast magnetic monopoles with the MACRO detector
Abstract
We describe a search method for fast moving () magnetic monopoles using simultaneously the scintillator, streamer tube and track-etch subdetectors of the MACRO apparatus. The first two subdetectors are used primarily for the identification of candidates while the track-etch one is used as the final tool for their rejection or confirmation. Using this technique, a first sample of more than two years of data has been analyzed without any evidence of a magnetic monopole. We set a CL upper limit to the local monopole flux of in the velocity range and for nucleon decay catalysis cross section smaller than .
The MACRO Collaboration
M. Ambrosio12, R. Antolini7, G. Auriemma14,a, D. Bakari2,17, A. Baldini13, G. C. Barbarino12, B. C. Barish4, G. Battistoni6,b, Y. Becherini2, R. Bellotti1, C. Bemporad13, P. Bernardini10, H. Bilokon6, C. Bloise6, C. Bower8, M. Brigida1, S. Bussino18, F. Cafagna1, M. Calicchio1, D. Campana12, M. Carboni6, R. Caruso9, S. Cecchini2,c, F. Cei13, V. Chiarella6, B. C. Choudhary4, S. Coutu11,i, G. De Cataldo1, H. Dekhissi2,17, C. De Marzo1, I. De Mitri10, J. Derkaoui2,17, M. De Vincenzi18, A. Di Credico7, O. Erriquez1, C. Favuzzi1, C. Forti6, P. Fusco1, G. Giacomelli2, G. Giannini13,d, N. Giglietto1, M. Giorgini2, M. Grassi13, A. Grillo7, F. Guarino12, C. Gustavino7, A. Habig3,p, R. Heinz8, E. Iarocci6,e, E. Katsavounidis4,q, I. Katsavounidis4,r, E. Kearns3, H. Kim4, S. Kyriazopoulou4, E. Lamanna14,l, C. Lane5, D. S. Levin11, P. Lipari14, N. P. Longley4,h, M. J. Longo11, F. Loparco1, F. Maaroufi2,17, G. Mancarella10, G. Mandrioli2, S. Manzoor2,n, A. Margiotta2, A. Marini6, D. Martello10, A. Marzari-Chiesa16, M. N. Mazziotta1, D. G. Michael4, P. Monacelli9, T. Montaruli1, M. Monteno16, S. Mufson8, J. Musser8, D. Nicolò13, R. Nolty4, C. Orth3, G. Osteria12, O. Palamara7, V. Patera6,e, L. Patrizii2, R. Pazzi13, C. W. Peck4, L. Perrone10, S. Petrera9, V. Popa2,g, J. Reynoldson7, F. Ronga6, A. Rrhioua2,17, C. Satriano14,a, E. Scapparone7, K. Scholberg3,q, A. Sciubba6,e, P. Serra2, M. Sioli2, G. Sirri2, M. Sitta16,o, P. Spinelli1, M. Spinetti6, M. Spurio2, R. Steinberg5, J. L. Stone3, L. R. Sulak3, A. Surdo10, G. Tarlè11, V. Togo2, M. Vakili15,s, C. W. Walter3 and R. Webb15.
1. Dipartimento di Fisica dell’Università di Bari and INFN, 70126 Bari, Italy
2. Dipartimento di Fisica dell’Università di Bologna and INFN, 40126 Bologna, Italy
3. Physics Department, Boston University, Boston, MA 02215, USA
4. California Institute of Technology, Pasadena, CA 91125, USA
5. Department of Physics, Drexel University, Philadelphia, PA 19104, USA
6. Laboratori Nazionali di Frascati dell’INFN, 00044 Frascati (Roma), Italy
7. Laboratori Nazionali del Gran Sasso dell’INFN, 67010 Assergi (L’Aquila), Italy
8. Depts. of Physics and of Astronomy, Indiana University, Bloomington, IN 47405, USA
9. Dipartimento di Fisica dell’Università dell’Aquila and INFN, 67100 L’Aquila, Italy
10. Dipartimento di Fisica dell’Università di Lecce and INFN, 73100 Lecce, Italy
11. Department of Physics, University of Michigan, Ann Arbor, MI 48109, USA
12. Dipartimento di Fisica dell’Università di Napoli and INFN, 80125 Napoli, Italy
13. Dipartimento di Fisica dell’Università di Pisa and INFN, 56010 Pisa, Italy
14. Dipartimento di Fisica dell’Università di Roma ”La Sapienza” and INFN, 00185 Roma, Italy
15. Physics Department, Texas A&M University, College Station, TX 77843, USA
16. Dipartimento di Fisica Sperimentale dell’Università di Torino and INFN, 10125 Torino, Italy
17. L.P.T.P, Faculty of Sciences, University Mohamed I, B.P. 524 Oujda, Morocco
18. Dipartimento di Fisica dell’Università di Roma Tre and INFN Sezione Roma Tre, 00146 Roma, Italy
Also Università della Basilicata, 85100 Potenza, Italy
Also INFN Milano, 20133 Milano, Italy
Also Istituto TESRE/CNR, 40129 Bologna, Italy
Also Università di Trieste and INFN, 34100 Trieste, Italy
Also Dipartimento di Energetica, Università di Roma, 00185 Roma, Italy
Also Institute for Nuclear Research, Russian Academy of Science, 117312 Moscow, Russia
Also Institute for Space Sciences, 76900 Bucharest, Romania
Macalester College, Dept. of Physics and Astr., St. Paul, MN 55105
Also Department of Physics, Pennsylvania State University, University Park, PA 16801, USA
Also Dipartimento di Fisica dell’Università della Calabria, Rende (Cosenza), Italy
Also Department of Physics, James Madison University, Harrisonburg, VA 22807, USA
Also RPD, PINSTECH, P.O. Nilore, Islamabad, Pakistan
Also Dipartimento di Scienze e Tecnologie Avanzate, Università del Piemonte Orientale, Alessandria, Italy
Also U. Minn. Duluth Physics Dept., Duluth, MN 55812
Also Dept. of Physics, MIT, Cambridge, MA 02139
Also Intervideo Inc., Torrance CA 90505 USA
Also Resonance Photonics, Markham, Ontario, Canada
1 Introduction
Within the framework of Grand Unified Theories (GUT), supermassive magnetic monopoles (GeV) would have been produced in the early Universe as intrinsically stable topological defects when the symmetry of the unified fundamental interactions was spontaneously broken [1]. At our epoch they should be searched for in the cosmic radiation as remnants of primordial phase transition(s). The velocity range in which GUT monopoles should be sought spreads over several decades [2]. If sufficiently heavy (GeV), GUT monopoles will be gravitationally bound to the galaxy with a velocity distribution peaked at . Lighter monopoles (GeV) would be accelerated in one or more regions of coherent galactic magnetic field up to velocities of while other acceleration mechanisms (e.g. in the neighborhood of a neutron star) could bring them to relativistic velocities.
MACRO was a multipurpose underground detector (located in the Hall B of the Laboratori Nazionali del Gran Sasso, Italy) optimized for the search for GUT monopoles with velocity and with a sensitivity below the Parker bound (i.e. cm-2s-1sr-1 [1, 2]). The apparatus was arranged in a modular structure with overall dimensions of m3 and was made up by three subdetectors: liquid scintillation counters, limited streamer tubes and nuclear track detectors (CR39 and Lexan) [3].
In this work we describe an analysis technique which uses all of the MACRO subdetectors simultaneously in the search for fast moving magnetic monopoles (i.e. ) in the cosmic radiation. The results on a first data sample is also reported. The analysis procedure uses the data coming from the scintillator and the streamer tube subdetectors to identify candidate events. This is done by reconstructing the energy release (using scintillators’ Energy Reconstruction Processor –ERP– as well as streamer tubes’ Charge and Time Processor, QTP) and the particle’s trajectory (using the streamer tubes’ digital hit information). The selected tracks are then searched for in the track-etch layers as a final tool for their rejection or confirmation.
Since the three techniques are independent and complementary, we obtain a good rejection power against the background due to high energy muons and a high reliability of the possible candidates. In the following sections we will describe the signatures of a fast monopole in the MACRO detector and the analysis procedures. Analysis efficiencies and acceptance evaluations will then be given together with the results of a search performed on a first sample of more than two years of data.
2 Fast monopole signatures in MACRO
A complete description of the MACRO detector, with particular emphasis on magnetic monopole detection techniques, has been given elsewhere [3, 4, 5]. Here we will concentrate on the aspects which concern this particular analysis.
The energy loss suffered by a fast magnetic monopole in matter is due to atomic excitation and ionization. Thus the average rate of energy loss follows immediately from an extension of the Bethe-Bloch formula for a moving magnetic charge. This allows a straightforward and well-grounded calculation of the detector response. The peculiar characteristic of the fast magnetic monopoles is their large ionizing power compared either to considerably slower monopoles or to minimum ionizing electrically charged particles. The energy released in a MACRO streamer tube by a monopole is at least one hundred times larger than that due to a minimum ionizing particle (m.i.p.) [6]. Since the charge of the streamer pulse has been shown to have a logarithmic dependence on the ionizing power [6, 7], it provides a good rejection of the muon background. The response of the scintillation counters to a magnetic monopole of a given velocity is reported in [8, 9]. The expected signal for a monopole is about a factor 30 greater than the m.i.p. level for and is even larger for greater velocities. In the case of the track-etch detectors, the calculated value of Restricted Energy Loss (REL, defined as the fraction of the particle’s energy loss contained in a 10 nm diameter around its trajectory) for a magnetic monopole with is 60 MeV cm2g-1, and it increases rapidly at higher velocities [10]. This value is well above the detection threshold of the MACRO CR39 nuclear track detector, RELmin = 26 MeV cm2g-1. The Lexan has a much higher threshold compared to that of CR39, making it sensitive to relativistic monopoles only.
The particular signatures of a fast monopole in MACRO are thus: ) a single track in the detector’s spatial and temporal views corresponding to a particle with a velocity greater than , and ) a large energy deposition along the particle trajectory.
The background for this search is almost entirely due to the flux of high energy single muons. At the depth of MACRO, about of these have energies greater than the threshold energy above which the discrete energy loss processes of nuclear interactions, bremsstrahlung, and pair production start to dominate, viz., TeV. These discrete mechanisms produce showering events in the apparatus.
This background is generally reduced by a combination of geometrical and energy cuts imposed on each of the subdetectors. An analysis based on all three subsystems in MACRO allows the use of these cuts in a rather conservative way. In particular, the energy cut remains safely within the linear response of the system. Moreover, any systematic errors are greatly reduced by the combination of measurements from the three subsystems.
Energetic muons () showering in the apparatus are efficiently rejected by requiring a clean single track in the streamer tube system. However, this cut will also reject monopole events in which electromagnetic or hadronic showers are produced. In particular, a monopole with (i.e. ) can produce a -ray in a single electron collision with enough energy to produce an electromagnetic shower, giving rise to secondary tracks. Furthermore, processes such as hadronic interactions and pair production are effective for [11] and will produce secondary tracks. Finally, another possible source of non-clean monopole-induced single tracks in the apparatus might be due to the nucleon decay catalyzed by monopoles following the Rubakov-Callan effect [1]. Due to these effects the present analysis might lose efficiency in identifying monopole events if the catalysis cross section or .
3 Event reconstruction
This search begins with event selection performed by both the ERP and the Streamer tube Horizontal Monopole Trigger (SHMT).
Event reconstruction starts from the procedures used in the search for slow monopoles with the streamer system [4]. Once event tracking has been performed, the energy loss observed in the scintillators and the analog response of the streamer tubes are used to achieve the necessary rejection power against the muon background.
3.1 Event tracking in the Streamer Tube System
The details of the event tracking are fully described in [4]. The strategy adopted to eliminate the radioactivity background is briefly summarized in the following. The SHMT selects events with at least 7 horizontal planes with a rough temporal alignment (a “ slice”). For each of the triggered -slices, wire hits are selected on the basis of time measurements made by the QTPs, while strip hits are identified by requiring a spatial match with the wire view. If a track is found in each of the two spatial views, a more refined time track is searched for by using the QTP timing information from the selected spatial hits. Furthermore we require a minimum of 7,6 and 7 points along the track in the wire, strip and time views respectively. Only events satisfying these requirements and consisting of a single track reconstructed in each of the wire, strip, and time views are analyzed further.
3.2 Measurement of the energy loss in scintillation counters
The ERP, a system measuring the energy deposition in each MACRO single scintillator and time of flight across the apparatus, has been extensively described elsewhere [3, 5]. In order to obtain , the energy lost by a particle in a scintillation counter, the raw ADC values from each of the two tank ends are corrected for light attenuation in the scintillator and a normalized weighted mean of the two is taken. The normalization constant for each scintillator is updated on a weekly basis by fitting the Landau-like signal size distribution produced by a selected set of cosmic muon events. Correcting for the light attenuation requires knowledge of the longitudinal position of an event in a scintillator. This can be obtained either from the streamer tube tracking system or from the difference of arrival times of the light at the two scintillator ends. In this analysis, we use the former since it yields better energy resolution than the time-difference method. In Fig.1 the difference between the positions reconstructed with these two different methods is shown for a sample of cosmic muons. The width of this distribution is primarily due to the time resolution of the scintillators and it yields . In Fig.2 the value of the reconstructed energy deposition of a sample of muons is shown as a function of the longitudinal position of the event in the scintillator. As can be seen the correction for varying sensitivity as a function of this position is performed correctly in almost all the sensitive volume. Near the scintillator ends this procedure fails by underestimating the energy lost by the particle. For this reason a fiducial volume is defined by cutting the last cm close to each end.
A study of the response of the ERP to large signals has been fully described in [5]. The response of the whole chain from the photomultiplier tubes (PMT) to the recording analog-to-digital converting (ADC) electronics was measured as a function of light level by pulsing each individual counter with UV light coming from a nitrogen laser (nm) after passing through a precision light attenuator. The system has been shown to have a linear response up to a level corresponding to roughly 5 times the amount of light produced in a pathlength of cm by a minimum ionizing muon. In this search the synergetic use of the digital (tracking) and analog (pulse charge) information coming from the streamer tube system allowed putting analysis cuts below the onset of ERP non-linearity.
Since in this search we are interested in monopoles with velocity down to , the scintillator crossing time might exceed the width of the ERP integration gate. In this case only a fraction of the PMT pulse would be integrated, thus underestimating the energy lost in the scintillator. The ERP ADC integration gate is ns wide and the time spent by the digital electronics to produce it is ns. As a consequence the PMT signal to be integrated is delayed by ns. Moreover the decay time of the slow component of the scintillation light, the electronic chain bandwidth, and the geometry of the detector actually set a minimum pulse duration of about ns, which can be estimated by observing the muon pulses. This implies that saturation effects might start for pulses produced by particles which traverse the scintillator in more than . However in , a monopole travels about and loses at least [8]. Since the analysis cut will be set at a much lower level, the width of the integration gate does not affect the detection efficiency.
The selection criteria adopted in this analysis for the ERP hits are then summarized as follows:
-
•
The values given by the ERP TDC’s at the two different system thresholds (high and low) cannot differ, at each scintillator end, by more than ns. This is essentially a check that the system is working properly.
-
•
The measurements of the longitudinal position of a hit as performed by the streamer system tracking and by the ERP TDC’s, cannot differ by more than cm (see Fig.1).
-
•
A fiducial volume is defined to guarantee a proper energy reconstruction. This is done by excluding cm close to the scintillator ends (see Fig.2).
-
•
The pathlength of the particle in the scintillator volume, as measured by using the streamer system track parameters, must be greater than cm.
For all the events in which at least two different scintillators are selected, the time of flight information is also available.
3.3 Measurement of the streamer pulse charge
3.3.1 Study of the analog response of the streamer tubes
Experimental studies of the dependence of the streamer charge on the particle’s trajectory and ionizing power are reported in [6, 7, 12]. In this section we show the results of a study of the MACRO streamer tubes charge, as measured by the QTP system, using cosmic ray muons. This is done to better understand the detector characteristics as well as the dependence of the charge on the geometry of the ionizing track, the gas mixture parameters, etc. The understanding of these parameters allowed us to set up a procedure for distinguishing a m.i.p. from a highly ionizing particles such as a fast GUT monopole.
For each selected event, QTP hits along the track are identified in order to measure the streamer pulse charge. They must:
-
•
spatially match with the wire and strips hits;
-
•
be in the time view within from the temporal track;
-
•
not be preceded in the previous by another hit in the same QTP channel (this is required in order to both reject afterpulses and avoid systematic errors in the charge measurements due to the ADC’s recovery time).
In the analysis we considered only wire hits with cluster size CLS=1 or 2 in a given QTP channel. In the following we will refer to the streamer pulse charge as measured by the QTP receiving the signals from the horizontal tubes, once the above mentioned selection criteria are applied.
For slanted particle trajectories with respect to the direction of the anode wire, the probability to produce more than one streamer in the gas volume increases. As a consequence, after a region (which we refer to as the dead zone) in which the multi-streamer production is strongly reduced by space charge effects due to the first avalanche, the pulse charge linearly increases for increasing , the length of the projection of the particle track (in the sensitive volume) along the direction of the wire. This dependence has been studied in reference [12] using a muon beam. Here we report also the results of a study on the MACRO streamer tubes performed with cosmic muons crossing the detector. In particular, for each cm interval in , the charge distributions produced by cosmic muons have been fit. Gaussian fits have been separately applied for CLS=1 and CLS=2 hits. The mean value of the fits are given as a function of in Fig.3. These behaviors are in good agreement with the aforementioned results obtained in [12]. The dependence of the charge on comes out to be:
| (1) | |||||
where , and are the values of the charge produced by vertical muons, the slope of the linear part of the plot, and the width of the dead zone, respectively. Identical behaviors are obtained with vertical streamer tubes. Only the results for cm are reported. This is due to the angular distribution of the cosmic muons that limits the statistics for cm. It must be noticed that, given the trigger requirements of the SHMT, the restriction to the analysis of events with cm results only in a reduction of the geometric acceptance.
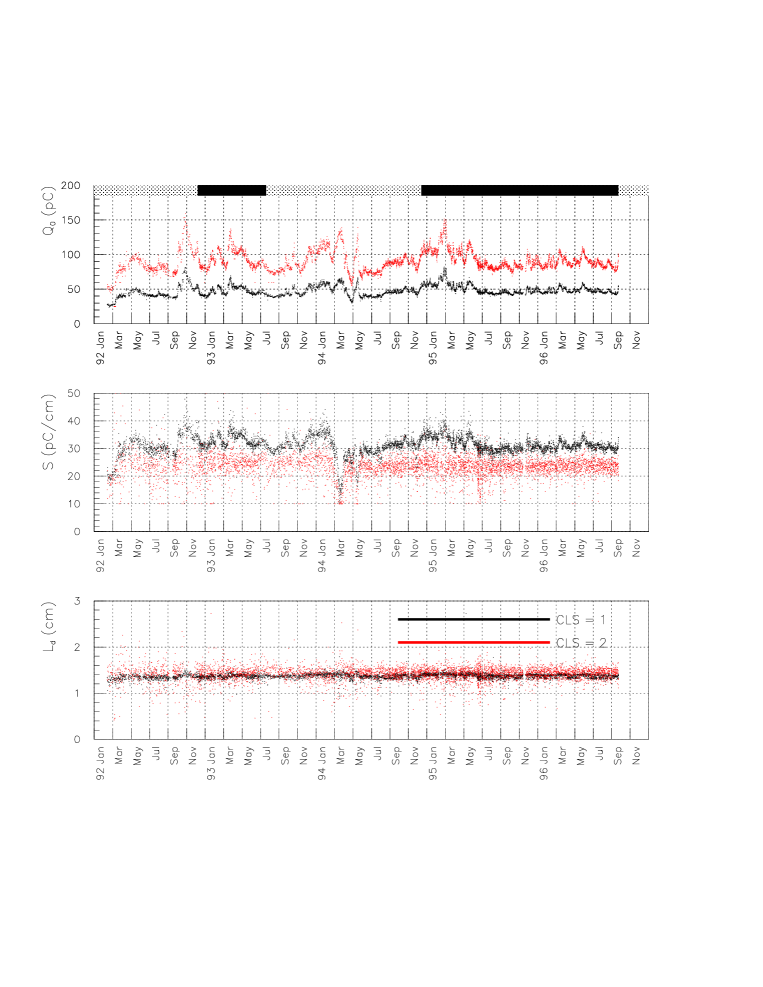
The procedure used to obtain the plots shown in Fig.3 has been applied to the whole data sample. For calibration purposes the values of , and have been measured on a run-by-run basis. This allowed us to study and monitor the MACRO streamer tube response, its dependence on the gas mixture parameters and the correlation between the CLS=1 and CLS=2 values. The behaviors of , and , for CLS=1 and CLS=2, are reported in Fig.4 as a function of the solar time. The fluctuations in the value of the charge produced by vertical muons are due to small variations of the parameters of the gas mixture. In March 1994, during hardware work for detector upgrade, there was an abnormal streamer charge response (see Fig.4), due to a strong air contamination of the gas mixture. This caused the tubes to operate in Geiger mode.
Small variations in the actual values of , and are very useful in order to study their mutual dependencies and to compare them with the results obtained in the literature [12]. One example is the dependence of on , which is shown in Fig.5 for CLS=1 hits. Since the increase of the pulse charge for larger values of is due to the production of more than one streamer avalanche along the particle trajectory, one should expect . However, in agreement with what is reported in [12], this approximation fails for large values of , when it is not easy to take into account space charge effects in a simple phenomenological model. The important feature of the first plot of Fig.5 is that for a highly ionizing particle (i.e. large ) the value of has to be larger than the corresponding value for a m.i.p. in the same detector configuration. This is particularly important for this analysis since it allows a better discrimination between fast monopoles and cosmic muons.
3.3.2 Measurement of the average charge along the track
The results of the study of the MACRO streamer tube response and the aforementioned calibration procedure allowed us to correct the pulse charge measurements for both geometrical effects and gas mixture variations.
The charge measured by the QTP system for the selected hits has been normalized by dividing it by the value of the average charge produced by a muon in the same operational and geometrical conditions. The muon charge is calculated by using Eq.1 with the value of for the event under consideration and the values of , and from the calibrations for a given CLS and run. As can be seen in Fig.4, the values of , and for CLS=2 have large spreads around their mean values. This is a purely statistical effect in the fit to the various charge distributions. However the ratios of the CLS=2 constants to the CLS=1 ones are very stable in the whole data set. As a consequence, we avoided small effects due to the aforementioned spreads by using the values obtained for CLS=1 multiplied by the measured scaling factor.
In order to measure the streamer tube response to the passage of a particle, we defined a variable , where is the charge actually measured for a given event and is that produced by a muon and calculated as described above. As was reported in [6, 7] has a logarithmic dependence on the particle ionizing power. In particular, for a monopole with , is expected. The value of has been measured in each selected event by using the QTP information coming from the horizontal streamer tubes for CLS=1 and CLS=2 hits 111For CLS 2 the poor statistics (due to the muon angular distribution) does not allow setting up a calibration procedure on a run by run basis.. In this way different measurements for CLS=1 () and different measurements for CLS=2 () have been obtained along the particle trajectory. The value of associated with the event is then obtained by averaging these measurements, weighted by the inverse of the variances of the charge distributions, and , as obtained from the data sample under consideration. In order to reduce the fluctuations of the value of , we do not include in the average the hit with the largest value of (=1 or 2). Therefore
| (2) |
which is calculated on different points. Given the considerations concerning the efficiency and the acceptance of the analysis (see next sections), we required an event to have at least .
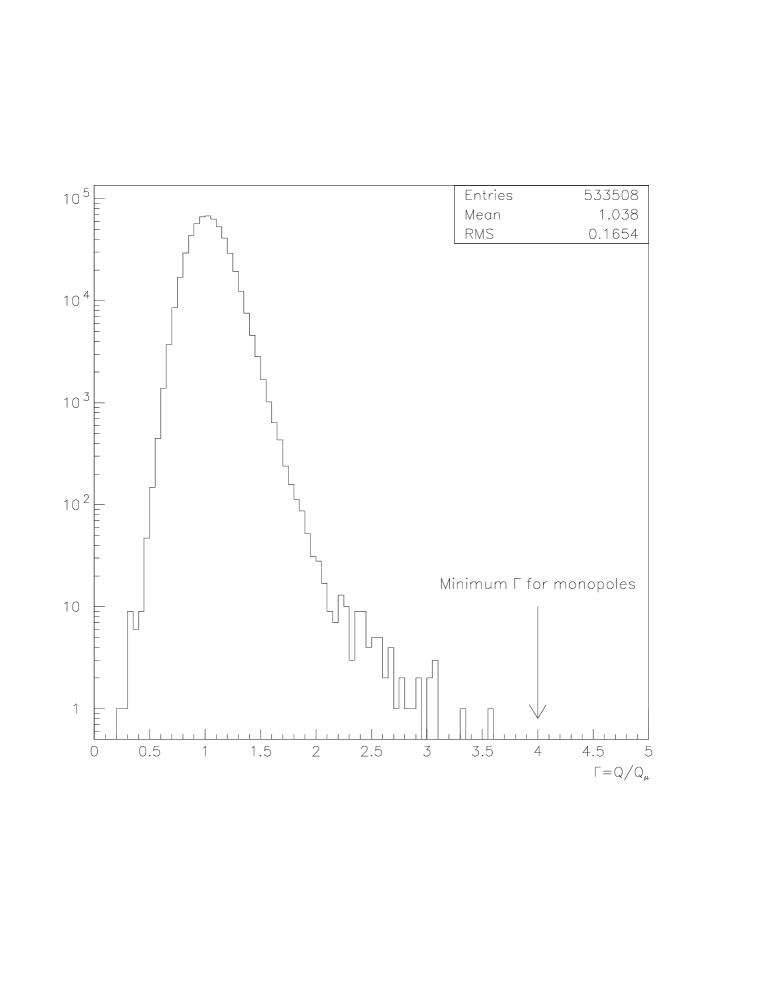
The distribution of for a data sample is shown in Fig.6. As expected, the shape is almost Gaussian with a tail towards the largest values that is due to both fluctuations and ray production by high energy muons. As anticipated, a magnetic monopole with would have . However, detailed studies of the streamer formation process and of the effects of the read-out electronics on the pulse shape show that the actual value of the cut must be a suitable function as discussed in the following.
4 Analysis flow
The analysis method can be summarized as a sequence of three different phases: run selection, event selection and reconstruction, and candidate selection.
In the first phase all runs longer than 0.5 hours are selected (the average time length of a MACRO run is 6.5 hours). Evident electronic problems are ruled out by discarding runs with abnormal trigger rates. This selection results in a total live time of more than of the solar time.
Event selection requires that both the SHMT and the ERP trigger have fired. Then single tracks must be identified in the spatial and temporal views with the requirements listed in Sec.3.1. Given a space track, at least one scintillator must satisfy the selection criteria discussed in Sec.3.2. For each of the selected ERP hits, the energy reconstruction procedure is applied. If at least two different scintillators fired, a precise time of flight measurement (at the level of less than 1.ns) is also possible. The QTP hits for the streamer pulse charge measurements are then selected (see Sec.3.3.1). This allows the measurement of for all CLS=1 and CLS=2 wire hits in the horizontal streamer tubes, by using the streamer charge calibration constants previously produced for each run. The calculation of the of the event is then made by making an average on at least QTP hits (see Sec.3.3.2). The average amount of events reconstructed following these requirements is evt/yr.
Monopole candidate events are then selected. The energy reconstructed in each selected scintillator counter must be MeV (see Sec.5.3). On the evt/yr which are left a cut on is imposed: (see Sec.5.4). Finally the analysis of the possible survived candidates (evt/yr) is made by the scanning of the track-etch sheets identified by the streamer track.
5 Efficiency evaluations
As can be envisaged from the previous sections, muon events pass the first two analysis steps but not the last, which is based on energy loss measurements in the scintillator, streamer and track-etch subdetectors. This allowed the use of the cosmic muons as an important tool for an evaluation of the analysis efficiency. The data from [7, 12] and some characteristics of the streamer tube read-out card have been used to compute the efficiency of the cut on the analog streamer response.
5.1 Streamer tube system: trigger and event reconstruction efficiencies
The SHMT sensitivity to muons allows a simple and direct measure of the overall reconstruction efficiency of the analysis steps based on the streamer information. It has been estimated according to the procedure fully discussed in [4]. Basically is expressed as the product of the efficiency of the reconstruction algorithm times the efficiency due to the trigger and all the electronics used to produce the streamer data: . Actually the two contributions are not independent, leading to a conservative estimate of the overall efficiency. The reconstruction efficiency for particle with is measured by the ratio between the rate of muons reconstructed by the analysis and the expected value. Then a check is performed of the independence of on the velocity of the particle. This is done by allowing the natural radioactivity hits to simulate time alignements corresponding to slow particles. Electronic failures that can be responsible for trigger inefficiency, i.e. , are monitored by computing the ratio between the measured trigger rate and the expected one on the basis of the knowledge of the trigger circuitry and of the radioactivity background rate.
5.2 The ERP efficiency
The scintillator counters considered in a given event are identified by using the tracking information provided by the streamer tubes. The single scintillator efficiency , with respect to the event reconstruction procedure with the streamer tubes, is measured for each run and each counter by checking if the ERP trigger associated with the tanks crossed by the reconstructed streamer track actually fired. This single scintillator efficiency, , is very close to one except for a few counters with evident hardware problems. The ERP efficiency , has then been evaluated for each run by measuring the fraction of scintillators with . This procedure is very sensitive to the overall ERP efficiency and it automatically takes into account all the inefficiencies of the tracking algorithm.
5.3 The ERP energy cut
As calculated in [8], a magnetic monopole with produces a light yield in a scintillator which is more than 30 times larger than that due to the passage of a m.i.p. If we take into account that this estimate has a factor of two uncertainty [8], the minimum light yield produced by a monopole with the shortest accepted pathlength in the fiducial scintillator volume (cm) is
| (3) |
where is the mass density of the scintillating liquid. For this value of , the non linearity effects (due to the PMT and/or ADC saturation) are below the level and the energy resolution is about [5]. Therefore a cut which imposes MeV has an efficiency greater than .
5.4 The streamer charge cut
As shown before, a monopole with would produce a track in the streamer system with . The streamer charge would be even larger for faster monopoles. The analysis requires . The suitable value of is chosen to ensure an efficiency of at least for recognizing a monopole. To evaluate , a complete and detailed simulation has been performed of the full analysis chain starting from the production of the electronic signal. To ensure that the input waveforms for the simulations were correct, we collected MHz WFD data, at different values, from a streamer tube operating in a muon beam [12] under conditions very similar to those in MACRO.
Since a monopole with is expected to produce streamer pulses with a charge four times higher than that produced by a muon, the dead region length is essentially independent on , and the slope increases with , the monopole charge parameters are conservatively set at:
| (4) | |||||
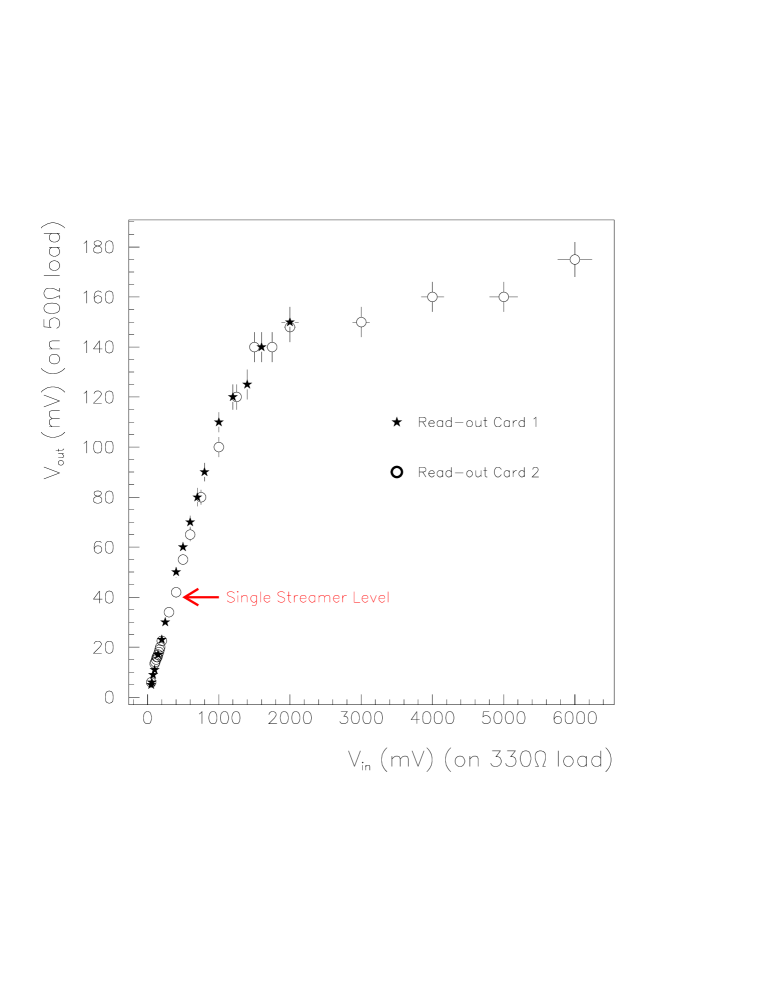
In order to simulate the waveform of the signal produced by a monopole, the muon streamer response was multiplied by the ratio of the charge produced by a monopole and that by a muon as computed with Eq.1 and Eq.5.4. In the simulation, the effect of the protection diodes of the read-out cards is also considered. They actually introduce an amplitude saturation of wire signal outputs corresponding to more than three times the signal produced by a m.i.p. (see Fig.7). For each value both muon and monopole waveforms have been conservatively saturated at a level corresponding to two times the amplitude of the single streamer pulse.
The values of have been determined, separately for muon and monopole events, by using the charges of the simulated pulses at different . For this purpose a detailed Monte Carlo simulation of the MACRO detector provided the number of hits with CLS=1 and CLS=2 for muons and monopoles, taking into account the different angular distributions and the different effects of the trigger requirements for monopoles and muons.
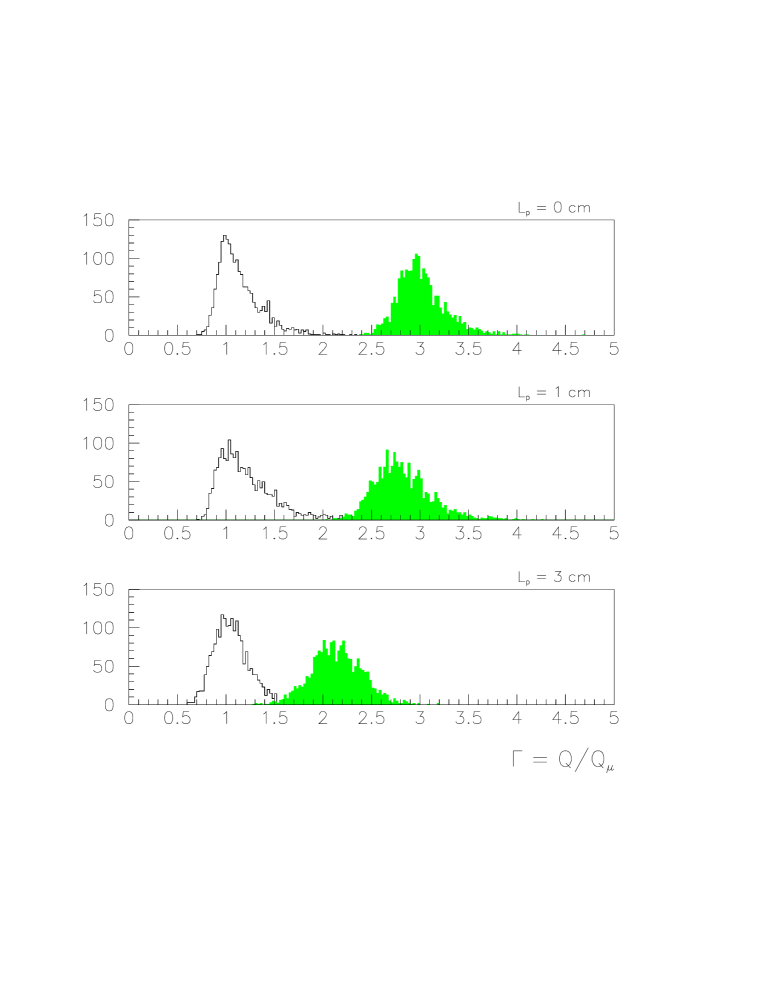
A result of this procedure for monopoles is shown in Fig.8. The distributions of muons and monopoles are well separated for small while the effect of the saturation due to diodes is clearly visible for larger . Starting from these data, a function was extracted for which at least of monopoles have . For monopoles with , a larger value of is expected. However, in the whole range covered by this analysis, we conservatively used the estimated for as shown above.
6 Analysis results on a first data sample
The analysis procedure described above has been performed on a first data sample collected since December 1992 to September 1996, with the exclusion of the period June 1993-December 1994, when the efficiency of the streamer and scintillator subdetectors were affected by the works due to the upgrading of the apparatus with the construction of the upper part. In particular, by considering the ERP and SHMT rates, the ERP efficiency and the calibration of the streamer charge response we have selected three data taking periods with a total live time of more than 16,000 hours. The main characteristics of the considered data set, as well as the values of the analysis efficiencies discussed above, are listed in Tab.1.
Once all the selected events were fully reconstructed, the 150 MeV energy cut mentioned above was applied. Then the streamer charge on the surviving events was analyzed. The result is shown in Fig.9 where the dependence of on is reported together with the function previuosly described.
| Period | Runs | |||
|---|---|---|---|---|
| 11 Dec 92 - 13 Jun 93 | 5520 - 6329 | 0.911 | 0.788 | 3456 |
| 12 Dec 94 - 24 Jul 95 | 8907 - 10556 | 0.915 | 0.894 | 3738 |
| 24 Jul 95 - 23 Sep 96 | 10557 - 12816 | 0.915 | 0.946 | 8816 |
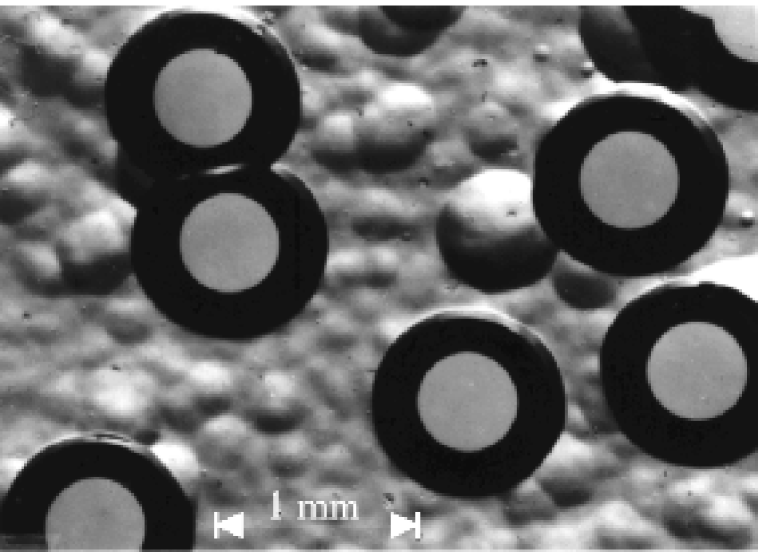
In the first period, three events are close to the cut, and, in the third period, three others survive the cut. For these six events the track-etch wagons identified by using the streamer tracking system were extracted. The passage of a magnetic monopole would cause a structural damage. Chemical etching should result in the formation of collinear etch-pit cones of equal size on both faces of each foil, or of a through-hole, after a prolonged etching. Fig.10 shows microphotographs of holes obtained by exposing a CR39 foil to relativistic sulphur ions (REL 300 MeV cm2g-1) impinging normally to the detector surface. A candidate track must satisfy a three-fold coincidence of the position, incidence angles among the layers and should also give the same value of REL. A detailed description of the analysis procedure is given in [13]. For each extracted wagon the top layer of CR39 was etched in NaOH 8N at 80C for hours. No track compatible with the crossing of a monopole was found. Since the detector threshold is at more than 9 standard deviations below the expected REL for a monopole with , the efficiency of the track-etch analysis can be considered in this search.
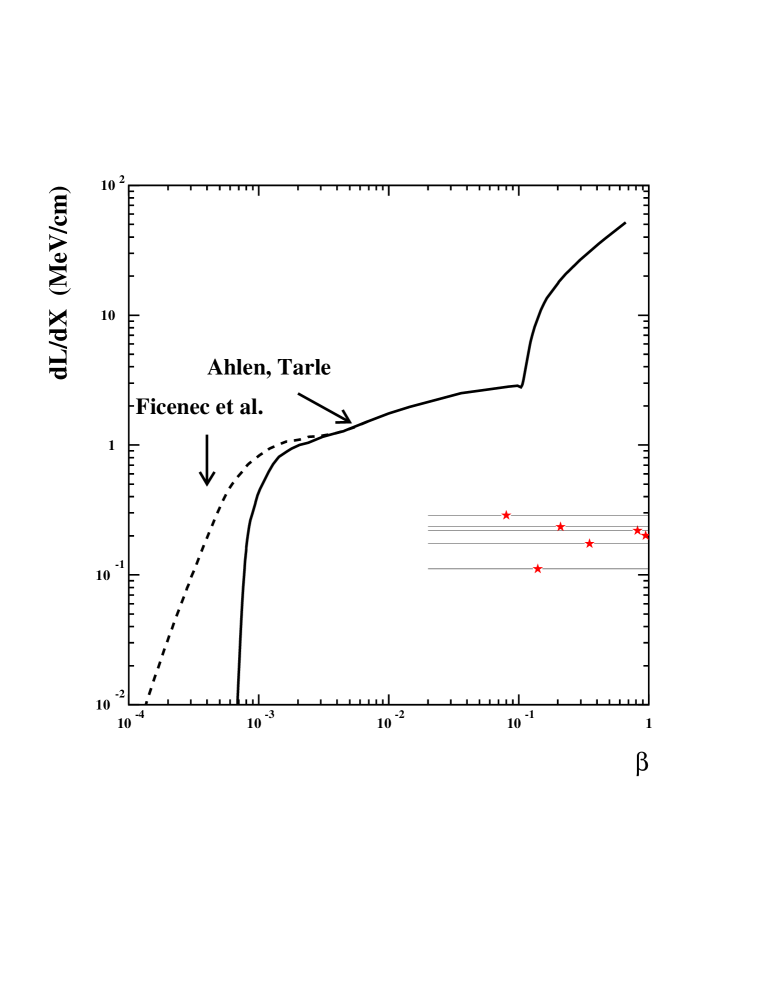
As a further check, the measured values of energy loss (in the scintillator counters) and of surviving candidates have been compared with the expected monopole signal as a function of its velocity [8, 9]. This comparison is reported in Fig.11. For five of the six events the Time of Flight (T.o.F.) information was provided by the streamer system alone, since only one fired scintillator counter was present. In this case the error on the reconstructed velocity is large because of the limited time resolution of the streamer tubes. As can be seen for all the events the measured energy loss values are well below the expectations for monopoles. The six events are interpreted as high energy muons producing energetic rays.
6.1 Flux upper limit calculation
To evaluate the acceptance, 30 000 events have been simulated and written with the format of real data in order to use the same off-line code employed for the analysis. Since in the first data set the upper part of MACRO (attico) was not in operation, configurations both with and without it have been simulated. By taking into account all the cuts required by the analysis, we find an acceptance of . In Fig.12 the acceptance dependence on the minimum imposed is reported. In the analysis is required. By considering all the effects due to electronics, triggers, cuts on and , etc., the product of the efficiency times the live time integrated in the three periods is 11853 hours. Since no candidate was found, the monopole flux upper limit at C.L. is
| (5) |
for and monopole induced nucleon decay catalysis cross section mb. For and mb the efficiency of this search might be reduced by an amount which is difficult to estimate due to theoretical uncertainties (see Sec.2).
7 Conclusions
A combined analysis technique to search for fast magnetic monopoles with the MACRO detector has been described. The use of scintillator, streamer tubes, and track-etch data at the same time, and the large energy release of fast monopoles, provide a clear signature that allows us to reject the cosmic muon background with highly reliable and safe cuts. A first sample of more than two years of data has been analyzed. No candidate survived thus setting a local monopole flux upper limit at 90 CL of for and nucleon decay catalysis cross section . Even with this reduced data sample in the region , the limit is more stringent than any other obtained with scintillation or gas detectors. By using all of the MACRO data (i.e. up to December 2000), the described analysis technique will be able to extend its sensitivity to fluxes of the order of .
Acknowledgements.
We gratefully acknowledge the support of the director and of the staff of the Laboratori
Nazionali del Gran Sasso and the invaluable assistance of the technical staff of the
Institutions participating in the experiment. We thank the Istituto Nazionale di Fisica
Nucleare (INFN), the U.S. Department of Energy and the U.S. National Science Foundation
for their generous support of the MACRO experiment. We thank INFN, ICTP (Trieste),
WorldLab and NATO for providing fellowships and grants (FAI) for non Italian citizens.
References
-
[1]
J.Preskill, Phys. Rev. Lett. 43, 1365 (1979)
J. Preskill, Ann. Rev. Sci. 34, 461 (1984)
A.Vileknin and E.P.S. Shellard, Cosmic strings and other tipological defects’, Cambridge University Press, 2000 - [2] D.E. Groom, Phys. Rep. 140, 324 (1986)
- [3] S.P. Ahlen et al. (MACRO coll.), Nucl. Instr. Meth. in Phys. Res. A324, 337 (1993)
- [4] M. Ambrosio et al. (MACRO coll.), Astroparticle Phys. 4, 33 (1995)
- [5] M. Ambrosio et al. (MACRO coll.), Astroparticle Phys. 6, 113 (1997)
- [6] G. Battistoni et al., Nucl. Instr. Meth. in Phys. Res. A270, 185 (1988)
- [7] G. Battistoni et al., Nucl. Instr Meth. in Phys. Res. A401, 309 (1997)
- [8] S.P. Ahlen e G. Tarlé, Phys. Rev. D27, 688 (1983)
- [9] D.J. Ficenec et al., Phys. Rev. D36, 311 (1987)
- [10] J. Derkaoui et al. Astrop. Phys. 10, 339 (1999)
- [11] S.P. Ahlen, Phys. Rev. D17, 229 (1978)
- [12] G. Battistoni et al., Nucl. Instr Meth. in Phys. Res. A399, 244 (1997)
- [13] L. Patrizii et al. (MACRO Coll.) Search for massive rare particles with the MACRO track-etch detector at Gran Sasso, Proc. of the 20th Int. Conf. on Nuclear Tracks in Solids, Portoroz, Slovenia, August 28- September 1, 2000.
- [14] Alexeyev et al., Proceedings of the 2121 ICRC conference, Adelaide, vol.10 (1990) 83
- [15] Adarkar et al., Proceedings of the 2121 ICRC conference, Adelaide, vol.10 (1990) 95
- [16] Thron et al., Phys. Rev. D46, 4846 (1992)
- [17] Becker et al., Phys. Rev. D49, 2169 (1994)

 |
 |