8000
address=Department of Hadron Physics, IHEP, Protvino, Russia, 142284, email=dorofeev@mx.ihep.su
2001
The hunting season at VES
Abstract
We present preliminary results of study of the , and -systems produced in the -interaction at . and -waves resulted from the PWA have been fitted in each system separately to establish the nature of the -wave. A hypothesis of the -wave resonant nature in the and has no statistically significant preference over the non-resonant one. The -system analysis confirms the results of the -beam data analysis in favor of the resonant treatment of the bump at .
Keywords:
Document processing, Class file writing, LaTeX 2ε:
43.35.Ei, 78.60.Mq1 Introduction
At present several groups have evidence for meson production, which is forbidden for ordinary quarkonia and hence might be a good candidate for a hybrid Isgur and Paton (1985), Close and Page (1995). The -meson shows up in the final state in two experiments Chung et al. (1999),Abele et al. (1998),Abele et al. (1999). VES group found that the results of the and -system Partial-Wave Analysis(PWA) at agree with the production of the higher mass Khokhlov et al. (2000), evidence for which in the has been also confirmed by E852 at BNL Ivanov et al. (2001). A broad bump observed by VES in the -wave intensities of the , , at was assumed to be a single object. The resonant nature results from the analysis of the and -waves in the Dorofeev et al. (1999).
A data sample was collected in the 1996 data run at VES spectrometer exposed by the momentum -meson beam. A detailed description of setup can be found elsewhere Beladidze et al. (1992). Over triggers were recorded during the data taking period, which is more than at . A trigger is an event with at least two charged tracks from the beam interaction moving in the beam direction and falling into the spectrometer aperture. Events of the studied final states production form subsets of reaction , where . To select events of this reaction the following criteria were applied to the reconstructed events:
-
•
3 reconstructed tracks should form the -system;
-
•
an interaction vertex must be inside the target;
-
•
we require for 2-4 -clusters in the calorimeter;
-
•
a -system with mass closest to the mean -meson mass within is identified as the -meson. A 1C-fit to the mass is applied to the identified pairs;
-
•
total visible energy must satisfy the following in-equation: .
2 Study of the -system
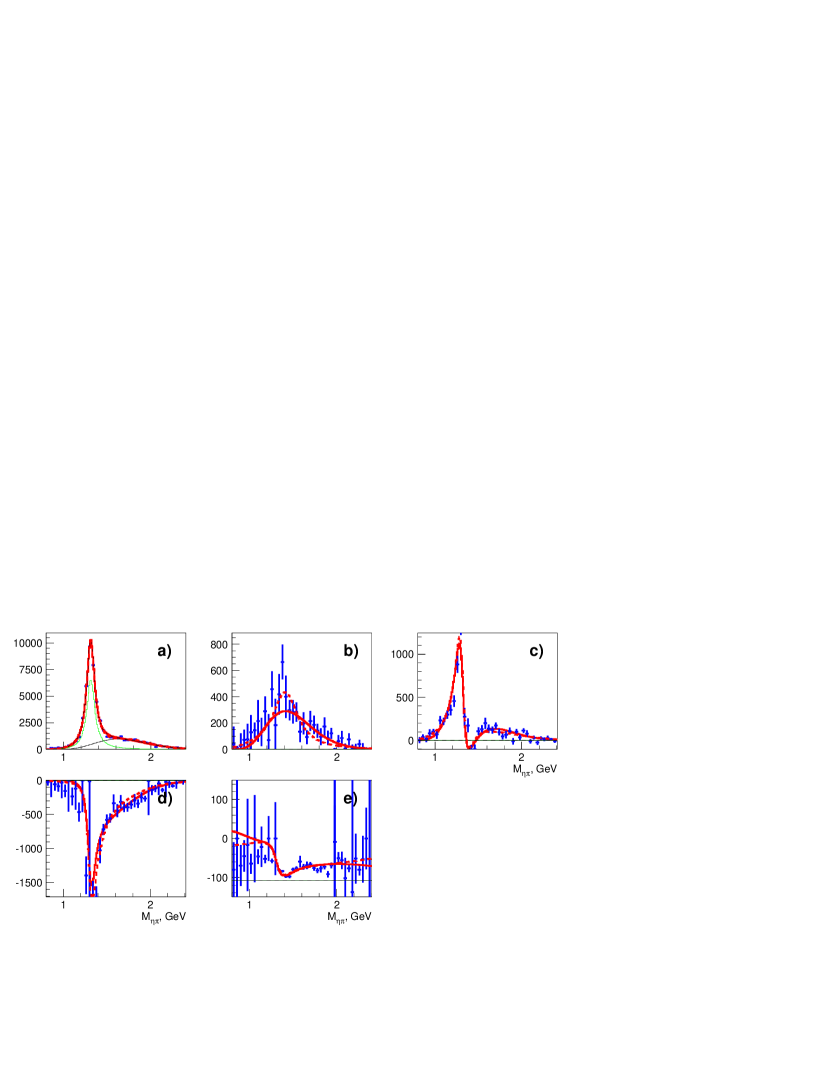
A decay chain , was chosen for the production study. A clear peak of the -meson corresponding to the production is observed in an invariant mass spectrum of the -system in fig. 1a. The shape of the peak is parametrized with a sum of two Gaussian functions and resolution of the narrow one is equal to . Shown in fig. 1b is the invariant mass distribution of the for events from the region () with superimposed plot for sidebands ( and ) which are used for the background estimation. The background subtracted invariant mass spectrum (fig. 1c) shows a dominant -meson production with a small bump near of a possible -meson production.

A negative value of the invariant four-momentum-transfer between the beam and the squared -distribution in fig. 1d shows the characteristic features of the projective wave production. Here , where - is a minimum transfer squared for a given mass.
2.1 The -system PWA
We applied the PWA procedure to expand the data in terms of the partial waves. An event is considered in the spirit of the isobar model Herndon et al. (1975) as a production process followed by a chain of the subsequent decays into the and . The production process of the is assumed to be described by a rank one density matrix for each naturality Hansen et al. (1974). An event probability for each naturality is equal to an average over possible non-interfering combinations of a product: due to presence of two ’s, where: - is a probability of the decay which corresponds to the decay Dalitz-plot distribution, - is the -meson shape parameterization being used to take into account the mass resolution. Here is an expansion squared of the product of the two pseudo-scalar production and decay amplitudes in terms of the partial wave decay amplitudes. The decay amplitudes are defined by the following set of quantum numbers , where stands for a total angular momentum and is equal to an orbital momentum in the system of two pseudo-scalars. With we denote parity, - an absolute value of the projection. Here is exchange naturality. The decay amplitude is parametrized with spherical harmonics Groom et al. (2000) multiplied by a breakup momentum involved in the -th degree. Under the assumption about the rank of the density matrix the production amplitudes are denoted as: for the and for the waves.
The complex production amplitudes are determined from the extended maximum likelihood fit Orear (1958).
A wave set includes 3 subsets of partial waves non-interfering with each other. The first is composed of waves with negative naturality, the second - with positive one and a subset made of a single wave FLAT which describes the background in the -system.
The ambiguous solutions Sadovsky (1991) were found by repeating 100 times the fit from the random starting values of the fit parameters.
50300 events in the range , , with the mass of at least a single combination in the region or the sidebands were subjected to the PWA. The PWA has been carried out independently in each of the bins. To make the data set cleaner the following additional cuts were applied: and the track angular separation in projections , where is the polar angle in the overall CM helicity reference frame.

In fig. 2 are shown predicted by the PWA fit acceptance-corrected wave intensities and a relative phase between the and waves as a function of the mass. With a thick line is shown a range of possible ambiguous solutions and with a thin one the maximum extent of errors.
The intensities of the and waves with the negative naturality are small and consistent with zero in all the range. The wave has a non-zero contribution in the . We found a significant intensity in the whole mass range of unclear nature.
The -wave is the dominantly produced wave in the , where a huge peak corresponding to the production is observed. A broad bump with a spike at is observed in the . The spike might results from the fit quality worsening in the region and where one should notice the increase of errors. A sign ambiguous relative phase shows a rapid motion in the region.
We have tried also to include the waves with the orbital momentum higher than 2 and the waves with , but they were found to be not significant. The quality of the fit is controlled by comparison of distributions of variables which describe the -system for the experimental and Monte-Carlo data. The Monte-Carlo events were generated according to the described above model with the values of the production amplitudes resulted from the best fit solution in a mass bin.
2.2 The -system mass-dependent fit
In order to establish the nature of the -wave we have carried out a combined mass-dependent(MD) fit of the expected production amplitudes to the and resulted from the PWA in the whole mass range. Fitted with the method are the and intensities and the real and imaginary parts of the production of both amplitudes with the corresponding errors in each mass bin.
We assume two general production manners of a resonant and a non-resonant type. The resonant amplitude is parametrized with a Breit-Wigner form:
where: - the mass, - a resonance mass, - a nominal width, - a partial width in the final channel, - a total width, - a breakup momentum of the with the mass, - a barrier factor von Hippel and Quigg (1972), - a branching ratio into the -th final state.
By the notion background we just mean the non-resonant production manner without going into the nature of the process. The main difference of the background type from the resonant one is absence of phase motion. The background amplitude is parametrized with the following free form , where: - a phase space, - a threshold mass, and are shape parameters.
A procedure of the wave construction from the objects is in the following. At first a wave is formed of evident structures such as the in the -wave. If there are no such objects we take an object of any production type arbitrarily. After doing the fit to thus constructed wave we then necessarily try to describe the data with the object of the alternative type. At the next steps we add consistently another objects of both types to both waves until we will succeed in the description of the wave intensities and their interference in the whole mass region. All objects are added coherently with their own mass-independent phase. The parameters of the MD fit are: the mass, width and the number of the resonance events, the shape parameters and the number of the background events, the phase relative to a reference object.
| bkg | bkg | |||
|---|---|---|---|---|
| + | + | 244/149 | ||
| + | + | 422/149 | ||
| + | + | 224/149 | ||
| + | + | 219/149 | ||
| + | + | + | 176/145 | |
| + | + | E852 | 187/147 |
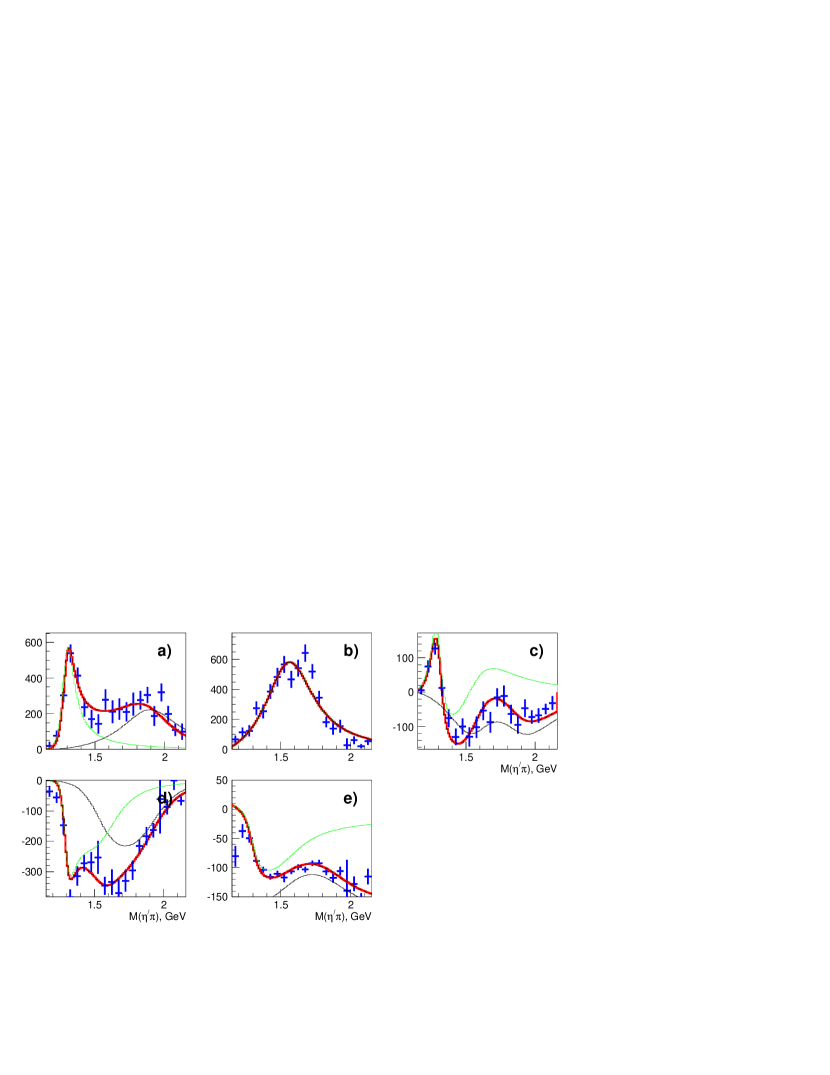
To begin with we have fitted the Breit-Wigner to the intensity and failed to describe the wave at masses . Then we have applied the described above procedure. At first the was fitted to a sum of the and the background and the to the background. The second fit was carried out with the wave background replaced by the resonance, which will be called further as an -meson for convenience. There have just been reported the evidence for the Hou (2001). The next steps were to fit the wave to the resonance, called a . The evidence for it have been reported by E852 and CBAR groups Chung et al. (1999), Abele et al. (1998), Abele et al. (1999) and which production did not contradict to VES results Zaitsev et al. (1997). The results of the MD fits in the case, when the has been fitted to a sum of the and the background and the to the background or to the are shown in fig. 3 with thick solid and dashed curves respectively.
The summary of the MD fit results are presented in tab. 1. The objects which make up the fitted partial waves are marked by the plus sign in a row. A over the number of degrees of freedom of the corresponding MD fit is shown in the fifth column.
From the comparison of the first four rows one can conclude that there are no statistically significant difference between a single resonant and non-resonant object description of the .
The fits of the to a sum of the and the background are shown in the last two rows. A fit with free parameters resulted in the following values: , , and , . The quoted errors are statistical only. Statistical significance is nearly the same as for the fit with the parameters fixed to the values reported by E852 Chung et al. (1999). A closeness of the mass to the mass may indicate that there is an underestimated influence of the on the .
3 Study of the -system
A decay chain , was chosen for the production study. A clear peak of the corresponding to the production is observed in the invariant mass spectrum of the in fig. 4b. Shown in fig. 4c is the invariant mass distribution of the for events from region () with superimposed plot for the sidebands ( and ) which are used for the background estimation. The background subtracted invariant mass spectrum (fig. 4d) shows a clear peak and a broad large bump at , which strongly differs from the corresponding distribution of the .

A distribution in fig. 4e shows characteristic features of the projective wave production like for the .
10700 events in the range , , with the mass of at least a single combination in the -meson region or the sidebands were subjected to the PWA. The PWA has been carried out independently in each of the wide bins.

We have applied the same procedure as for the -system PWA, described in the appropriate section. In fig. 5 are shown predicted by the PWA fit acceptance-corrected wave intensities and a phase difference of the and as a function of the mass. With a thick line is shown a range of possible ambiguous solutions and with a thin one the maximum extent of errors.
The intensities of the negative naturality waves are small and nearly consistent with zero in all the range. The wave only shows some non-negligible contribution in the regions and .
The peak is observed in the intensity. But contrary to the -system behavior this wave shows a broad structure in the region . The rate of this high mass production relative to the is larger for the than for .
A broad bump of a width is observed in the at . A sign ambiguous relative phase shows a rapid motion in the mass region.
We have tried also to include the waves with the orbital momentum higher than 2 but they were found to be not significant. The quality of the fit is controlled by comparison of distributions of variables which describe the -system for the experimental and Monte-Carlo data.
To establish the nature of the -wave we have carried out the MD fit following the procedure which had been applied for the study. The partial wave amplitude was parametrized with a sum of the Breit-Wigner function and the background or an . This additional object was included to describe the broad bump in the region . The partial wave was parametrized with the background or with the . The indication to the possible resonance nature of the bump at was reported by our group as a result of the PWA at Khokhlov et al. (2000). Later the observation of the resonance have been reported by E852 Ivanov et al. (2001). The result of the MD fit in the case, when the is fitted to a sum of the and the and the to the resonance only is shown in fig. 6.
We have found no statistically significant preference of the fit with the saturated with the resonant over the non-resonant description. In the case of the partial wave amplitude parameterization with a sum of the resonance and the background the statistical significance is larger than in the previous cases. However the width was found to be somewhat larger than it could be expected from the resolution study. In the cases, when the is composed of the and a , while the includes the , the mass was found to be somewhat and the width , while one might expect to find the same parameters as for the .
The above consideration of results prevents us from drawing the unambiguous conclusion about the nature of the -wave in the .
4 Study of the -system
A decay mode was chosen for the production study. A clear peak of the meson corresponding to the production is observed in the invariant mass spectrum of the in fig. 7a. Shown in fig. 7b is the invariant mass distribution of the for events from the region () with superimposed plot for the sidebands ( and ) which are used for the background estimation. The background subtracted invariant mass spectrum (fig. 7c) shows an shoulder and a broad large bump at .

A -distribution in fig. 7d shows a sharp peak in the low (LT) region, corresponding to the coherent production on a nucleus, which flattens in the high region () and which will be called further the HT. This behavior in the HT-region corresponds to the incoherent production on a nucleon. The projective wave production dominates in the HT-region. Therefore we have divided a data sample into the LT- and HT-sets, which were analyzed separately. A large -meson peak is observed in the invariant mass spectrum of the , produced with the (see fig. 7f). This means the dominant production of the . There is a peak of the -meson in the invariant mass spectrum shown in fig. 7e, corresponding to the production. The same is for the .
A PWA of 284000 events in the range , , with the mass of at least one -combination in the region or in the sidebands has been carried out. Here is a track polar angle in the overall helicity CM reference frame. Events in each of the or wide bins were fitted separately. The Illinois method Hansen et al. (1974) was used in the PWA, however with an important improvement. We added the possibility to restrict a rank of the density matrix Chung and Trueman (1975). The partial waves are denoted by the , where stands for a total spin in the isobar-bachelor system. The partial waves of the , , , are included in the wave set. The results of the PWA are consistent with our previous analysis of the at Amelin et al. (1999). A shown in fig. 8a was found to be a dominant wave with a clear peak and a broad bump at . A significant wave shown in fig. 8b is observed with a broad bump at , which is in the maximum of the peak height. The important feature of the combined and wave behavior demonstrated in fig. 8c is a region bounded to , where the coherence is significantly non-zero. It should be noticed in fig. 8f an rise of the -wave phase relative to the -wave phase right in this region and which may be attributed to a resonance.
The MD fit has been carried out to establish the origin of the -wave in the . The high intensity was selected to be a reference wave. The fit has been done in the same way like the fit. However absence of unambiguous knowledge about the nature of the bump at and an extension of the density matrix rank to three in the PWA requires inclusion of additional fitting parameters in the MD fit. The naïve model is to describe the wave by a sum of the Breit-Wigner and something, which has a form of the bump at , while the may be constructed from a broad incoherent background and from a resonance, which is coherent to the bump.
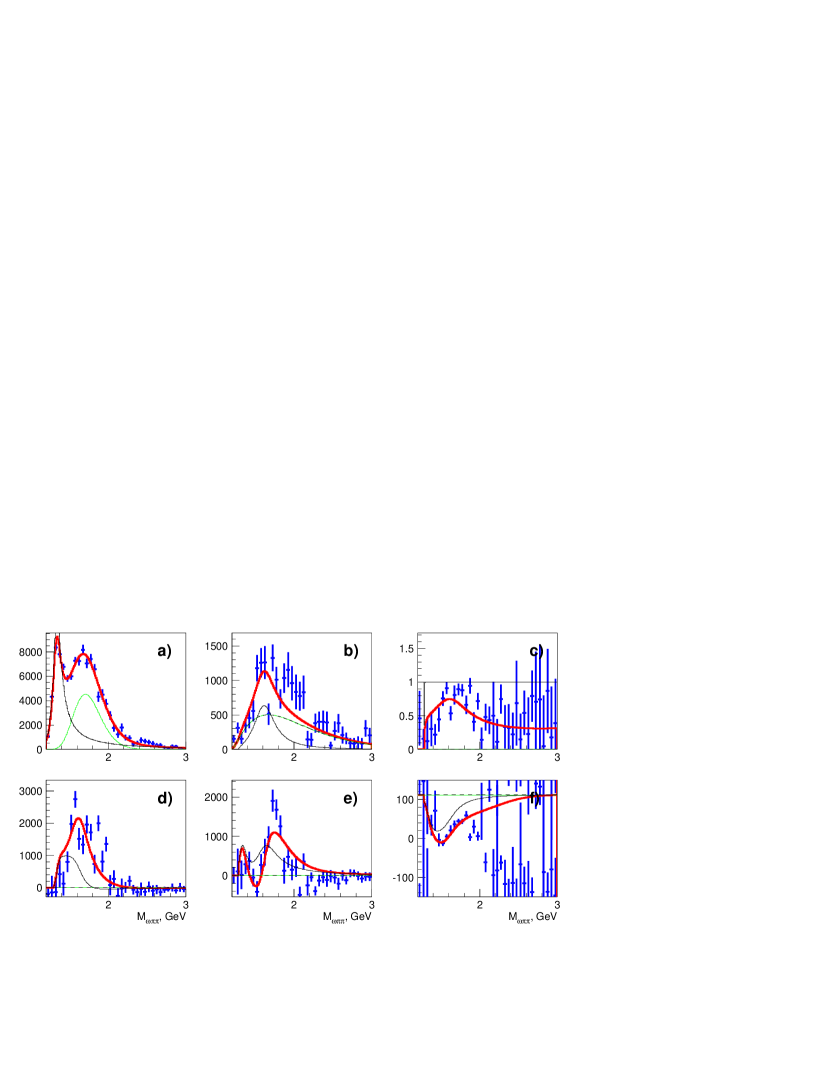
The fit describes the interference pattern satisfactorily as seen in fig. 8. We have tried another hypotheses: to fit the wave to a partially coherent background or to make up the wave from a in addition to the . However we failed to find qualitatively better solution. The data are consistent with the resonant description of the with the mass and the width .
5 Conclusions
We have carried out the PWA of the , , systems produced in interaction at .
We have tried to understand the nature of the observed partial waves in each system by the fit to the resonant and non-resonant description.
-
•
We observed the in the which exhibits the phase motion with respect to the in the coherent model. We could not unambiguously establish the nature of the in the .
-
•
The production of the is dominated by the and . The common analysis of the observed partial waves gives no preference to the hypothesis of the production.
-
•
We confirmed the results of the analysis of the -beam data. The broad bump has been observed in the of the . The simultaneous fit with the favors the existence of a resonance in the with the mass and the width .
-
•
The PWA of the -beam data sample in the several intervals shows a wide bump in the -wave at Kachaev (2001).
References
- Isgur and Paton (1985) Isgur, N., and Paton, J., Phys. Rev., D31, 2910 (1985).
- Close and Page (1995) Close, F. E., and Page, P. R., Nucl. Phys., B443, 233 (1995).
- Chung et al. (1999) Chung, S. U., et al., Phys. Rev., D60, 092001 (1999).
- Abele et al. (1998) Abele, A., et al., Phys. Lett., B423, 175 (1998).
- Abele et al. (1999) Abele, A., et al., Phys. Lett., B446, 349 (1999).
- Khokhlov et al. (2000) Khokhlov, Y., et al., Nucl. Phys., A663, 596 (2000).
- Ivanov et al. (2001) Ivanov, E. I., et al., Phys. Rev. Lett., 85, 3977 (2001).
- Dorofeev et al. (1999) Dorofeev, V. A., et al., “New results from VES”, in Workshop on Hadron Spectroscopy, edited by B. T., A. Feliciello, and A. Filippi, Frascati Phys. 15, 1999, p. 999.
- Beladidze et al. (1992) Beladidze, G., et al., Zeit. fur Phys., C54, 235 (1992).
- Herndon et al. (1975) Herndon, D. J., Söding, P., and Cashmore, R., Phys. Rev., D11, 3165 (1975).
- Hansen et al. (1974) Hansen, J. D., Jones, G., Otter, G., and Rudolph, G., Nucl. Phys., B81, 403 (1974).
- Groom et al. (2000) Groom, D. E., et al., Eur. Phys. J., C15, 1–878 (2000).
- Orear (1958) Orear, J., Notes on statistics for physicists (1958), in UCRL-8417.
- Sadovsky (1991) Sadovsky, S. A., On the ambiguities in the partial-wave analysis of reaction (1991), preprint IHEP-91-75.
- von Hippel and Quigg (1972) von Hippel, F., and Quigg, C., Phys. Rev., D5, 624 (1972).
- Hou (2001) Hou, S., in this proceedings (2001).
- Zaitsev et al. (1997) Zaitsev, A. M., et al., “Search for exotics in , and waves”, in CP432, Hadron Spectroscopy: Seventh Internaltional Conference, edited by S. U. Chung and W. H. J., 1997, pp. 461–470.
- Chung and Trueman (1975) Chung, S. U., and Trueman, T. L., Phys. Rev., D11, 633 (1975).
- Amelin et al. (1999) Amelin, D. V., et al., Phys. Atom. Nucl., 62, 445–453 (1999).
- Kachaev (2001) Kachaev, I. A., in this proceedings (2001).