SLAC-PUB-9031
BABAR-PROC-01/68
October, 2001
Observation of CP violation in the system
Christos Touramanis
Department of Physics
Oliver Lodge Laboratory, University of Liverpool
L69 7ZE, Liverpool, U.K.
(for the B AB AR Collaboration)
Abstract
The BABAR detector, operating at energies near the resonance at the PEP-II asymmetric Factory at SLAC, has collected a sample of 32 million pairs by May 2001. A study of time-dependent -violating asymmetries in events where one neutral meson is fully reconstructed in a final state containing charmonium has resulted in the measurement , which establishes violation in the meson system at the 4 level. lifetime and mixing measurements from a sub-sample of 23 million pairs are also presented.
Invited talk presented at the
International Europhysics Conference on HEP
(HEP2001)
12–18 July 2001, Budapest, Hungary
Stanford Linear Accelerator Center, Stanford University, Stanford, CA 94309
Work supported by the U.K. Particle Physics and Astronomy Research Council, Advanced Research Fellowship GR/L04177 and by Department of Energy contract DE-AC03-76SF00515.
1 Introduction
Since its discovery in 1964 in the decays of mesons [1] violation has been the subject of many experiments and the motivation for many theoretical developments in particle physics. The three-generation Standard Model accommodates violation through the presence of a non-zero imaginary phase in the Cabibbo-Kobayashi-Maskawa (CKM) quark mixing matrix [2]. The result presented here establishes for the first time the existence of violation outside the neutral Kaon system.
The primary goal of the BABAR experiment at PEP-II is to perform stringent tests of the Standard Model by over-constraining the Unitarity Triangle through violation measurements (angles , and ) and the determination of its sides (, in semileptonic decays and in mixing).
2 PEP-II
The PEP-II Factory [3] is an colliding beam storage ring complex at SLAC designed to produce a luminosity of 3x at a center-of-mass energy of 10.58 ( resonance). At the resonance mesons can only be produced as or coherent pairs. The time evolution of a coherent pair is coupled in such a way that the or flavor of one at decay time can be described as a function of the other flavor at its decay time and the signed time difference . The machine has asymmetric energy beams (9.0 electrons on 3.1 positrons), corresponding to a center-of-mass boost of =0.56. An average separation of 250 between the two meson decay vertices allows the measurement of time-dependent decay rate asymmetries. PEP-II has exceeded its design luminosity by 30% while BABAR, with a logging efficiency of 95%, has been accumulating data at daily rates up to .
3 BABAR
A detailed description of the detector and its performance can be found in [3]. The volume within the 1.5T BABAR superconducting solenoid contains a five layer silicon strip vertex detector (SVT), a central drift chamber with a helium-based gas mixture (DCH), a quartz-bar Cherenkov radiation detector (DIRC) and a CsI(Tl) crystal electromagnetic calorimeter (EMC). Two layers of cylindrical resistive plate counters (RPCs) are located between the barrel calorimeter and the magnet cryostat. The instrumented flux return (IFR) outside the cryostat is composed of 18 layers of radially increasing thickness steel, instrumented with 19 layers of planar RPCs in the barrel and 18 in the endcaps which provide muon and neutral hadron identification.
The SVT has a typical single hit resolution of 15 in and 97% efficiency, while fully reconstructed single decay vertex resolution in is 50. Charged particle tracking using the SVT and DCH achieves a resolution of , where is the transverse momentum in . Photons are reconstructed in the EMC, yielding mass resolutions of 6.9 for and 10 for .
Leptons and hadrons are identified using a combination of measurements from all the BABAR components, including energy loss in the DCH and in the SVT. Electron identification is mainly based on deposited energy and shower characteristics in the EMC, while muons are identified in the IFR and confirmed by their minimum ionizing signal in the EMC. Excellent kaon identification in the barrel region is provided by the DIRC, which achieves a separation of 3.4 in the range 0.25–3.0.
4 Mixing and violation with dilepton events
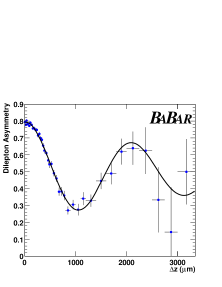
The mass difference between the two mass eigenstates of the neutral system (sensitive to ) is measured by comparing the rate of neutral meson pairs decaying with the same quark flavor to the rate of decays with the opposite flavor sign. At the this time dependent asymmetry gives direct access to :
| (1) |
where is the difference between the two neutral decay times. The simplest way to determine the quark flavor of the decaying neutral is to use primary leptons as tagging particles. can be constructed directly from the rates of “like-sign” and “unlike-sign” events. A sample of 100,000 dilepton events has been selected from 23 million pairs (charged and neutral). Cascade decays background () is suppressed by a neural network using kinematic information of the events. The charged content of the sample is extracted from the data together with . In the boost approximation used in this measurement the decay time difference is calculated as: , where the small flight path of the mesons perpendicular to the z axis is ignored. The resolution is extracted from simulation and has been validated by comparisons to real data control samples (e.g. decays). The time dependent asymmetry is shown in Fig. 1. The preliminary result is:
| (2) |
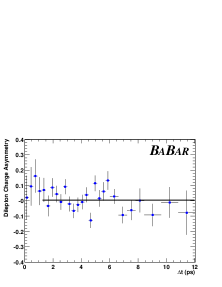
and violation in mixing can be probed in the same way as in mixing [4]. Its magnitude is given by the parameter :
| (3) |
Using our dilepton sample we obtain the preliminary result:
| (4) |
which is the most precise measurement of this quantity to date. The distribution is also shown in Fig. 1.
5 Time-dependent measurements with exclusively reconstructed events
High purity event samples are obtained when the hadronic decay of one meson is fully reconstructed. In such events the kinematics and decay vertex, as well as the flavor or content of the exclusively reconstructed are fully determined. The events where in addition the decay vertex of the other meson can be determined are used for lifetime measurements. The events where both the decay vertex and flavor (at decay time) of the other can be determined are used for mixing or violation measurements.
5.1 Exclusive reconstruction
mesons are fully reconstructed in hadronic modes of (a) definite flavor: , , , and (b) known content: , , , , . In the following the two samples are referred to as and respectively. mesons are reconstructed in the hadronic modes , , , (throughout this paper conjugate modes are implied).
The selections have been optimized for signal significance, using on-peak, off-peak and simulated data. Charged particle identification, mass (or mass difference) and vertex constraints are used wherever applicable. The signal for each decay mode is identified in the two-dimensional distribution of the kinematical variables and : is the difference between the candidate energy and the beam energy and is the mass of a particle with a reconstructed momentum assumed to have the beam energy, as is the case for a true meson. In events with several candidates only the one with the smallest is considered. The and variables have minimal correlation. The resolution in is 3, dominated by the beam energy spread. The resolution in is mode dependent and varies in the range of 12–40. For each mode a rectangular signal region is defined by the three standard deviation bands in () and (mode dependent interval). The composition of each sample is determined by fitting the distribution for candidates within the signal region in to the sum of a single Gaussian representing the signal and a background function introduced by the ARGUS collaboration [5].
5.2 calculation and resolution
Since no stable charged particle emerges from the decay point, the production point of the mesons and thus their individual decay times cannot be determined. However the decay time difference between the two is sufficient for the description of a coherent meson pair (decay length difference technique).
The difference of the proper decay times of the mesons = is determined from the separation along the boost direction =, including an event-by-event correction for the direction of the with respect to the direction in the frame. is determined from the charged tracks that constitute the exclusively reconstructed candidate. The other vertex is determined by fitting the tracks not belonging to the candidate to a common vertex. Tracks from photon conversions are removed. Pairs of tracks compatible with the decay of a long lived or are replaced by the parent neutral pseudotrack. To reduce the bias in the forward direction from charm decay products, the track with the largest contribution to the vertex , if above 6, is removed and the fit is iterated until no track fulfills this condition. Knowledge of the beam spot location and beam direction is incorporated in the vertex determination through the addition of a pseudotrack to its vertex, computed from the vertex and three-momentum, the beam spot (with a vertical size of 10) and the momentum. The reconstruction efficiency is 97%. For 99% of the reconstructed vertices the r.m.s. resolution measured in data is 180, dominated by the vertex. An event is accepted if it has converged fits for the two vertices, an error of less than 400 on , and a measured .
The modelling of the resolution function is a crucial element of all time-dependent measurements. In the case of lifetime measurements, studies both on simulated and real data have shown that adding a zero-mean Gaussian distribution and its convolution with a decay exponential provides the best compromise between different sources of uncertainties. The width of the Gaussian is scaled by the per-event error, derived from the vertex fits. A zero-mean Gaussian distribution with width fixed at 10 is used to describe outliers (less than 1% of events with incorrectly reconstructed vertices).
In the mixing and violation measurements the time resolution is described by the sum of three Gaussian distributions (core, tail and outliers) with different means. In the fit the means are modeled to be proportional to the per-event error, which is correlated with the weight that the daughters of long-lived charm particles have in the tag vertex reconstruction. The core and tail widths are scaled by the per-event error. The outlier width is fixed to 8.
5.3 Flavor tagging
For flavor tagging we exploit information from the incompletely reconstructed other decay in the event. Each event is assigned to one of four hierarchical, mutually exclusive tagging categories or excluded from further analysis. The Lepton and Kaon categories contain events with high momentum leptons from semileptonic decays or with kaons whose charge is correlated with the flavor of the decaying quark (e.g. a positive lepton or kaon yields a tag). The NT1 and NT2 categories are based on a neural network algorithm whose tagging power arises primarily from soft pions from decays and from recovering unidentified isolated primary leptons.
The figure of merit for tagging is the effective tagging efficiency , where is the fraction of events with a reconstructed tag vertex that are assigned to the category and is the mistag fraction for the same category. The statistical error on is proportional to , where . The efficiencies and mistag fractions for the four tagging categories are measured from data and summarized in Table 1.
| Tagging Category | (%) | (%) | (%) | (%) |
|---|---|---|---|---|
| Lepton | ||||
| Kaon | ||||
| NT1 | ||||
| NT2 | ||||
| all |
5.4 lifetime and mixing measurements
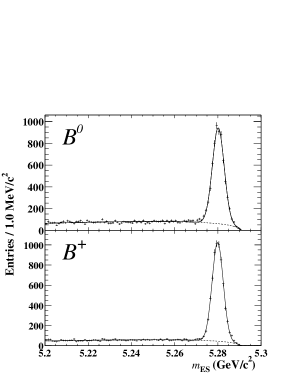
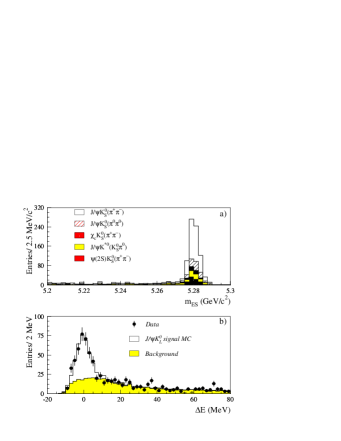
The results presented here have been obtained from a sample of approximately 23 million pairs collected by BABAR between October 1999 and October 2000. Samples of 6000 and 6300 signal events have been selected with background contamination of less than 10%. The results of a fit with a Gaussian signal distribution and an ARGUS background function [5] are superimposed on the distribution of the final sample in Fig. 2. The meson lifetimes are extracted from unbinned maximum likelihood fits to the distributions, also shown in Fig. 2. We obtain:
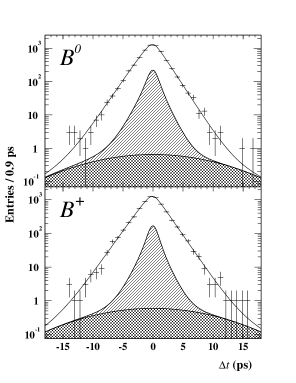
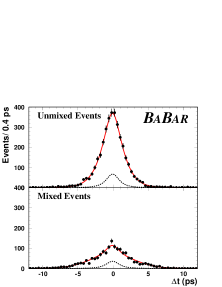
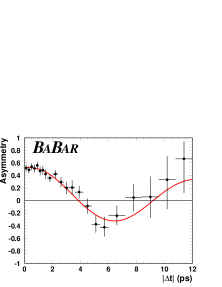
Neutral meson pairs, produced as decay either as (unmixed) or ( ) (mixed), allowing to observe mixing and measure . A sample of 4500 such events where the flavor of the second at the time of its decay has been tagged has been obtained. The distributions and the mixing oscillation are shown in Fig. 3. From an unbinned maximum likelihood fit we obtain the preliminary result:
| (5) |
6 and the observation of violation
The data set of 32 million pairs collected between October 1999 and May 2001 has been used to fully reconstruct a sample of neutral mesons decaying to the , , , , and final states. The last two modes have been added since our first publication [9]. There are several other significant changes in the analysis. Improvements in track and reconstruction efficiency in 2001 data produce a 30% increase in the yields for a given luminosity. Better alignment of the tracking systems in 2001 data and improvements in the tagging vertex reconstruction algorithm increase the sensitivity of the measurement by an additional 10%. Optimization of the selection increases the purity of this sample. The final sample contains about 640 signal events and, with all the improvements, the statistical power of the analysis is almost doubled with respect to that of Ref. [9]. A sample of 7591 fully reconstructed events in definite flavor eigenstates has been used to determine the tagging performance and a sample of 6814 fully reconstructed charged has been used for validations. Details of our samples are shown in Table 2. The samples are shown in Fig. 4.
| Sample | Purity (%) | ||
| ,, | 0.56 0.15 | ||
| 0.70 0.34 | |||
| 0.82 1.00 | |||
| Full sample | 0.59 0.14 | ||
| , , only | |||
| () | 0.45 0.18 | ||
| () | 0.70 0.50 | ||
| () | 0.47 0.42 | ||
| 2.59 | |||
| Lepton tags | 0.54 0.29 | ||
| Kaon tags | 0.59 0.20 | ||
| NT1 tags | 0.67 0.45 | ||
| NT2 tags | 0.10 0.74 | ||
| tags | 0.50 0.22 | ||
| tags | 0.61 0.22 | ||
| non- sample | 0.02 0.04 | ||
| Charged non- sample | 0.03 0.04 | ||
We examine each of the events in the sample for evidence that the other neutral meson decayed as a or a (flavor tag). The decay-time distributions for events with a or a tag can be expressed in terms of a complex parameter that depends on both mixing and on the amplitudes describing and decay to a common final state [7]. The distribution of the decay rate when the tagging meson is a is given by
| (6) |
where is the time between the two decays, is the lifetime and is the mass difference determined from mixing [8]. The first oscillatory term in Eq. 6 is due to interference between direct decay and decay after mixing, and the second term is due to direct violation. A difference between the and distributions or a asymmetry for either flavor tag is evidence for violation.
In the Standard Model for charmonium-containing decays, is the eigenvalue of the state and is an angle of the Unitarity Triangle. Thus, the time-dependent -violating asymmetry is
| (7) |
where for , and and for . Due to the presence of even (L=0, 2) and odd (L=1) orbital angular momenta in the system, there are -even and -odd contributions to the decay rate. When the angular information in the decay is ignored, the measured asymmetry in is reduced by a dilution factor , where is the fraction of the L=1 component. We have measured [6] which, after acceptance corrections, leads to an effective for the mode.
The and samples are used together in the unbinned maximum likelihood fit for the extraction of . A total of 45 parameters are varied in the fit, including (1), the average mistag fraction and the difference between and mistags for each tagging category (8), parameters for the signal resolution (16), and parameters for background time dependence (9), resolution (3) and mistag fractions (8). The determination of the mistag fractions and signal resolution function is dominated by the large sample. Background parameters are governed by events with . As a result, the largest correlation between and any linear combination of the other free parameters is only 0.13. We fix and [8]. The value of and the asymmetry in the distribution were hidden (blind analysis) following our previous publication [9], until the event selection was optimized and all other aspects of the present analysis were complete.
Figure 5 shows the distributions and as a function of overlaid with the likelihood fit result for the and samples. The probability of obtaining a lower likelihood, evaluated with a parameterized simulation of a large number of data-sized experiments, is 27%. Our result is:
Repeating the fit with all parameters except fixed to their values at the global maximum likelihood, we attribute a total contribution in quadrature of 0.02 to the error on due to the combined statistical uncertainties in mistag fractions, resolution and background parameters. The dominant sources of systematic error are the parameterization of the resolution function (0.03), due in part to residual uncertainties in SVT alignment, possible differences in the mistag fractions between the and samples (0.03), and uncertainties in the level, composition, and asymmetry of the background in the selected events (0.02). The systematic errors from uncertainties in and and from the parameterization of the background in the sample are small; an increase of in the value for decreases by 0.015.

The large sample of reconstructed events allows a number of consistency checks, including separation of the data by decay mode, tagging category and flavor. The results of fits to these subsamples are shown in Table 2. Table 2 also shows results of fits to the samples of non- decay modes, where no statistically significant asymmetry is found. Performing the current analysis on the previously published data sample and decay modes yields a value of =0.320.18, consistent with the published value [9]. For only these decay modes, the year 2001 data yield =0.830.23, consistent with the 1999-2000 results at the 1.8 level; for the channel the consistency is at the 1.4 level.
If is allowed to float in the fit to the sample, which has high purity and requires minimal assumptions on the effect of backgrounds, the value obtained is . The sources of the systematic error in this measurement are the same as in the analysis. In this fit, the coefficient of the term in Eq. 6 is measured to be (stat) in agreement with Table 2.
The measurement of establishes violation in the meson system at the level. This significance is computed from the sum in quadrature of the statistical and additive systematic errors. The probability of obtaining this value or higher in the absence of violation is less than . This direct measurement is consistent with the range implied by measurements and theoretical estimates of the magnitudes of CKM matrix elements [10].
7 Conclusions and prospects
37 years after the discovery of violation in the Kaon system, BABAR has established violation in the system with the measurement:
By the summer of 2002 BABAR will have a data sample of more than 100 million pairs, bringing the precision on to less than 0.1 and allowing searches for other manifestations of violation in the system.
References
- [1] J.H. Christenson et al., Phys. Rev. Lett. 13, 138 (1964).
- [2] N. Cabibbo, Phys. Rev. Lett. 10, 531 (1963); M. Kobayashi and T. Maskawa, Prog. Th. Phys. 49, 652 (1973).
- [3] BABAR Collaboration, B. Aubert et al., SLAC-PUB-8569, hep-ex/0105044, to appear in Nucl. Instr. and Methods.
- [4] CPLEAR Collabration, A. Apostolakis et al., Phys. Lett. 456, 297 (1999).
- [5] ARGUS collaboration, H. Albrecht et al., Phys. Lett. 185, 218(1987).
- [6] BABAR Collaboration, B. Aubert et al., SLAC-PUB-8898, hep-ex/0107049, submitted to Phys. Rev. Lett.
- [7] See, for example, L. Wolfenstein, Eur. Phys. Jour. C 15, 115 (2000).
- [8] Particle Data Group, D.E. Groom et al., Eur. Phys. Jour. C 15, 1 (2000).
- [9] BABAR Collaboration, B. Aubert et al., Phys. Rev. Lett. 86, 2515 (2001).
- [10] See, for example, F.J. Gilman, K. Kleinknecht and B. Renk, Eur. Phys. Jour. C 15, 110 (2000); for some further interpretation, with different statistical approaches, see A. Höcker et al., Eur. Phys. Jour. C 21,1 225-259 (2001) and M. Ciuchini et al., JHEP, 07(2001)013, and references therein.