Measurement of the Lifetime
Abstract
The lifetime is measured using 9.0 fb-1 of annihilation data collected on and just below the resonance with the CLEO II.V detector at CESR. This is the first measurement of the lifetime from a collider experiment. Using an unbinned maximum likelihood fit, the lifetime is measured to be fs. The precision of this measurement is comparable to previous measurements carried out by fixed target experiments with different sources of systematic uncertainties.
A. H. Mahmood,1 S. E. Csorna,2 I. Danko,2 Z. Xu,2 G. Bonvicini,3 D. Cinabro,3 M. Dubrovin,3 S. McGee,3 A. Bornheim,4 E. Lipeles,4 S. P. Pappas,4 A. Shapiro,4 W. M. Sun,4 A. J. Weinstein,4 G. Masek,5 H. P. Paar,5 R. Mahapatra,6 R. J. Morrison,6 H. N. Nelson,6 R. A. Briere,7 G. P. Chen,7 T. Ferguson,7 G. Tatishvili,7 H. Vogel,7 N. E. Adam,8 J. P. Alexander,8 C. Bebek,8 K. Berkelman,8 F. Blanc,8 V. Boisvert,8 D. G. Cassel,8 P. S. Drell,8 J. E. Duboscq,8 K. M. Ecklund,8 R. Ehrlich,8 R. S. Galik,8 L. Gibbons,8 B. Gittelman,8 S. W. Gray,8 D. L. Hartill,8 B. K. Heltsley,8 L. Hsu,8 C. D. Jones,8 J. Kandaswamy,8 D. L. Kreinick,8 A. Magerkurth,8 H. Mahlke-Krüger,8 T. O. Meyer,8 N. B. Mistry,8 E. Nordberg,8 M. Palmer,8 J. R. Patterson,8 D. Peterson,8 J. Pivarski,8 D. Riley,8 A. J. Sadoff,8 H. Schwarthoff,8 M. R .Shepherd,8 J. G. Thayer,8 D. Urner,8 B. Valant-Spaight,8 G. Viehhauser,8 A. Warburton,8 M. Weinberger,8 S. B. Athar,9 P. Avery,9 C. Prescott,9 H. Stoeck,9 J. Yelton,9 G. Brandenburg,10 A. Ershov,10 D. Y.-J. Kim,10 R. Wilson,10 K. Benslama,11 B. I. Eisenstein,11 J. Ernst,11 G. D. Gollin,11 R. M. Hans,11 I. Karliner,11 N. Lowrey,11 M. A. Marsh,11 C. Plager,11 C. Sedlack,11 M. Selen,11 J. J. Thaler,11 J. Williams,11 K. W. Edwards,12 R. Ammar,13 D. Besson,13 X. Zhao,13 S. Anderson,14 V. V. Frolov,14 Y. Kubota,14 S. J. Lee,14 S. Z. Li,14 R. Poling,14 A. Smith,14 C. J. Stepaniak,14 J. Urheim,14 S. Ahmed,15 M. S. Alam,15 L. Jian,15 M. Saleem,15 F. Wappler,15 E. Eckhart,16 K. K. Gan,16 C. Gwon,16 T. Hart,16 K. Honscheid,16 D. Hufnagel,16 H. Kagan,16 R. Kass,16 T. K. Pedlar,16 J. B. Thayer,16 E. von Toerne,16 T. Wilksen,16 M. M. Zoeller,16 S. J. Richichi,17 H. Severini,17 P. Skubic,17 S.A. Dytman,18 S. Nam,18 V. Savinov,18 S. Chen,19 J. W. Hinson,19 J. Lee,19 D. H. Miller,19 V. Pavlunin,19 E. I. Shibata,19 I. P. J. Shipsey,19 D. Cronin-Hennessy,20 A.L. Lyon,20 C. S. Park,20 W. Park,20 E. H. Thorndike,20 T. E. Coan,21 Y. S. Gao,21 F. Liu,21 Y. Maravin,21 I. Narsky,21 R. Stroynowski,21 J. Ye,21 M. Artuso,22 C. Boulahouache,22 K. Bukin,22 E. Dambasuren,22 R. Mountain,22 T. Skwarnicki,22 S. Stone,22 and J.C. Wang22
1University of Texas - Pan American, Edinburg, Texas 78539
2Vanderbilt University, Nashville, Tennessee 37235
3Wayne State University, Detroit, Michigan 48202
4California Institute of Technology, Pasadena, California 91125
5University of California, San Diego, La Jolla, California 92093
6University of California, Santa Barbara, California 93106
7Carnegie Mellon University, Pittsburgh, Pennsylvania 15213
8Cornell University, Ithaca, New York 14853
9University of Florida, Gainesville, Florida 32611
10Harvard University, Cambridge, Massachusetts 02138
11University of Illinois, Urbana-Champaign, Illinois 61801
12Carleton University, Ottawa, Ontario, Canada K1S 5B6
and the Institute of Particle Physics, Canada
13University of Kansas, Lawrence, Kansas 66045
14University of Minnesota, Minneapolis, Minnesota 55455
15State University of New York at Albany, Albany, New York 12222
16Ohio State University, Columbus, Ohio 43210
17University of Oklahoma, Norman, Oklahoma 73019
18University of Pittsburgh, Pittsburgh, Pennsylvania 15260
19Purdue University, West Lafayette, Indiana 47907
20University of Rochester, Rochester, New York 14627
21Southern Methodist University, Dallas, Texas 75275
22Syracuse University, Syracuse, New York 13244
Charm baryon lifetime measurements provide insight into the dynamics of non-perturbative heavy quark decays. The theoretical situation is rich with possibilities. Unlike the case of charm mesons the exchange mechanism is not helicity suppressed and therefore can be comparable in magnitude to the spectator diagram. In addition, color suppression is only active for particular decay channels. Thus spectator decays alone can not account for the hadronic width in charm baryon decay. The hadronic width is modified by at least three effects: (a) destructive interference between external and internal spectator diagrams, (b) constructive interference between internal spectator diagrams, and (c) -exchange diagrams. Effects (a) and (b) are expected to be operative in the decay of the , (a) and (c) play a role in decay. While several models [1, 2] can account for the apparent lifetime hierarchy, , experimental results are necessary to advance our understanding of the various contributions to the hadronic width.
The lifetimes of the charm baryons are not measured as precisely as those of the charm mesons (, , ) which are measured, by individual experiments [3], to a precision of 1 - 3%. The lifetime is the most precisely measured of the charm baryons. Recently, CLEO and SELEX measured this lifetime to a precision of 5% [4, 5]. Other charm baryon lifetimes (, , and ) are measured to 15-30% uncertainty [3]. This Rapid Communication presents CLEO’s measurement of the lifetime. This is the first measurement of the lifetime from an colliding beam experiment; all other measurements are from fixed target experiments. Thus, many of the backgrounds and systematic uncertainties encountered in this work differ from those found in the fixed target environment.
This analysis uses an integrated luminosity of 9.0 fb-1 of annihilation data taken with the CLEO II.V detector at the Cornell Electron Storage Ring (CESR). The data were taken at energies at and below the (4S) resonance ( =10.58 GeV) and include 11 events. This measurement relies heavily on the charged particle tracking capabilities of the CLEO II.V detector [6]. The precise location of both primary and secondary vertices is greatly aided by a small-radius, low-mass beam pipe surrounded by a three-layer double-sided silicon strip tracker [7]. The trajectories of charged particles are reconstructed using two drift chambers in addition to the silicon strip tracker. For this data set the main drift chamber uses a 60:40 mixture of helium-propane gas in place of its previous 50:50 argon-ethane mix. This change in gas improves both the hit efficiency and specific ionization resolution while at the same time decreases the effects of multiple scattering. A Kalman filter algorithm [8] is used to reconstruct the three dimensional trajectories of charged particles. The response of the detector to both signal and background events is modeled in detail using the GEANT [9] Monte Carlo package.
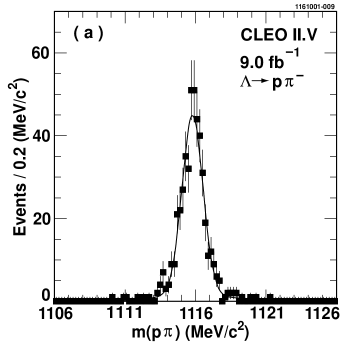
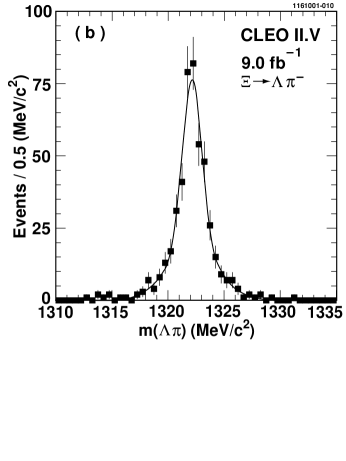
The is reconstructed from the decay mode. Each is reconstructed using the mode while baryons are reconstructed from (the charge conjugate mode is implied throughout this paper). For this analysis, we assume the is produced at the primary event vertex and is not a decay product of another weakly decaying particle. The number of baryons from weakly decaying higher mass states such as and doubly charmed baryons [10] is estimated to be less than one event.
In the CLEO environment the dimensions () of the beam profile are 1 cm along the beam line, , 350 m along the horizontal direction perpendicular to the beam line, , and 7 m () along the vertical direction, . Because the typical decay length of a ( m) is significantly less than the beam extent in and essentially all useful decay length information comes from the -coordinate. We determine each candidate’s proper time, , and proper time uncertainty, , from
| (1) |
and
| (2) |
In the above equations the mass, , is set to the PDG [3] value of 2466.3 MeV/. A best-fit decay vertex of the pseudo-track and the two ’s determines and its uncertainty, . The production point of a cannot be well measured on an event-by-event basis. Instead we use a combination of the known CESR beam profile and a measurement of the beam centroid to provide the estimate of the production point. A run-averaged collision point of the beams, , is used to estimate . The uncertainty in , , is also calculated run-by-run. The ’s component of momentum in the direction, , is calculated from the momenta of its decay products.
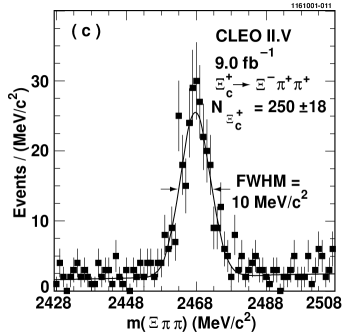
While much of the selection criteria are similar to that of previous CLEO charm baryon analyses [11, 12, 13] some additional requirements suited for a lifetime measurement are imposed. To select high momentum candidates and reduce backgrounds related to -meson decays we require the momentum to be greater than half its maximum allowed value. For each candidate we impose 1.5 ps. A minimum vertex probability of 0.001 (based on the vertex ) is required to obtain a sample of well-defined decay lengths. To ensure that only one candidate per event is used, the candidate with the smallest vertex is chosen in the events where multiple candidates pass all other selection criteria ( 7% of events). Fig. 1 shows the , , and reconstructed mass distributions for candidates used in the lifetime analysis. A fit of the mass distribution using one Gaussian for the signal and a linear function for the background yields reconstructed ’s and a Gaussian of 4.3 MeV/. The fraction of background within of the fitted mass is 12.8%. The average flight path in the direction of the ’s used in this analysis is 100 m. The efficiency of the selection cuts for detecting signal Monte Carlo events, including (not including) acceptance, is 7.6% (17%). Events within 40 MeV/ of the mean reconstructed mass (2468 MeV/), as shown in Fig. 1(c), are used in the determination of the lifetime. This wide mass region is used to estimate the non- contribution to the lifetime.
The lifetime is obtained from an unbinned maximum likelihood fit to the proper time distribution. The likelihood function is
with the product over all candidates, and .
There are three inputs to the fit for each candidate: the measured proper time, , the estimated uncertainty in the proper time, , and a mass dependent signal probability, . The signal probability distribution is obtained from a fit to the mass distribution.
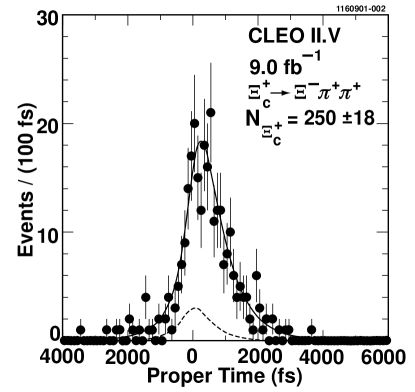
The proper time distribution is parameterized as consisting of signal events with lifetime, , a fraction, , of background events with non-zero lifetime, , from charm backgrounds, and the remaining background events with zero lifetime. The likelihood function allows for a global scale factor, , for the proper time uncertainties. The likelihood function also accounts for events in which the proper time uncertainty is underestimated by fitting for a and fraction, (caused by non-Gaussian multiple scattering, for instance) and also a fraction, of events with a fixed = 8 ps to account for proper time outliers.
The unbinned maximum likelihood fit yields a signal lifetime, fs. The proper time distribution and the unbinned maximum likelihood fit are shown in Fig. 2.
In order to check the consistency of this lifetime result the analysis procedure is repeated as a function of charge, azimuthal angle, polar angle, momentum, silicon detector hit criteria, and data taking period. In all cases the lifetimes are statistically consistent.
The contributions to the systematic error are given in Table I and are discussed below.
| Contribution | Uncertainty (fs) |
|---|---|
| mass uncertainty | |
| momentum scale | |
| global detector size & decay length bias | |
| signal probability | |
| proper time outliers | |
| beam position | |
| proper time - mass correlation | |
| Monte Carlo statistics | |
| fit mass region | |
| Total |
The uncertainty of the mass could be a source of bias in the lifetime measurement as this mass is used to determine the proper time. The PDG [3] uncertainty of the mass of 1.4 MeV/ yields a systematic error contribution of fs. The systematic bias of the momentum from an incorrect magnetic field could yield a systematic shift in the reconstructed masses. Such a shift would then cause a bias in the lifetime measurement. We estimate this systematic error contribution due to a possible momentum scale shift to be fs.
The global detector size and beam pipe geometry is studied to understand their contribution to the systematic error in the lifetime. The results of the study yield a lifetime uncertainty of 0.1% resulting in a systematic error contribution of 0.5 fs. The potential bias in the decay length measurement is determined by measuring the average decay length of a “zero-lifetime” sample of events. Here we use data consistent with the two photon process . We measure an average decay length of 0.9 m and use the uncertainty in this measurement to calculate the contribution to the total systematic error. The average of the quotient of 0.9 and the for each candidate is 2.5 fs. We take this to be the estimate of the proper time bias due to a decay length bias. Adding these two systematic errors in quadrature yields 2.5 fs.
The signal probability, , contribution to the systematic error is obtained from differences in the fitted lifetime values when the signal probability is varied by . This study yields a systematic error of fs.
The proper time outlier contribution is obtained from the maximal difference of lifetimes from the following three methods of accounting for outliers: a) a = 8 ps contribution in the likelihood function (this is the nominal method of accounting for proper time outliers), b) a = 16 ps contribution in the likelihood function, and c) a proper time cut (absolute value) of less than 4 ps and no contribution to the likelihood function. The maximal difference between these three methods is 3.3 fs which is taken as the proper time outlier systematic error.
The beam position systematic error estimates the variation in the lifetime when the beam position is shifted from its true position. Shifting the beam spot location subsequently shifts decay length and proper time measurements. For an infinite data sample in a perfectly isotropic detector, a shift in the beam position would not affect a lifetime measurement as it would average out to zero. A possible lifetime bias can be estimated by measuring the lifetime after shifting the beam spot location. The beam spot location is shifted by various amounts, and in the vicinity of zero shift, the slope of the change in lifetime vs. the change in beam position location is 3.5 fs/. Multiplying this slope by , the typical , yields a systematic error of 7 fs.
There is a correlation between the measured proper time and reconstructed mass of a charm meson or baryon. This correlation is due to the mis-measurement of the opening angle(s) between the daughter tracks in a short-lived decay. An overestimate of the opening angle(s) tends to bias the measured proper time and mass to larger values of these quantities. This proper time - mass correlation is measured in both simulated signal events and data, and the correlations of both samples are consistent with each other. The proper time vs. mass contribution to the systematic error is obtained by multiplying the slope of the lifetime vs. measured reconstructed mass by the of the central mass value. This contribution to the systematic uncertainty is 7.2 fs.
In order to check for other sources that could bias the lifetime measurement, e.g. event selection and likelihood function parameterization, a sample consisting of background events extracted from CLEO II.V data and simulated events is studied. The relative amount of signal and background component in the sample is arranged to be the same as that of the full CLEO II.V data set. This data set is run through the full analysis and the lifetime extracted from the maximum likelihood fit is compared with the input lifetime (449.0 fs). This procedure yields a lifetime of 443.2 9.2 fs, 5.8 fs lower than the input Monte Carlo signal lifetime. The statistical uncertainty in this measurement, 9.2 fs, is included as a component of the total systematic error (“Monte Carlo statistics”) in Table I. The 5.8 fs difference between the input and output signal Monte Carlo lifetime is applied as a correction to the lifetime value from the CLEO II.V data.
To estimate the systematic error due to the mass range used in the maximum likelihood fit (40 MeV/) a study is performed where the mass interval is varied and the lifetime recalculated. This tests the sensitivity of the lifetime to the background events used in the maximum likelihood fit. A variety of mass intervals are used in the study including narrower intervals (e.g. 20 MeV/), wider intervals (e.g. 60 MeV/) and asymmetric intervals (e.g. 60,+40 MeV/). From the results of this study a systematic error of 10 fs is assigned due to the mass region used in the maximum likelihood fit.
The final measured lifetime value (statistical error only) is fs. The total systematic uncertainty of 18 fs is obtained by adding all the contributions listed in Table I in quadrature.
A new measurement of the lifetime, fs, has been made using the CLEO II.V detector and 9.0 fb-1 of integrated luminosity. This is the first lifetime measurement from an experiment. Many of the contributions to the systematic error in this measurement are different from those of fixed target experiments. This result is higher than the current world average, fs as is the FOCUS collaboration’s result of fs [14]. We can combine our result with the recent CLEO II.V measurement [4] of the lifetime, fs to obtain . The CLEO II.V ratio is higher than the expectations, , from the models based on a expansion [1, 2].
We gratefully acknowledge the effort of the CESR staff in providing us with excellent luminosity and running conditions. M. Selen thanks the PFF program of the NSF and the Research Corporation, and A.H. Mahmood thanks the Texas Advanced Research Program. This work was supported by the National Science Foundation, the U.S. Department of Energy, and the Natural Sciences and Engineering Research Council of Canada.
REFERENCES
- [1] B. Blok and M. Shifman, in: Proceedings of the Third Workshop on the Physics at a Tau-Charm Factory, Marbella, Spain, June 1993, R. and J. Kirkby (eds.), Editions Frontieres, 1994.
- [2] B. Guberina and B. Melic, Eur. Phys. J. C 2, 697, (1998).
- [3] Particle Data Group, D. E. Groom et al., Eur. Phys. J. C 15, (2000).
- [4] CLEO Collaboration, A. Mahmood et al., Phys. Rev. Lett. 86, 2232 (2001).
- [5] SELEX Collaboration, A. Kushnirenko et al., Phys. Rev. Lett. 86, 5243 (2001).
- [6] CLEO Collaboration, Y. Kubota et al., Nucl. Instrum. Methods Phys. Res., Sect A 320, 66 (1992).
- [7] T. Hill, Nucl. Instrum. Methods Phys. Res., Sect A 418, 32 (1998).
- [8] P. Billoir, Nucl. Instrum. Methods Phys. Res., Sect A 225, 352 (1984).
- [9] R. Brun et al., GEANT 3.15, CERN Report No. DD/EE/84-1 (1987).
- [10] V. V. Kiselev, A. K. Likhoded, and M. V. Shevlyagin, Phys. Lett. B332, 411 (1994).
- [11] CLEO Collaboration, C. P. Jessop et al., Phys. Rev. Lett. 82, 492 (1999).
- [12] CLEO Collaboration, J. P. Alexander et al., Phys. Rev. Lett. 83, 3390 (1999).
- [13] CLEO Collaboration, D. Cronin-Hennessy et al., Phys. Rev. Lett. 86, 3730 (2001).
- [14] FOCUS Collaboration, J. M. Link et al., submitted for publication in Phys. Lett. B (FERMILAB-Pub-01/296-E), hep-ex/0110002 (2001).