Observation of and
Abstract
We have studied the color-suppressed hadronic decays of neutral B mesons into the final states D(∗)0. Using 9.67 million pairs collected with the CLEO detector, we observe the decays and with the branching fractions () = (0.55)10-4 and () = (0.79)10-4. The first error is statistical and the second systematic. The statistical significance of the signal is 12.1 (5.9 for ). Utilizing the branching fractions we determine the strong phases between isospin 1/2 and 3/2 amplitudes in the and final states to be =0.890.08 and =0.890.08, respectively.
pacs:
13.25.HwT. E. Coan,1 Y. S. Gao,1 F. Liu,1 Y. Maravin,1 I. Narsky,1 R. Stroynowski,1 J. Ye,1 M. Artuso,2 C. Boulahouache,2 K. Bukin,2 E. Dambasuren,2 R. Mountain,2 T. Skwarnicki,2 S. Stone,2 J.C. Wang,2 A. H. Mahmood,3 S. E. Csorna,4 I. Danko,4 Z. Xu,4 G. Bonvicini,5 D. Cinabro,5 M. Dubrovin,5 S. McGee,5 A. Bornheim,6 E. Lipeles,6 S. P. Pappas,6 A. Shapiro,6 W. M. Sun,6 A. J. Weinstein,6 G. Masek,7 H. P. Paar,7 R. Mahapatra,8 R. J. Morrison,8 H. N. Nelson,8 R. A. Briere,9 G. P. Chen,9 T. Ferguson,9 G. Tatishvili,9 H. Vogel,9 N. E. Adam,10 J. P. Alexander,10 C. Bebek,10 K. Berkelman,10 F. Blanc,10 V. Boisvert,10 D. G. Cassel,10 P. S. Drell,10 J. E. Duboscq,10 K. M. Ecklund,10 R. Ehrlich,10 L. Gibbons,10 B. Gittelman,10 S. W. Gray,10 D. L. Hartill,10 B. K. Heltsley,10 L. Hsu,10 C. D. Jones,10 J. Kandaswamy,10 D. L. Kreinick,10 A. Magerkurth,10 H. Mahlke-Krüger,10 T. O. Meyer,10 N. B. Mistry,10 E. Nordberg,10 M. Palmer,10 J. R. Patterson,10 D. Peterson,10 J. Pivarski,10 D. Riley,10 A. J. Sadoff,10 H. Schwarthoff,10 M. R .Shepherd,10 J. G. Thayer,10 D. Urner,10 B. Valant-Spaight,10 G. Viehhauser,10 A. Warburton,10 M. Weinberger,10 S. B. Athar,11 P. Avery,11 C. Prescott,11 H. Stoeck,11 J. Yelton,11 G. Brandenburg,12 A. Ershov,12 D. Y.-J. Kim,12 R. Wilson,12 K. Benslama,13 B. I. Eisenstein,13 J. Ernst,13 G. D. Gollin,13 R. M. Hans,13 I. Karliner,13 N. Lowrey,13 M. A. Marsh,13 C. Plager,13 C. Sedlack,13 M. Selen,13 J. J. Thaler,13 J. Williams,13 K. W. Edwards,14 R. Ammar,15 D. Besson,15 X. Zhao,15 S. Anderson,16 V. V. Frolov,16 Y. Kubota,16 S. J. Lee,16 S. Z. Li,16 R. Poling,16 A. Smith,16 C. J. Stepaniak,16 J. Urheim,16 S. Ahmed,17 M. S. Alam,17 L. Jian,17 M. Saleem,17 F. Wappler,17 E. Eckhart,18 K. K. Gan,18 C. Gwon,18 T. Hart,18 K. Honscheid,18 D. Hufnagel,18 H. Kagan,18 R. Kass,18 T. K. Pedlar,18 J. B. Thayer,18 E. von Toerne,18 M. M. Zoeller,18 S. J. Richichi,19 H. Severini,19 P. Skubic,19 S.A. Dytman,20 S. Nam,20 V. Savinov,20 S. Chen,21 J. W. Hinson,21 J. Lee,21 D. H. Miller,21 V. Pavlunin,21 E. I. Shibata,21 I. P. J. Shipsey,21 D. Cronin-Hennessy,22 A.L. Lyon,22 C. S. Park,22 W. Park,22 and E. H. Thorndike22
1Southern Methodist University, Dallas, Texas 75275
2Syracuse University, Syracuse, New York 13244
3University of Texas - Pan American, Edinburg, Texas 78539
4Vanderbilt University, Nashville, Tennessee 37235
5Wayne State University, Detroit, Michigan 48202
6California Institute of Technology, Pasadena, California 91125
7University of California, San Diego, La Jolla, California 92093
8University of California, Santa Barbara, California 93106
9Carnegie Mellon University, Pittsburgh, Pennsylvania 15213
10Cornell University, Ithaca, New York 14853
11University of Florida, Gainesville, Florida 32611
12Harvard University, Cambridge, Massachusetts 02138
13University of Illinois, Urbana-Champaign, Illinois 61801
14Carleton University, Ottawa, Ontario, Canada K1S 5B6
and the Institute of Particle Physics, Canada
15University of Kansas, Lawrence, Kansas 66045
16University of Minnesota, Minneapolis, Minnesota 55455
17State University of New York at Albany, Albany, New York 12222
18Ohio State University, Columbus, Ohio 43210
19University of Oklahoma, Norman, Oklahoma 73019
20University of Pittsburgh, Pittsburgh, Pennsylvania 15260
21Purdue University, West Lafayette, Indiana 47907
22University of Rochester, Rochester, New York 14627
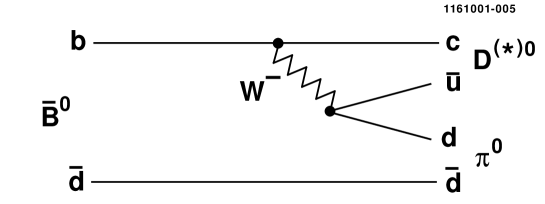
The decay proceeds predominantly through the internal spectator diagram shown in Fig. 1. This diagram is color-suppressed, since the color of the quark-pair originating from the W decay must match the color of the other quark pair. The rate of relative to is suppressed, crudely, by one factor of (1/3)2, and an additional due to the projection of the state onto the pion wave function [1]. This gives a total suppression of 1/18 compared to the color-favored decay modes. Detailed theoretical calculations [2] predict an even larger suppression of about a factor 1/50.
So far the only established color-suppressed decays are two-body B decays into Charmonium plus neutral hadrons. A measurement of is therefore a benchmark test for theoretical models of hadronic B decays[1, 2]. An investigation of color-suppressed decays into a D meson and light neutral mesons other than a is currently underway and will be addressed in a future publication.
The observation of completes the measurement of final states and allows us to extract the strong phase difference between isospin 1/2 and 3/2 amplitudes [2, 3].
In this Letter we present the observation of , superseding the limits from our previous publication [4]. Our new analysis has significantly increased statistics and is based on a data sample with improved calibration and track reconstruction. The background shapes and the signal separation power have also been significantly improved. Charge conjugates are implied throughout the paper. Our analysis uses e+e- annihilation data recorded with the CLEO detector at the Cornell Electron Storage Ring. The integrated luminosity of our data sample is 9.15 fb-1 for data collected on the (on-resonance), corresponding to 9.67 million pairs, and 4.35 fb-1 collected 60 MeV below the threshold (off-resonance), which is used for background studies.
CLEO is a general purpose solenoidal magnet detector. Data were recorded with two detector configurations, CLEO II and CLEO II.V [5, 6]. Cylindrical drift chambers in a 1.5T solenoidal magnetic field measure momentum and specific ionization (dE/dx) of charged particles. Photons are detected using a CsI(Tl) crystal electromagnetic calorimeter, consisting of a barrel-shaped central part of 6144 crystals and 1656 crystals in the forward regions of the detector (endcaps). In the II.V configuration the innermost chamber was replaced by a three-layer, double-sided silicon microvertex detector, and the main drift chamber gas was changed from argon-ethane to a helium-propane mixture. As a result of these modifications, the CLEO II.V part of the data (2/3 of the total sample) has improved momentum resolution and particle identification.
B mesons were reconstructed by selecting high-momentum D(∗)0 and mesons. Track quality requirements are imposed on charged tracks and the purity of pion and kaons is improved by using dE/dx information whenever available. The candidates are reconstructed from isolated electromagnetic clusters of at least 30 MeV in the barrel region and 50 MeV in the endcaps. The mass resolution is 8 MeV in the barrel region and 10 MeV in the endcaps. We require that the candidate’s mass is within standard deviations () of the nominal mass. Prompt ’s from B decays are required to have a momentum larger than 1.8 GeV.
mesons are selected in the decay modes , and . The invariant mass of the D daughter particles is required to be within of the known mass. The mass resolution depends on the decay mode and is between 6 and 12 MeV. The momentum of the is required to be larger than 1.65 GeV. In the mode we suppress combinatorial background by using only certain regions of the Dalitz plane.
mesons are selected in the decay modes and . To reduce the combinatorial background in the decay mode we require that the decays into . We require that the mass difference m-m is within of the known value and that the momentum of the is larger than 1.8 GeV. The kinematic resolution of and D(∗)0 candidates is improved by a mass-constrained kinematic fit.
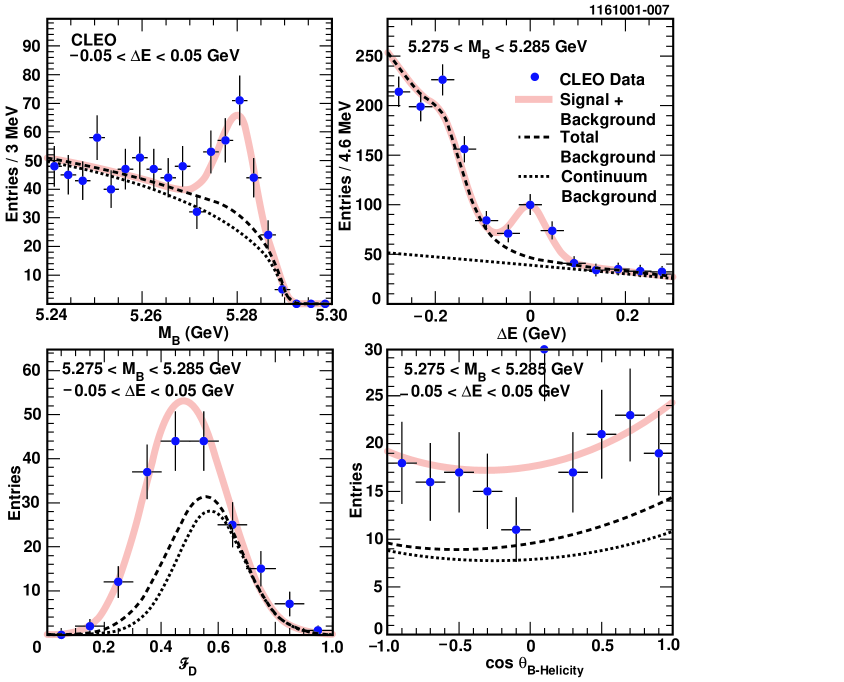
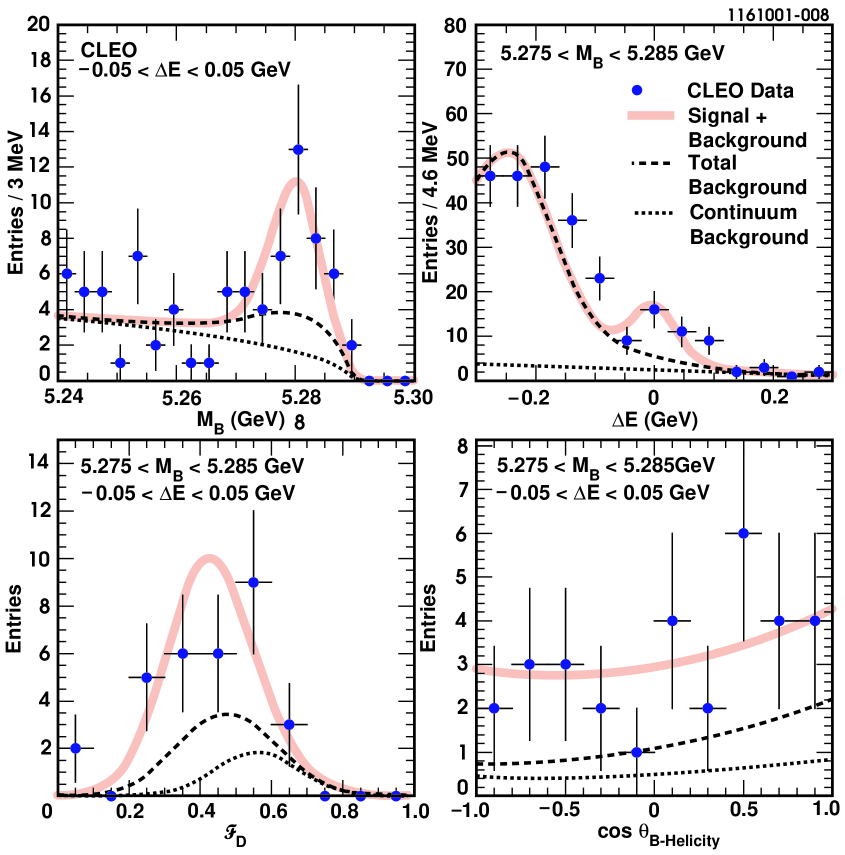
B decay candidates are selected from and D(∗)0 pairings that have no electromagnetic clusters in common. B candidates are identified using a beam-constrained mass , where is the beam energy and is the B candidate momentum, and an energy difference , where and are the energies of the D(∗)0 and . The resolution in depends on the D decay mode and is between 3.5 and 4 MeV. The resolution is dominated by the beam energy spread and the energy resolution. The resolution in is between 35 and 40 MeV. The energy resolution is slightly asymmetric due to the energy loss out of the back of the CsI crystals. The mass-constrained kinematic fit to the pion 4-momentum compensates for most of this effect. We accept B candidates with above 5.24 GeV and 300 MeV. To better suppress background from events (continuum background), several event shape variables are combined into a Fisher discriminant [7]. For events (continuum background), the distribution is almost a Gaussian and has its maximum at 0.42 (0.57). The standard deviation is 0.11 (0.12). The separation between the and continuum distributions is 1.3 . We reject clear continuum events by requiring 1. For each candidate we calculate the sphericity vectors[8] of the B daughter particles and of the rest of the event. We require the cosine of the angle between these two vectors to be within -0.8 and 0.8. The distribution of this angle is strongly peaked at 1 for continuum background and is nearly flat for events.
The number of signal events in the sample is obtained from unbinned, extended maximum likelihood fits. The free parameters of the fits are the number of signal events, background from B decays () and from continuum e+e- annihilation (continuum). Four variables are used as input to the maximum likelihood fit: the beam-constrained mass , the energy difference , the Fisher Discriminant , and the cosine of the decay angle of the B , defined as the angle between the D(∗) momentum and the B flight direction calculated in the B rest frame.
In each of the fits, the likelihood of the B candidate is the sum of probabilities for the signal and two background hypotheses with relative weights maximizing the likelihood. The probability of a particular hypothesis is the product of probability density functions (PDFs) for each of the input variables. The PDFs for are represented by a bifurcated Gaussian[9] for signal, an empirical shape, , with , for continuum and a Gaussian on top of the empirical background shape***The parameters of the empirical shapes for and Continuum background are different. for ; the PDFs for are the sum of two Gaussians with a common mean (signal), 1st-order polynomial (continuum) and a sum of two Gaussians plus a 1st-order polynomial (); the PDFs for are the sum of two Gaussians with a common mean; and the PDFs for are 2nd-order polynomials. The PDF parameters are determined from off-resonance CLEO data (continuum) and from high-statistics Monte-Carlo (MC) samples (signal and ).
Monte Carlo experiments are generated to test the fitting procedure and to obtain the relation between fit yield and signal branching fractions. The experiments are repeated several hundred times with different Monte Carlo test samples randomly selected from high-statistics MC samples.
We summarize the results of the fits to CLEO data in Table I. We give results for all B decay modes, corresponding D decay modes and the combination of all D decay modes. We combine the results for different D decay modes by adding the log likelihood as a function of the branching fraction. Branching fractions for each mode are obtained via
The number of plus , =9.67 M 0.10 M, is derived assuming equal branching fractions for charged and neutral B meson decays [10]. The uncertainty in the branching fractions of the is taken into account in the systematics. The significances of the observed signals in the seven fits is determined from the change in -2 when refit with the signal yield constrained to zero: . We obtain a total significance of 12.1 for and 5.9 for . Varying the PDF shapes within the systematic errors to obtain the lowest signal yield, the statistical significance is reduced to 9.4 () and 4.2 (). We obtain branching fractions of = and = . The first error is statistical and the second error systematic. Our result for is higher than the previous CLEO upper limit [4]. We ascribe this disagreement, which is of the order of , partly to a statistical fluctuation and partly to the description of the -background in the old CLEO publication.
We consider sources of systematic uncertainties from the PDF shapes, D and branching ratios, luminosity, possible fit bias, B candidate reconstruction and cross-feed between different modes. The dominant systematic uncertainty comes from the PDF shapes. The systematic uncertainty on the shapes is derived by varying the PDF shapes within the statistical errors of the fit parametrization as well as comparing the CLEO data in the and sideband regions to the PDF shapes and taking differences as systematic errors. Figures 2 and 3 show our results for with the number of signal, and Continuum background as free parameters of the fit. The fit result is projected into a signal region, defined in the - plane as GeV, GeV. The fit results describe the data well. The background in the sidebands is also well modeled by the fit.
| Fit Yield | Signifi- | (D(∗)) | (D(∗)0) | |||
| Mode | (Events) | cance() | (%) | (%) | (10-4) | |
| 8.5 | 37.1 | 3.82 | 2.740.53 | |||
| 6.8 | 13.5 | 12.94 | 2.490.53 | |||
| 5.3 | 19.0 | 7.48 | 3.250.78 | |||
| Averaged () | 12.1 | |||||
| , | 2.4 | 15.3 | 2.36 | 1.950.91 | ||
| , | 2.8 | 5.5 | 8.01 | 1.720.94 | ||
| , | 3.1 | 8.1 | 4.63 | 2.211.15 | ||
| , | 3.4 | 11.4 | 1.46 | 3.991.89 | ||
| Averaged () | 5.9 | |||||
The observation of completes the measurement of D final states. This allows us to calculate the relative phase between the isospin 1/2 and 3/2 amplitudes in the D system. The basic relation can be expressed in an amplitude triangle: , following the formulation in [3]. With the PDG values [11] () = (535)10-4, () = (304)10-4, () = (464)10-4, () = (27.62.1)10-4, = , and our measurement of , we determine the relative phase between the isospin amplitudes to be 0.890.08 for the final state and =0.890.08 for . The ratios of isospin amplitudes are 0.700.11 () and 0.740.08 (). A similar calculation has been performed in [12] using our preliminary results [13] and preliminary results obtained by the Belle collaboration [14].
Models of hadronic B decay [2] have successfully described experimental results using two phenomenological parameters, and , that characterize non-factorizable contributions. Both are believed to be process-dependent but so far experimental data have been consistent with universal values for and . Recent work by Beneke, Buchalla, Neubert and Sachrajda [15] has shown that is only slightly process-dependent. Based on our measurement, we derive a value =0.570.06. Comparing our result to the value from two-body B decays to charmonium, =0.29 [2], the process dependence of is favored [12].
To summarize we observed the color-suppressed decays and . The number of signal events in our data sample was obtained from an unbinned extended maximum likelihood fit in four variables. The measurements of the two branching fractions are () = (0.55)10-4 and () = (0.79)10-4. The first error is statistical and the second systematic. The statistical significance of the signal is 12.1 (5.9 for ).
We gratefully acknowledge the effort of the CESR staff in providing us with excellent luminosity and running conditions. This work was supported by the National Science Foundation, the U.S. Department of Energy, the Research Corporation and the Texas Advanced Research Program.
REFERENCES
- [1] T. E. Browder, K. Honscheid and D. Pedrini, Ann. Rev. Nucl. Part. Sci. 46, 395 (1996).
- [2] M. Neubert and B. Stech in Heavy Flavors, edited by A.J. Buras and M. Lindner (World Scientific, Singapore, 2nd edition 1998).
- [3] J.L. Rosner, Phys. Rev. D 60, 074029 (1999).
- [4] CLEO Collaboration, B. Nemati , Phys. Rev. D 57, 5363 (1998).
- [5] CLEO Collaboration, Y. Kubota , Nucl. Instrum. Methods Phys. Res., A320, 66 (1992).
- [6] T. Hill, Nucl. Instrum. Methods Phys. Res., Sect. A418, 32 (1998).
- [7] CLEO Collaboration, Phys. Rev. Lett. 85, 515 (2000).
- [8] S.L. Wu, Phys. Rep. C 107, 59 (1984).
- [9] A bifurcated Gaussian is a Gaussian with different widths for the left and right part of the curve.
- [10] CLEO Collaboration, Phys.Rev.Lett. 86, 2737 (2001).
- [11] D.E. Groom , (Particle Data Group), Eur. Phys. Jour. C15, 1 (2000) and 2001 partial update for edition 2002 (URL: http://pdg.lbl.gov).
- [12] M. Neubert and A. Petrov, Phys. Lett. B519, 50 (2001).
- [13] E. von Toerne, in Proceedings of International Europhysics Conference on High Energy Physics, Budapest 2001, (to be published).
- [14] R-S. Lu, in Proceedings of International Europhysics Conference on High Energy Physics, Budapest, (to be published), and hep-ex/0107048, Final results by the Belle Collaboration: hep-ex/0109021 (to be published).
- [15] M. Beneke , Nucl.Phys. B591 (2000) 313.