address=Instituto de Física, Facultad de Ingeniería, Universidad de la República, C.C. 30, CP 11300, Montevideo, Uruguay
Light Meson Physics from Charm Decays at Fermilab E791
Abstract
We present recent results on light mesons based on Dalitz plot analyses of charm decays from Fermilab experiment E791. Scalar mesons are found to have large contributions to the decays studied, and . From the final state, we find good evidence for the existence of the light and broad meson and we measure its mass and width. We also discuss recently published results on the 3 final states, especially the measurement of the parameters and the evidence for the meson from . These results demonstrate the importance of charm decays as a new environment for the study of light meson physics.
1 Introduction
The decays of charm mesons are currently a new source of information for the study of light meson spectroscopy, with the advantages of having well defined initial state (the meson, a state with defined mass). This new information is complementary to that from scattering experiments and can be particularly relevant to the understanding of the scalar sector.
Here we present preliminary results for the Dalitz-plot analysis of the Cabibbo-favored decay using data from Fermilab E791 experiment. We also present an overview of our results for ds3pi and d3pi Dalitz-plot analyses. The E791 data was collected in 1991/92 from 500 GeV/c -nucleon interactions. For details see ref791 .
For the analysis, when we include all known resonant channels plus a non-resonant (NR) contribution, we find that the NR decay is dominant. This is unusual in decays. Moreover, the fit model has important discrepancies with respect to the data. By including an extra scalar resonant state, with unconstrained mass and width, we obtain a fit which is substantially superior to that without this state. The values for its mass and width are found to be MeV/c2 and MeV/c2 respectively. We refer to this state as the . The existence of such a state has been greatly discussed in the literature in recent years beveren –cherry . We also obtain new measurements for the mass and the width of the resonance: MeV/c2 and MeV/c2 respectively.
From our analysis of decays, we find that the dominant decay fraction comes from . We obtain new measurements for the and masses and widths. From decays, we find that a model with only known resonances plus a NR channel is not able to describe the data adequately. We find strong evidence for the presence of a light and broad scalar resonance, the , the channel being responsible for half of the decay rate. We measure the mass and the width of this scalar meson to be MeV/ and MeV/, respectively.
2 The Dalitz-plot Analysis
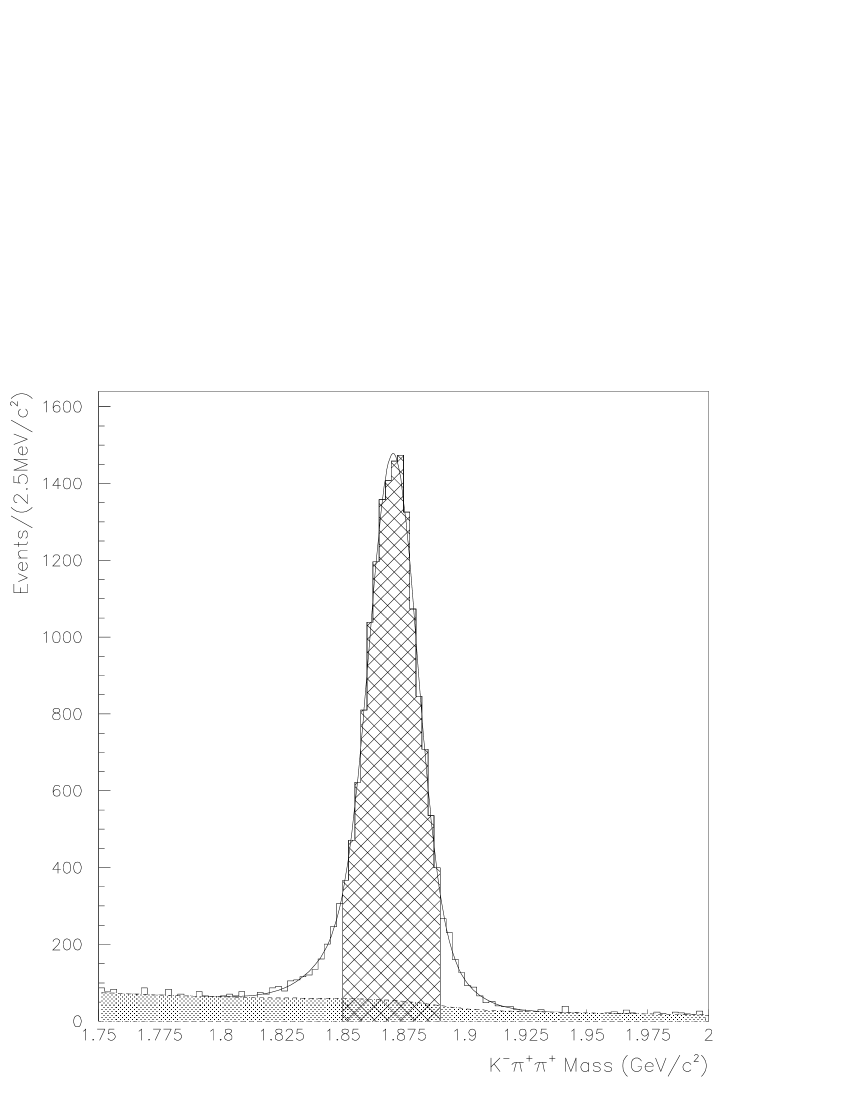
From the original events collected by E791, and after reconstruction and selection criteria, we obtained the sample shown in Figure 1(a). The filled area represents the level of background; besides the combinatorial, the other main source of background comes from the reflection of the decay (through and ). The crosshatched region contains the events selected for the Dalitz-plot analysis. There are 15090 events in this sample, of which 6% are background.
Figure 1(b) shows the Dalitz-plot for these events. The two axes are the squared invariant-mass combinations for , and the plot is symmetrized with respect to the two identical pions. The plot presents a rich structure, where we can observe the clear bands from , and an accumulation of events at the upper edge of the diagonal, due to heavier resonances. To study the resonant substructure, we perform an unbinned maximun-likelihood fit to the data, with probability distribution funtions (PDF’s) for both signal and background sources. In particular, for each candidate event, the signal PDF is written as the square of the total physical amplitude (defined below) and it is weighted for the acceptance across the Dalitz plot (obtained by Monte Carlo (MC)) and by the level of signal to background for each event, as given by the line shape of Figure 1(a). The background PDF’s (levels and shapes) are fixed for the Dalitz-plot fit, according to MC and data studies.

We begin describing our first approach to fit the data, which represents the conventional Dalitz-plot analysis including the known resonant amplitudes (), plus a constant non-resonant contribution. The signal amplitude is constructed as a coherent sum of the various sub-channels:
| (1) |
Each resonant amplitude is written as
| (2) |
where is the relativistic Breit-Wigner propagator
| (3) |
with mass dependent width,
| (4) |
The quantities and are the Blatt-Weisskopf damping factors respectively for the and the resonances, they depend on the radii of the decaying meson and are set to GeV-1 and GeV-1 argus ; is the pion momentum in the resonance rest frame at mass . describes the angular distribution due to the spin of the resonance. See details in d3pi . Finally each amplitude is Bose symmetrized .
Using this model (Model A), we find contributions from the following channels: the non-resonant, responsible for more than 90% of the decay rate, followed by , , and . The decay fractions and relative phases are shown in Table 1. These values are in accordance with previous results from E691 e691-kpipi and E687 e687-kpipi . We thus confirm a high non-resonant contribution according to this model, which is totally unusual in decays. Besides, there is an important destructive interference pattern, since all fractions add up to 140 %.
To evaluate the fit quality of Model A, we compute a two-dimensional in the Dalitz plot, from the difference in densities for the model (from a fast-MC algorithm) and the data. We obtain ( being the number of degrees of freedom), with a corresponding confidence level (CL) of . In Figure 2(a) we show the low and high squared-mass projections for data (error bars) and model (solid line). The discrepancies are evident at the very low-mass region for and near 2.5 (GeV/c2)2 for . These regions of disagreement are the same observed previously by E687 e687-kpipi . We thus conclude that a model with the known resonances, plus a non-resonant amplitude, is not able to describe the Dalitz plot satisfactorily.
A similar pattern – bad fit quality with large NR fraction – is found in the analysis of the decay when allowing only the established resonances d3pi . There we find that the inclusion of an extra scalar resonance improves the fit substantially, giving strong evidence for the . See the section on below. Thus, we are lead to try an extra scalar resonance in our fit model here. The possible existence of a light and broad scalar state has been suggested by many authors beveren ; ishida1 ; black1 ; pelaez ; shakin , some of them believing it would be a member of a light scalar nonet ishida2 ; black2 ; oller ; however, its existence has been the subject of some controversy alsotorn ; aniso ; cherry .
A second fit model, Model B, is constructed by the inclusion of an extra scalar state, with unconstrained mass and width. For consistency, the mass and width of the other scalar state, the , are also free parameters of the fit. We adopt a better description for these scalar states by introducing gaussian-type form-factors torn to take into account the finite size of the decaying mesons. Two extra floating parameters are the meson radii and introduced above.
Using this model, we obtain the values of MeV/c2 for the mass and MeV/c2 for the width of the new scalar state (first error statistical, second error systematic), referred to here as the . The values of mass and width obtained for the are respectively MeV/c2 and MeV/c2, appearing heavier and narrower than presented by the PDG pdg . The decay fractions and relative phases for Model B, with systematic errors, are given in Table 1. Compared to the results of Model A (without ), the non-resonant mode drops from over 90% to 13%. The state is now the dominant channel with about 50%. The meson radii and are found to be respectively GeV-1 and GeV-1, in complete agreement with previous estimates argus ; cleo .
| Decay | Model A: No | Model B: With | ||
|---|---|---|---|---|
| Mode | Fraction (%) | Phase | Fraction (%) | Phase |
| NR | (fixed) | |||
| – | – | |||
| (fixed) | ||||
Moreover, the fit quality of Model B is substantially superior to that of Model A. The is now 0.73 with a CL of 95%. The very good agreement between the model and the data can be seen in the projections of Figure 2(b).


A number of studies were done to check these results. For example, we replaced the complex Breit-Wigner by a real Breit-Wigner, with no phase variation. In this case, we got similar mass and width for this extra state, but with unphysical fractions for this state and the NR, and a worse fit quality. We also replaced the by a hypothetical vector state, with unconstrained mass and width, but it appears with a small fraction, the fit quality being comparable to the model without it, and all fractions and phases remaining unchanged. A tensor model was also tried without convergence, the width being driven to large, negative values. Other models with the were also tried. For example, modifications to the scalar Breit-Wigner amplitude and to the form-factors were introduced. A number of studies for the parameterization of the NR amplitude were tried bediaga , with and without the . No model without the was able to describe our data satisfactorily. All variations of models with gave similar results for the mass and width (within errors) although the fractions for and NR showed correlations.
Thus, from the results above, we find strong evidence that a light and broad scalar resonance gives an important contribution to the decay.
3 The Results
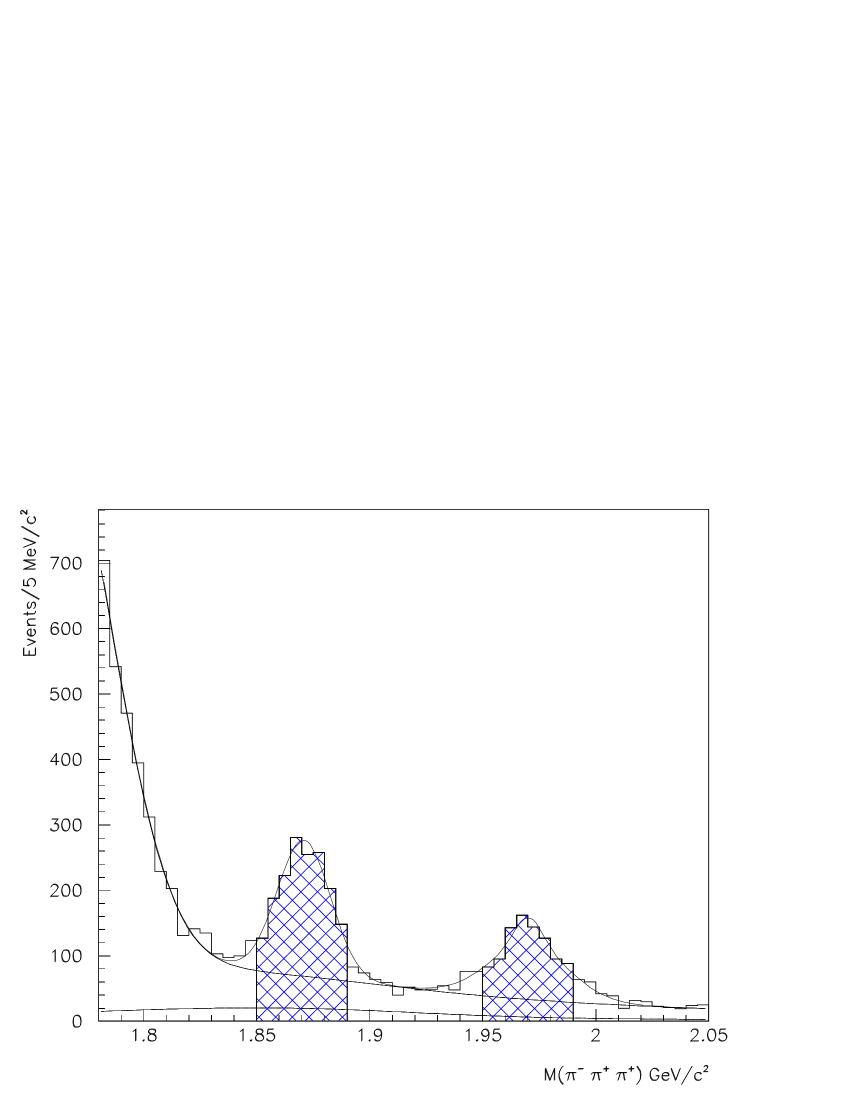
In Figure 3 we show the invariant mass distribution for the sample collected by E791 after reconstruction and selection criteria ds3pi ; d3pi . Besides combinatorial background, reflections from the decays , (plus one extra track) and are all taken into account. The hatched regions in Figure 3 show the samples used for the Dalitz-plot analyses. There are 1686 and 937 candidate events for and respectively, with a signal to background ratio of about 2:1. The Dalitz plots for these events are shown in Figure 4, the axes corresponding to the two invariant-masses squared.


For the Dalitz-plot fits of both and decays, we use essentially the same formalism as for the decays. See details in ds3pi ; d3pi .
For the events in Figure 4(a), the signal amplitude includes the following channels: , , , , and the non-resonant, assumed constant across the Dalitz plot.
For the amplitude, instead of a simple Breit-Wigner of Eq. 3 222For both analyses, the relativistic Breit-Wigner for each resonant amplitude is defined with a factor (-1) with respect to Eq. 3., we use a coupled-channel Breit-Wigner function wa76 ,
| (5) |
| (6) |
The Dalitz plot is fit to obtain not only the decay fractions and phases of the possible sub-channels, but also the parameters of the state, , , and , as well as the mass and width of the . The other resonance masses and widths are taken from the PDGpdg . The resulting fractions and phases are given in Table 2.
The measured parameters are MeV/c2, 0.09 0.01 0.01 and 0.02 0.04 0.03. Our value for is in very good agreement with OPAL and MARKII results opal , but WA76 wa76 found a much larger value, 0.28 0.04. Our value of indicates a small coupling of to . The values of the mass and of , as well as the magnitudes and phases of the resonant amplitudes, are relatively insensitive to the value of . Both OPAL and MARKII results are also insensitive to the value of . WA76, on the contrary, measured 0.56 0.18.
By fitting the Dalitz plot using for the a simple Breit-Wigner function, we find MeV/c2 and MeV/c2, and the results for fractions and phases are indistinguishable.
The confidence level of the fit for is 35% ds3pi . In Figure 5 we show the mass-squared projections for data (points) and model (solid lines, from fast-MC).
| Decay Mode | Fraction (%) | Phase |
|---|---|---|
| (fixed) | ||
| NR | ||

As we can see by the results of Table 2, approximately half of the rate is via . If the spectator amplitude is dominant in this decay, this would support the interpretation of the as an state. On the other hand, the large contribution from indicates the presence of either -annihilation amplitudes or strong rescattering in the final state. In fact, the is not observed in the final statee687-kkpi , pointing to the being a non- state, as suggested by the naive quark modelpdg . There is no evidence in the decay for a low-mass broad scalar particle as seen in the decay, discussed below.
4 The Decay
In a first approach, we try to fit the Dalitz plot of Figure 4(b) with the same amplitudes used for the analysis. Using this model, the non-resonant, the , and the amplitudes are found to dominate, as shown in Table 3, and in agreement with previous reported analyses e691-3pi ; e687-3pi . However, this model does not describe the data satisfactorily, especially at low mass squared, as can be seen from Fig. 6(a). The obtained from the binned Dalitz plot for this model is 1.6, with a CL less than .
To investigate the possibility that another resonance contributes to the decay, we add an extra scalar resonance amplitude to the signal PDF, with mass and width as floating parameters in the fit.
We find that this model improves our fit substantially. The mass and the width of the extra scalar state are found to be MeV/ and MeV/, respectively. Refering to this state as the , we obtain that the chanell produces the largest decay fraction, as shown in Table 3; the non-resonant amplitude, which is dominant in the model without , drops substantially. This model describes the data much better, as can be seen by the mass squared projection in Fig. 6(b). The is now 0.9, with a corresponding confidence level of 91%.
The existence of a light state, or the , has been the subject of a long-standing controversy penni2 ; torn3 . Various experiments have presented inconsistent evidence for this state sigma-exp , yielding conflicting results pdg ; torn3 .
To test the model above, we replace the scalar amplitude by vector and tensor states, and also by a real Breit-Wigner, with no phase variation (as also done in the analysis). All these alternative models fail to describe the data as well as the scalar (regular) Breit-Wigner amplitude. See detailed discussion in d3pi .
| Decay | Fit without | Fit with | ||
|---|---|---|---|---|
| Mode | Fraction (%) | Phase | Fraction (%) | Phase |
| – | – | |||
| (fixed) | (fixed) | |||
| NR | ||||


5 Conclusion
From the data of the Fermilab E791 experiment, we studied the Dalitz plots of the decays , and . In these three final states, the scalar intermediate resonances were found to give the main contribution to the decay rates. We obtained strong evidence for the existence of the and scalar mesons, measuring their masses and widths. We also obtained new measurements for masses and widths of the other scalars studied, , and .
The results presented here show the potential of meson decays for the study of light meson espectroscopy, in particular in the scalar sector.
References
- (1) E791 Collaboration, E.M. Aitala et al., Phys. Rev. Lett. 86 765 (2001).
- (2) E791 Collaboration, E.M. Aitala et al., Phys. Rev. Lett. 86 770 (2001).
- (3) J.A. Appel, Ann. Rev. Nucl. Part. Sci. 42, 367 (1992); D. Summers et al., hep-ex/0009015; S. Amato et al., Nucl. Instr. Meth. A 324, 535 (1993); E791 Collaboration, E.M. Aitala et al., Eur. Phys. J. direct C 4, 1 (1999).
- (4) E. van Beveren et al., Z. Phys. C 30, 615 (1986).
- (5) S. Ishida et al., Prog. Theor. Phys. 98, 621 (1997).
- (6) D. Black et al., Phys. Rev. D 58, 054012 (1998).
- (7) J.A. Oller, E. Oset, J.R. Peláez, Phys. Rev. D 59 074001 (1999); M. Jamin, J.A. Oller, and A. Pich, Nucl. Phys. B587, 331 (2000).
- (8) C.M. Shakin, H. Wang, Phys. Rev. D 63, 014019 (2001).
- (9) M. Ishida, Prog. Theor. Phys. 101, 661 (1999).
- (10) D. Black et al., Phys. Rev. D 59, 074026 (1999).
- (11) J.A. Oller and E. Oset, Phys. Rev. D 60, 074023 (1999).
- (12) N.A. Törnqvist, Z. Phys. C 68, 647 (1995).
- (13) A.V. Anisovitch and A.V. Sarantsev, Phys. Lett. B 413, 137 (1997).
- (14) S.N. Cherry and M.R. Pennington, Nucl. Phys. A688 823 (2001).
- (15) E691 Collaboration, J.C. Anjos et al., Phys. Rev. D 48, 56 (1993).
- (16) E687 Collaboration, P.L. Frabetti et al., Phys. Lett. B 331, 217 (1994).
- (17) Particle Data Group, D.E. Groom et al., Eur. Phys. Jour. C 15, 1 (2000).
- (18) ARGUS Collaboration, H. Albrecht et al., Phys. Lett. B 308, 435(1993).
- (19) CLEO Collaboration, S. Kopp et al., Phys. Rev. D 63, 092001 (2001).
- (20) J.M. Blatt and V.F. Weisskopf, Theoretical Nuclear Physics, John Wiley & Sons, New York, 1952.
- (21) LASS Collaboration, D. Aston et al., Nucl. Phys. B296, 493 (1988).
- (22) I. Bediaga, C. Göbel, and R. Méndez-Galain, Phys. Rev. Lett. 78, 22 (1997) and Phys. Rev. D 56, 4268 (1997); C. Göbel, Ph.D. Thesis, Centro Brasileiro de Pesquisas Físicas, Rio de Janeiro, Brazil (1999).
- (23) WA76 Collaboration, T.A. Armstrong et al., Z. Phys. C 51, 351 (1991).
- (24) OPAL Collaboration, K. Ackerstaff et al., Eur. Phys. J. C 4, 19 (1998); MARKII Collaboration, G. Gidal et al., Phys. Lett. B 107, 153 (1981).
- (25) E687 Collaboration, P.L. Frabetti et al., Phys. Lett. B 351, 591 (1995).
- (26) E691 Collaboration, J.C. Anjos et al., Phys. Rev. Lett. 62, 125 (1989).
- (27) E687 Collaboration, P.L. Frabetti et al., Phys. Lett. B 407, 79 (1997).
- (28) M.R. Pennington, in Proceedings of the Workshop on Hadron Spectroscopy, Frascati Physics Series Vol. XV (Laboratory Nazionali de Frascati, Frascati (Roma), Italy, 1999), p. 95.
- (29) N. Törnqvist, in Proceedings of the Workshop on Hadron Spectroscopy, Frascati Physics Series Vol. XV (Laboratory Nazionali de Frascati, Frascati (Roma), Italy, 1999), p. 237, and N. Törnqvist, hep-ph/0008135.
- (30) WA102 Collaboration, D. Barberis et al., Phys. Lett. B 453, 316 (1999); CLEO Collaboration, D.M. Asner et al., Phys. Rev. D 61, 012002 (2000); GAMS Collaboration, D. Alde et al., Phys. Lett. B 397 , 350 (1997).