Evidence for the Decay
Abstract
We present a search for the “wrong-sign” decay using of collisions on and just below the resonance. This decay can occur either through a doubly Cabibbo-suppressed process or through mixing to a followed by a Cabibbo-favored process. Our result for the time-integrated wrong-sign rate relative to the decay is , which has a statistical significance of 3.9 standard deviations.
S.A. Dytman,1 V. Savinov,1 S. Chen,2 J. W. Hinson,2 J. Lee,2 D. H. Miller,2 E. I. Shibata,2 I. P. J. Shipsey,2 V. Pavlunin,2 D. Cronin-Hennessy,3 A.L. Lyon,3 W. Park,3 E. H. Thorndike,3 T. E. Coan,4 Y. S. Gao,4 F. Liu,4 Y. Maravin,4 I. Narsky,4 R. Stroynowski,4 J. Ye,4 M. Artuso,5 C. Boulahouache,5 K. Bukin,5 E. Dambasuren,5 G. Majumder,5 R. Mountain,5 T. Skwarnicki,5 S. Stone,5 J.C. Wang,5 H. Zhao,5 S. Kopp,6 M. Kostin,6 A. H. Mahmood,7 S. E. Csorna,8 I. Danko,8 K. W. McLean,8 Z. Xu,8 G. Bonvicini,9 D. Cinabro,9 M. Dubrovin,9 S. McGee,9 A. Bornheim,10 E. Lipeles,10 S. P. Pappas,10 A. Shapiro,10 W. M. Sun,10 A. J. Weinstein,10 R. Mahapatra,11 G. Masek,11 H. P. Paar,11 R. J. Morrison,12 H. N. Nelson,12 R. A. Briere,13 G. P. Chen,13 T. Ferguson,13 H. Vogel,13 J. P. Alexander,14 C. Bebek,14 K. Berkelman,14 F. Blanc,14 V. Boisvert,14 D. G. Cassel,14 P. S. Drell,14 J. E. Duboscq,14 K. M. Ecklund,14 R. Ehrlich,14 L. Gibbons,14 B. Gittelman,14 S. W. Gray,14 D. L. Hartill,14 B. K. Heltsley,14 L. Hsu,14 C. D. Jones,14 J. Kandaswamy,14 D. L. Kreinick,14 M. Lohner,14 A. Magerkurth,14 H. Mahlke-Krüger,14 T. O. Meyer,14 N. B. Mistry,14 E. Nordberg,14 M. Palmer,14 J. R. Patterson,14 D. Peterson,14 J. Pivarski,14 D. Riley,14 H. Schwarthoff,14 J. G. Thayer,14 D. Urner,14 B. Valant-Spaight,14 G. Viehhauser,14 A. Warburton,14 M. Weinberger,14 S. B. Athar,15 P. Avery,15 C. Prescott,15 H. Stoeck,15 J. Yelton,15 G. Brandenburg,16 A. Ershov,16 D. Y.-J. Kim,16 R. Wilson,16 K. Benslama,17 B. I. Eisenstein,17 J. Ernst,17 G. E. Gladding,17 G. D. Gollin,17 R. M. Hans,17 I. Karliner,17 N. Lowrey,17 M. A. Marsh,17 C. Plager,17 C. Sedlack,17 M. Selen,17 J. J. Thaler,17 J. Williams,17 K. W. Edwards,18 A. J. Sadoff,19 R. Ammar,20 A. Bean,20 D. Besson,20 X. Zhao,20 S. Anderson,21 V. V. Frolov,21 Y. Kubota,21 S. J. Lee,21 R. Poling,21 A. Smith,21 C. J. Stepaniak,21 J. Urheim,21 S. Ahmed,22 M. S. Alam,22 L. Jian,22 L. Ling,22 M. Saleem,22 S. Timm,22 F. Wappler,22 A. Anastassov,23 E. Eckhart,23 K. K. Gan,23 C. Gwon,23 T. Hart,23 K. Honscheid,23 D. Hufnagel,23 H. Kagan,23 R. Kass,23 T. K. Pedlar,23 J. B. Thayer,23 E. von Toerne,23 M. M. Zoeller,23 S. J. Richichi,24 H. Severini,24 and P. Skubic24
1University of Pittsburgh, Pittsburgh, Pennsylvania 15260
2Purdue University, West Lafayette, Indiana 47907
3University of Rochester, Rochester, New York 14627
4Southern Methodist University, Dallas, Texas 75275
5Syracuse University, Syracuse, New York 13244
6University of Texas, Austin, Texas 78712
7University of Texas - Pan American, Edinburg, Texas 78539
8Vanderbilt University, Nashville, Tennessee 37235
9Wayne State University, Detroit, Michigan 48202
10California Institute of Technology, Pasadena, California 91125
11University of California, San Diego, La Jolla, California 92093
12University of California, Santa Barbara, California 93106
13Carnegie Mellon University, Pittsburgh, Pennsylvania 15213
14Cornell University, Ithaca, New York 14853
15University of Florida, Gainesville, Florida 32611
16Harvard University, Cambridge, Massachusetts 02138
17University of Illinois, Urbana-Champaign, Illinois 61801
18Carleton University, Ottawa, Ontario, Canada K1S 5B6
and the Institute of Particle Physics, Canada
19Ithaca College, Ithaca, New York 14850
20University of Kansas, Lawrence, Kansas 66045
21University of Minnesota, Minneapolis, Minnesota 55455
22State University of New York at Albany, Albany, New York 12222
23Ohio State University, Columbus, Ohio 43210
24University of Oklahoma, Norman, Oklahoma 73019
Mixing between and mesons occurs because they are eigenstates of the strong interaction Hamiltonian but not of the total Hamiltonian. The Standard Model predicts a very small rate of mixing [1], though new physics processes can enhance the effect [2]. At present, the preferred mode in which to search for mixing is [3, 4],***Charge conjugate reactions are implied throughout this paper. since it tends to have a high signal-to-background ratio, and its proper time distribution can be directly interpreted in terms of the rates for mixing and for doubly Cabibbo-suppressed [5] decays (DCSD). The best limits on the rate of mixing relative to the Cabibbo-favored decay ( at the 95% confidence level [3]) are obtained from this decay mode. Other “wrong-sign” modes of the form are interesting to study, as they are also sensitive to mixing and present us with additional information about the doubly Cabibbo-suppressed decays which interfere with mixing [6]. Without lifetime information, the best limits on come from semileptonic decay modes, where any wrong-sign signal is evidence for mixing because there is no DCSD contribution ( at the 90% confidence level [7]), and the backgrounds are the limiting factor.
In this paper we present the ratio of branching fractions
where is the relative rate for the doubly Cabibbo-suppressed decay with respect to the Cabibbo-favored decay, and is the imaginary part of the mixing amplitude after rotation through the strong phase , which depends on the specific final state. In , is just the phase difference between the Cabibbo-favored and doubly Cabibbo-suppressed decay amplitudes. In , there can be many resonant sub-modes which interfere. After integrating over the phase space, this results in a total phase difference which is analogous to but is difficult to interpret.
The potentially different phase space structures of right-sign and wrong-sign add an additional complication in measuring the ratio of branching fractions. If the reconstruction efficiencies differ between the two, then will be:
| (1) |
where is the number of events observed, and is the reconstruction efficiency for right-sign or wrong-sign, averaged over phase space. We also define
The data used in this analysis consist of an integrated luminosity of of collisions collected with the CLEO II.V detector [8, 9, 10] between 1996 and 1999. The detector is located in Ithaca, NY at the Cornell Electron Storage Ring, which collides electrons and positrons at a center of mass energy on or just below the resonance. These collisions take place in a luminous region at the center of the detector with a Gaussian width of approximately m in the vertical direction, m in the horizontal direction, and 1 cm along the beam direction [11].
The detector consists of a number of concentric cylindrical sub-detector components immersed in a 1.5 T solenoidal magnetic field oriented along the axis, which is the direction of the incident beams. The innermost component is a silicon vertex detector, a high-precision tracking device with three layers of silicon wafers, instrumented on both sides, which measures particle position to 30 m in the plane and 100 m along the beam direction. Immediately outside of this are two drift chambers with a total of 50 layers of axial wires and 11 layers of stereo wires. The position resolution for each layer in the drift chambers is approximately 100 m. There are additional components at larger radii, including time-of-flight counters, an electromagnetic calorimeter, and muon detectors, but these are not used in this analysis.
Monte Carlo simulated events are used to determine selection criteria, obtain fitting shapes, and study some of the systematic effects. The simulation is based on the GEANT package [12], and its output is processed in the same manner as the data. The size of the Monte Carlo sample is equivalent to approximately eleven times the size of the data sample.
A candidate is fully reconstructed from a charged kaon and three charged pions (). The initial flavor of the candidate is determined by the charge of the slow pion, , from the decay chain . A right-sign event is one in which the charge of the kaon is opposite from the charge of the slow pion, while a wrong-sign event is one in which they are the same [13].
The candidate is subject to a number of requirements. The decay particles are constrained to come from a common vertex, which eliminates candidates constructed of some particles originating from a displaced vertex and others from either another displaced vertex or the primary interaction point. The resulting invariant mass distribution has a width of 5.4 MeV/. There are many more right-sign than wrong-sign events, so we must remove fake wrong-sign events due to mis-identified right-sign events, or feed-through, which can bias our signal. We want to treat both the right-sign and wrong-sign samples identically, so we must also remove feed-through in the other direction. Feed-through occurs when the kaon is mis-identified as a pion, and one of the oppositely charged pions is mis-identified as a kaon. To determine if a candidate is feed-through, we swap two of our mass assignments such that the decay switches between “right” and “wrong” sign. From this we calculate an invariant mass and its uncertainty, and if the invariant mass is less than 3.85 standard deviations from the nominal mass, the candidate is considered feed-through. In addition, we require consistency between the observed and expected rate of energy loss () in the wire chambers given the observed momentum of a particle and its mass hypothesis. Kaon candidates are required to have energy loss within 2.1 standard deviations of the expected value; pion candidates within 3.2 standard deviations.
We constrain the slow pion candidates to pass through the intersection of the trajectory and the vertical position of the center of the luminous region. This constraint removes much of the mis-measurement of the slow pion due to multiple Coulomb scattering in the beam pipe and the first layer of the silicon detector. The improved slow pion measurement results in a 210 keV-wide distribution of the energy release of the candidate,
where is the invariant mass of the candidate, and is the invariant mass of the candidate. A minimum momentum of 2.68 GeV/ is required of the candidate to reduce the combinatoric background; it also kinematically removes decays originating from mesons.
One particular background, which we must explicitly veto, is the singly Cabibbo-suppressed decay followed by . The combined branching fraction for this process is [14, 15], and it can masquerade as our wrong-sign signal. Much of this will be excluded by the common-vertex constraint on the , however, what remains will look identical to the signal. The reconstructed invariant mass of the from the will be shifted down slightly from the mass because the pion tracks will tend to be pulled back towards the decay point by the common-vertex constraint. In order to eliminate these decays, we require that neither combination have an invariant mass between 472 MeV/ and 512 MeV/. This requirement is 90% efficient for the right-sign signal.
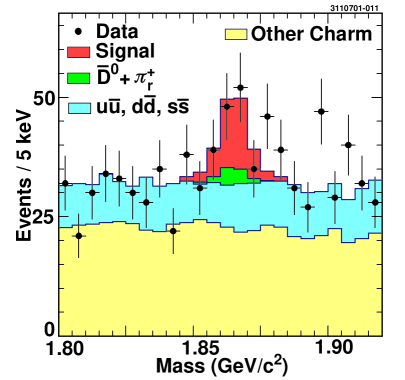
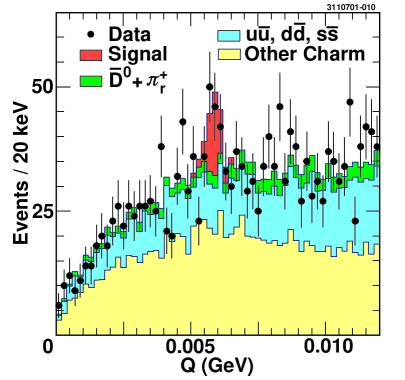
We determine the ratio by performing a two-dimensional binned likelihood fit of the wrong-sign data in the plane of vs. . Histograms are used as the fitting shapes for the signal and backgrounds rather than analytic forms in order to simplify the fits. The signal shape histogram comes from the right-sign data, reducing any possibility of mis-modeling the shape of the signal in the wrong-sign data. This has the additional benefit that we can fit directly for . A simple fit of the right-sign distribution to a constant plus two Gaussians yields a signal-to-background ratio of about 35:1 in the signal region, which is low enough that we neglect the effect of the background in the signal shape. The presence of background in the signal shape does not bias , since the right-sign background is scaled along with the signal and does not appreciably alter the shape of the distribution. The backgrounds consist of three categories: true right-sign decays paired with a random , other events, and events originating from . The first background produces a peak in the invariant mass, but not in the distribution. The second is flat in mass, but produces a very broad peak in due to partially reconstructed decays matched with a slow pion from a real . The third does not produce a peak in either mass or . For all three categories of background, we obtain fitting histograms from the Monte Carlo simulation. The normalizations of the signal shape and all three background shapes are allowed to vary independently in the fit. The fit result for is , which has a statistical significance of 3.9 standard deviations. The right-sign data contain 13735 events, which yields wrong-sign signal events using and accounting for the small background in the right-sign signal shape. Projections of the two-dimensional fit onto the mass and axes for combinations within two standard deviations of the central value of the other variable are shown in Figure 1.
With four particles in the final state, the phase space for the decay is five-dimensional. The reconstruction efficiency is not completely uniform across the phase space, so if the right-sign and wrong-sign events populate phase space differently, there will be a multiplicative correction to account for the difference in average efficiencies, as indicated in Equation (1). This correction is studied using the data and an additional sample of simulated signal with a flat matrix element. A small bubble in phase space is formed around each data event in the signal region, in which we count the number of generated and reconstructed simulated events. This gives us the local efficiency for the data event, and its reciprocal is the event weight. The sum of these weights is the total number of expected right-sign or wrong-sign events, and using the observed yields we calculate the average efficiency. The wrong-sign data have significant background, however, so we perform a background subtraction to obtain the signal weight of the wrong-sign data. To calculate the background weight, we first find the total weight of the wrong-sign events outside of the signal region in but within the signal region in mass. This sideband weight is then scaled by the relative numbers of background events in the signal region and the sidebands, and the difference between the total wrong-sign weight and this background weight is the wrong-sign signal weight. The ratio of average efficiencies is found to be . Our precision on the efficiency ratio is limited by the size of the wrong-sign signal sample in the data.
Many sources of systematic uncertainty cancel in measuring the ratio . The background under the wrong-sign peak is the dominant effect in determining this ratio, so the quality of the simulation determines the most significant sources of systematic uncertainty. The relevant sources are the statistical precision of the simulated sample and how well the simulation models the background shapes. Of these, the statistical precision of the sample is the larger.
The shapes used in fitting the backgrounds are derived from a finite-size simulated sample and so are subject to statistical fluctuations. To account for this, we form an ensemble of shapes fluctuated bin-by-bin according to a Poisson distribution. The mean of the Poisson distribution for these fluctuations is the contents of the bin from the full simulated sample, and each shape is fluctuated separately. The distribution for the values of obtained by fitting the data with these fluctuated shapes is a Gaussian whose width corresponds to an absolute systematic uncertainty on of 0.00032. Using means that are already the results of statistical fluctuation will tend to accentuate the statistical effects, and the uncertainty from this systematic effect is estimated conservatively. This is the largest systematic uncertainty, but is still considerably smaller than the statistical uncertainty.
In addition to statistical variations, it is possible that the simulation is mis-modeling the backgrounds. In order to obtain a quantitative estimate of this effect, we perform the fit with various regions outside of the signal region excluded. This probes more local variations between the data and simulation than the fit to the full plane. Specifically, we perform eight separate fits, four to the quadrants of the plane, and four to the half-planes formed by adjacent quadrants. In each case, we include the entire signal region. The sample standard deviation of these restricted fits gives us a systematic uncertainty of 0.00031. Since the restricted fits are correlated with the statistical precision of the full fit and each other, the systematic uncertainty we assign is a conservative estimate.
Combining the systematic uncertainties discussed above in quadrature gives for the total systematic uncertainty on . Our final result is
This result is a substantial improvement over the previous result of from E791 [16], for which the right-sign to wrong-sign phase-space efficiency correction was assumed to be exactly 1.0. Our result, with a statistical significance of 3.9 standard deviations, provides guidance towards the luminosities that future experiments will need in order to measure the mixing and DCSD phase-space structure of the decay .
We gratefully acknowledge the effort of the CESR staff in providing us with excellent luminosity and running conditions. M. Selen thanks the PFF program of the NSF and the Research Corporation, and A.H. Mahmood thanks the Texas Advanced Research Program. This work was supported by the National Science Foundation, the U.S. Department of Energy, and the Natural Sciences and Engineering Research Council of Canada.
REFERENCES
- [1] S.L. Glashow, J. Iliopoulos, and L. Maiani, Phys. Rev. D 2, 1285(1970); M. Gell-Mann and A. Pais, Phys. Rev. 97, 1387(1955); T.D. Lee and C.N. Yang, Phys. Rev. 106, 340(1957); A. Pais and S.B. Treiman, Phys. Rev. D 12, 2744(1975); A.A. Petrov, hep-ph/0009160, to be published in the proceedings of 4th Workshop on Continuous Advances in QCD, Minneapolis, Minnesota, 12-14 May 2000.
- [2] H.N. Nelson, hep-ex/9908021, submitted to the 1999 Lepton-Photon Symposium (unpublished).
- [3] CLEO Collaboration, R. Godang et al., Phys. Rev. Lett. 84, 5038 (2000).
- [4] FOCUS Collaboration, J.M. Link et al., Phys. Rev. Lett. 86, 2955 (2001).
- [5] M. Kobayashi and T. Maskawa, Prog. Theor. Phys. 49, 652 (1973); N. Cabibbo, Phys. Rev. Lett. 10, 531 (1963).
- [6] CLEO Collaboration, G. Brandenburg et al., Phys. Rev. Lett. 87, 071802 (2001).
- [7] E791 Collaboration, E.M. Aitala et al., Phys. Rev. Lett. 77, 2384 (1996).
- [8] CLEO Collaboration, Y. Kubota et al., Nucl. Instrum. Methods Phys. Res., Sec. A 320, 66 (1992).
- [9] T.S. Hill, Nucl. Instrum. Methods Phys. Res., Sec. A 418, 32 (1998).
- [10] R.A. Briere, in Heavy Flavor Physics, edited by C. Campagnari, (World Scientific, Singapore, 1999), p.442.
- [11] D. Cinabro et al., physics/0011075. Submitted to Nucl. Instrum. Methods Phys. Res., Sec. A.
- [12] R. Brun et al., GEANT 3.15, CERN Report No. DD/EE/84-1 (1987).
- [13] Complete details of this analysis can be found in M.A. Marsh, Ph.D. thesis, University of Illinois at Urbana-Champaign, 2001.
- [14] E691 Collaboration, J.C. Anjos et al., Phys. Rev. D 43, 635 (1991).
- [15] CLEO Collaboration, R. Ammar et al., Phys. Rev. D 44, 3383 (1991).
- [16] E791 Collaboration, E.M. Aitala et al., Phys. Rev. D 57, 13 (1998).