STAR Barrel Electromagnetic Calorimeter Absolute Calibration Using “Minimum Ionizing Particles” from Collisions at RHIC
Abstract
The procedure for the STAR Barrel Electromagnetic Calorimeter (BEMC) absolute calibrations, using penetrating charged particle hits (MIP-hits) from physics events at RHIC, is presented. Its systematic and statistical errors are evaluated. It is shown that, using this technique, the equalization and transfer of the absolute scale from the test beam can be done to a percent level accuracy in a reasonable amount of time for the entire STAR BEMC. MIP-hits would also be an effective tool for continuously monitoring the variations of the BEMC tower’s gains, virtually without interference to STAR’s main physics program. The method does not rely on simulations for anything other than geometric and some other small corrections, and also for estimations of the systematic errors. It directly transfers measured test beam responses to operations at RHIC.
keywords:
RHIC; STAR; Electromagnetic calorimeter; Calibration; Monitoring; Charged particles., , , , ††thanks: Corresponding author. Phone: (313)–577–2781; fax: (313)–577–0711; e–mail: rykov@physics.wayne.edu
PACS: 29.40.Vj; 29.20.Dh
Introduction
The calibration of calorimeters in collider experiments, using external beams, is typically either impractical or even impossible. As a result, the calibration is usually performed in situ, using several independent complimentary methods to make sure the calibration constants obtained by different methods are mutually consistent within the systematic and statistical uncertainties of each methods. In most large collider experiments, it is quite common to use radioactive sources, cosmic rays, and calorimeter hits from high statistics physics events with clear signatures and hit patterns [1, 2]. For electromagnetic calorimeters (EMC), examples of the latter include energy-momentum matching for electrons as they are measured in the tracking detectors and calorimeter, measuring the positions of invariant mass peaks for known resonances and short-lived particles (, , , , …), etc. Most of these processes can and will eventually be used at various stages of the running STAR experiment for precise calibrations of its electromagnetic calorimeters in various energy intervals. However, the “direct” calibrations over a wide energy range, using the physical processes above with electrons and/or photons in final states, will require a rather long time to obtain sufficient statistics and to do the appropriate data analysis. Therefore several “indirect” complimentary methods, which are described in Ref. [3], will be used first to set the channels’ gains to the few percent level and obtain the initial calibration constants immediately after a module installation during the few first days or even hours of running RHIC.
In this paper, we will focus on just one of many indirect approaches which is currently considered as the base-line method [3] for the STAR Barrel Electromagnetic Calorimiter (BEMC) calibration, equalization and continuous gain monitoring. This method relies on measuring the BEMC towers’ responses to penetrating charged particle hits from physics events at the running RHIC and comparing them to the ones obtained in the BEMC towers exposure to an external test beam.
1 STAR Barrel Electromagnetic Calorimeter
The STAR BEMC, a sampling scintillator-lead calorimeter with the pseudo-rapidity coverage of and in azimuth , has been described elsewhere [3, 4, 5]. It will be installed within the STAR magnet at the radius of 220 cm just outside the Time Projection Chamber (TPC) and Central Trigger Barrel (CTB).
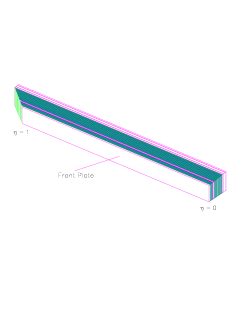
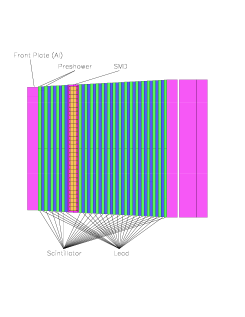
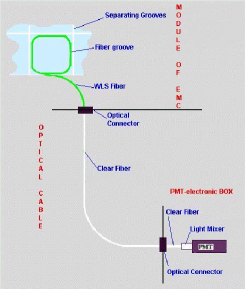
The BEMC consists of 120 modules of the size 10.1 each. The BEMC module (Fig. 1) is a stack of 21 scintillator megatiles, separated by 5 mm lead sheets. Each megatile is divided into 40 light-insulated tiles, 20 in by 2 in , with a separate readout from each tile, using wave-length shifting fibers connected to 3 m long clear fibers. The light from each set of 21 tiles of different layers, which creates a single projective towers of the size 0.050.05, is collected at a single phototube (PMT), one per tower, totaling in 4,800 channels for the full BEMC coverage. The two front tiles of each tower, with a second set of embedded fibers to transport the light to a separate photodetector, provide a “Preshower” (PRS) signal, which is used to enhance -/hadron separation in the BEMC [6]. To compensate 20% loss of light due to a second fiber, the two front megatiles were made 6 mm thick, while the thickness of the remaining 19 tiles is 5 mm each. For perpendicular tracks, the total BEMC depth is 18 radiation lengths (18X0) and 0.8 of the nuclear absorption length. A position-sensitive two-layer gaseous Shower-Maximum Detector (SMD) is placed in front of the 6th megatile at the depth of approximately 5X0 within BEMC stack.
2 Requirements to the STAR BEMC calibrations
The most stringent requirements on the equalization of the BEMC towers come from the needs of the lowest-level, fast L0-trigger. Well equalized towers are those, having equal responses, in terms of digitized signals, to electron-photon hits of, for example, equal energy, , or equal transverse energy , where the polar angle . The usual BEMC contribution to the fast trigger is to select events with a high local and/or global energy deposits111Either , or , or both. above the chosen L0-trigger’s threshold(s). Along with other factors, the “sharpness” of thresholds for this kind of “high-” triggers depends on how well towers’ responses have been equalized. On the other hand, due to a finite BEMC energy resolution, which also contributes to the widening of thresholds, it does not make sense to equalize tower gains much better than an intrinsic BEMC energy resolution. In the range of interest for L0’s -thresholds in STAR from 3–5 to 10 GeV [7], the expected intrinsic energy resolution is 5–10% [3, 5]. This means that the equalization of the BEMC towers to the level of 3–4% is sufficient in the -interval of 3–10 GeV.
It would also be correct to compare acceptable statistical uncertainties of the BEMC towers’ relative calibrations to an intrinsic BEMC energy resolution. The relative tower calibration, which is the knowledge of its calibration coefficient relative to some base gain is equivalent, to some extent, to the tower’s equalization but for the data analysis rather than L0-trigger, because the uncertainties in the calibration coefficients will effectively contribute to the final BEMC energy resolution. The other difference is that, while the equalization of towers’ responses is important in a rather limited energy interval of L0-trigger thresholds, the requirements to the relative calibrations are relevant to the entire -range of interest for STAR from 0.5–1 to 50–60 GeV. At energies below 10 GeV, the knowledge of the calibration coefficients with the same statistical uncertainty of 3–4%, as for equalization of digitized responses, would be sufficient. Simulations with GEANT [8] have shown that, at the energies above 20–25 GeV, the intrinsic BEMC energy resolution is almost constant and equal to 3%. With this resolution, for example, the width (RMS) of -peak, , in -decay mode, including its natural width, will be 3.5%. For two times worse BEMC energy resolution of 6%, the width of -peak would increase by a factor of 1.5 to 5%. The summary of this consideration is that the requirement on the accuracy of the relative calibration for each single BEMC tower of no worse than 3–4% seems to be valid for the entire energy range from 0.5–1 to 50–60 GeV, particularly early in the program. Of course, over time, one can and will do better, utilizing directly electron-photon hits. But the point is that relative calibration coefficients with the level of uncertainty above will not significantly impact the physics program.
In STAR, the most restrictive requirements for the absolute BEMC calibration arise from the measurements of differential cross sections, which fall steeply with transverse momentum, . Fits to the SPS data [9] for inclusive direct- and productions at 10 GeV/c give the dependence of . The ISR measured spectra [10] at lower ’s from 4 GeV/c fall even more sharply, . To measure these differential cross sections with systematic errors of no more than 10–20%, the BEMC absolute scale in the region of interest has to be known at the accuracy of 1.5–2%.
The requirements on monitoring the variations of calibration coefficients over time are directly related to the considerations above. Tracking variations of a mean gain for the entire BEMC or its any large patch222For example, 40 towers of a BEMC module or 120 towers of an -ring. has to be done at the accuracy of the absolute scale, i.e. at about 1.5–2%. The statistical errors for tracking gain variations for each single tower can be larger, 3–4% as for the relative calibration and equalization.
It is also appropriate to mention here the requirement for an initial setting of PMT gains after a BEMC module installation in STAR. Formally speaking, the method of “MIP-calibrations”, which is the main subject of this paper, requires only that initial gains be set so that MIP peaks333See Secs. 3 and 5 for all definitions, related to the MIP-calibration method. from penetrating charged particles are sitting somewhere within digitizers’ (ADC) ranges, reasonably far from their lower and upper limits. Then, only in a few hours of running RHIC, the towers can be equalized to the accuracy of a few percents. However, so as to not fully incapacitate during these few hours the functionality of those triggers, which rely on the BEMC signals, it would be desirable to have the newly-installed module more or less equalized from the very beginning. The initial equalization at 10–15% seems both sufficient and practically feasible by, for example, measuring the towers’ responses to cosmic rays just before a new module installation and then transferring these measurements to STAR, using the Light-Emitting Diode (LED) technique [3].
3 Calibration scheme
Many charged hadrons (along with small admixtures of electrons and muons) will be produced in every collision at RHIC. In the central region covered by the STAR BEMC, these are mostly pions. When striking the BEMC, a significant fraction, 30–40% of high energy charged hadrons, do not deposit a large amount of energy via nuclear interactions, instead depositing only 20–30 MeV of energy in the calorimeter’s 21 scintillator layers due largely to electromagnetic ionization. In this paper, we will loosely call all these charged hadrons “Minimum Ionizing Particles” (MIP), producing “MIP-hits” in the BEMC towers, resulting in “MIP peaks” in the signal spectra. For relativistic particles, the position of MIP peak is nearly independent of momentum and particle species. This, along with the high yield of charged hadrons, makes it attractive to explore the feasibility of using high energy MIPs for the equalization, calibration, and continuous monitoring variations of the BEMC towers’ gains.
The calibration scheme using MIP-hits has two stages. In the first stage, a sample of BEMC modules is exposed to an external beam, for example at the Alternating Gradient Synchrotron (AGS) of Brookhaven National Laboratory. The composition of the AGS B2-Line negative test beam is mainly ’s with some fractions of other hadrons, electrons and muons of a chosen momentum, selected in the range from 0.3–0.5 to 7–8 GeV/c. Therefore the ratios of each tower responses to MIP’s and electron’s hits, -ratios444In this definition, “” is the MIP-peak position which is described more precisely later in the paper. The notation “” is used here for the ratio , where is the mean BEMC signal from electrons of energy . Thus, the -ratio represents the energy of electrons which would generate in the BEMC the same mean signal as MIPs., are measured simultaneously (or almost simultaneously for electrons and MIPs of different momenta). This makes these measurements completely independent of the actual PMT’s and ADC’s gains, possible attenuation and distortion of signals in cables, delay lines, etc., i.e. in the equipment which might be necessary for the test beam run but won’t be present in the STAR detector, and vice versa. In the second stage, after the modules have been installed in their places in the STAR, and the RHIC accelerator is producing collisions, samples of MIP-hits of particle composition and momenta as close as possible to those in the test beam are accumulated for each tower, and the positions of the resulting MIP peaks are measured. This step essentially completes the procedure of transferring beam-test results to STAR. For those towers exposed to the test beam, their responses to electron hits555Of the momenta actually used in the test-beam run. can immediately be predicted, using the known -ratios that have been measured at the beam-test stage. For all other modules, these ratios are expected to be close to those of the tested ones, provided key design tolerances are kept at the module manufacturing stage.
It is clear that charged particles of low transverse momenta are useless in the MIP calibration process because their deflection in the STAR’s magnetic field causes them to enter the BEMC at large angles. Only a small fraction of these particles, if any, pass through all 21 scintillator tiles of a single tower. On the other hand, if a -threshold is chosen too high, the useful event rate would be too low because of the steep drop of the particle yield as increases. Simple estimates suggest MIPs of ’s just above 1 GeV/c as a good compromise between yield and utility. In the STAR magnetic field of 0.5 T, the trajectories of no fewer than 50–60% of charged particles with 1 GeV/c, produced at the primary vertex666And not interacted strongly in the BEMC., will pass through all 21 tiles of a single BEMC tower. An additional important benefit is that the momenta of 1–2 GeV/c are within the range of the AGS test beam.
The calibration errors of the procedures described above depend on a number of factors. In the rest of this paper, we will discuss in details the most important of them.
4 Design tolerances on the light yield variations from the scintillator tiles within a tower
The calibration procedure above relies on the assumption that the measured -ratios from a few modules, exposed to the beam in a limited energy interval, could be extended to the entire energy range of interest and also applied to the non-beam-tested modules. To extend the calibrations to a wider energy range, one has to be sure that towers’ responses were linear or, alternatively, the functional dependences777Not accounting scaling factors. were known. An application of the beam-test calibration data to non-tested modules requires that the towers of the same in all modules have similar functional dependences to within 3–4% if the specification on relative towers’ calibration is to be satisfied. This in turn implies certain requirements on the uniformity of the module design and manufacturing888It is worth mentioning here that unknown nonlinearities of the electronic PMT-ADC chains, in the beam-test as well as in STAR, will go directly to the systematic errors of MIP-calibrations. However, these nonlinearities are relatively easily measured and accounted in the calibrations..

The functional dependence of a sampling calorimeter response, in general, and its linearity, in particular, quite strongly depend on the uniformity of light yields from scintillator layers within a tower. Individual tower variations of light yield from tile-to-tile introduce nonlinearities in the energy responses due to the development of mean shower depth with energy999See, for example, Ref. [11] for details.. Therefore, setting limits during module production on the light yield variations from layer to layer represents the most critical issue for the maintenance of the BEMC calibration and equalization within specified limits over a broad energy range. On the basis of simulations with GEANT, which are illustrated in Fig. 2, it has been determined that, after towers’ equalization with MIPs, the residual uncertainties of calibration coefficients won’t exceed the design limits if light yield variations were kept within gaussian 10%. From Fig. 2, it also follows that the equalization, using MIPs, is expected to provide slightly better results, compared to another widely used method with -source [2].
5 Reconstructing MIP-peak positions in the beam tests and in STAR at RHIC
The compositions of MIPs in the beam-test and in STAR at RHIC will certainly be different and won’t be exactly known. To accumulate sufficient statistics in a reasonably short time, the momentum range of the selected MIPs in STAR cannot be made as narrow as it was in the beam test. Moreover, STAR’s 0.5 T magnetic field will change -ratios compared to those measured at the external beam. All these differences require introducing multiple corrections and constitute a potential source of systematic errors. Due to substantial backgrounds under and in the vicinity of MIP peaks, their positions are to be determined from some, not so obvious fits to signal spectra. The actual background depends on the environment and hit selection. One expects different backgrounds in the module beam test and in STAR at RHIC. This requires that MIP-peak fits to be, to a certain degree, robust against background variations, variations of the total light yields from otherwise identical towers and electronics noise.
To evaluate the corrections and the associated systematic errors, the various hits in the BEMC towers have been simulated, using GEANT. Then, the energy deposits in the scintillator tiles have been transformed to the PMT signal distributions, accounting for the photon and secondary-electron statistics and electronics noise. In the simulations, the “light-yield” from each single tile varied from 2.5 to 3.5 photoelectrons per perpendicular MIP crossing. Electronic noise, varied from 0 to 2.5 ADC channels. PMT gains have been chosen so as to have MIP peaks101010Mean values. sitting in the interval from 12th to 18th ADC channels above the pedestal. Typical simulated signal distributions are shown in Fig. 3, along with an example of experimental histograms from the BEMC Beam-Test-’98 [12].


It was found that Vavilov distributions [13] quite satisfactorily approximate GEANT simulated energy deposits from mono-momentum charged pions with hadronic interactions turned off. To account also for the photon and secondary-electron statistics in the PMTs and electronics noise, the following function was used to fit the respective ADC signal histograms (top left frame of Fig. 3):
| (1) |
where:
| is Vavilov distribution VAVDEN from CERN | ||||
| library [14]; | ||||
| and | are respectively the ADC pedestal position and | |||
| width, known from separate measurements; | ||||
| is for the MIP-peak position, which is expected | ||||
| to be close to the mean value over MIP-peak with | ||||
| already subtracted . |
Constants , and have been fixed to the following values:111111The other approach, with , and selected individually for each tower’s -position and pion momentum from the best -fits to the simulated MIP energy deposits, has also been tested. It was found however that, in the limited momentum range of interest, this approach does not yield better results compared to the version with fixed constants. 0.3, 0.98 and 0.078. Out of 3 parameters, , and , which were to be determined from the fits, only one was actually the goal: that was .
Function is quite complex by itself, and when it is convoluted with a smearing gaussian, the fitting procedure using becomes relatively slow, taking 15–20 seconds per histogram in PAW [15] with currently available computers. To make quick estimates, simple gaussian fits with 3 parameters: , and , have also been evaluated:
| (2) |
To account for a background from hadronic interactions, etc. under and in the vicinity of MIP peaks in the signal distributions, a function with 3 more parameters, , and , has been added to and in fits to histograms of Rows 2–7 in Fig. 3:
| (3) | |||||
| (4) |
Fits were usually extended from to .

In Fig. 4, the results of fits to the signal distributions from mono-momentum pions are compared to the respective means over histograms from non-hadronically interacting pions. Both, and 3-parameter fits to the histograms of Row 1 in Fig. 3 yield -values close to the means and to each other within a fraction of a percent. The s from 6-parameter -fits to the simulated pion signals with hadronic interactions121212These distributions were expected to be close to the ones from the BEMC Beam-Test-’98 [12], which are shown in Row 3 of Fig. 3, because the composition of the AGS B2 test beam, after electron rejection, using Cherenkov counters, was mainly -mesons with small admixture of kaons, antiprotons and muons. (Row 2 in Fig. 3) are also in good agreement with the means, deviating by just about 0.5% (RMS). However in most cases, -fits to the same distributions underestimate parameter by approximately 1%.
The characteristics of MIP-hit distributions in STAR at RHIC depend on the hit selection as well as on the characteristics of the selected events. For track selection in each event, the target towers are those entered by one and only one charged particle. This particle has 1–1.5 GeV/c. In the high multiplicity environment of, for example, central Au-Au events, the selection conditions could be modified by an additional “isolation” requirement of no charged hits in the neighboring towers either. After checking that an extrapolated track of interest potentially crosses all 21 scintillator tiles of a tower131313Keeping in mind, of course, extrapolation uncertainties due to multiple scattering., the tower’s signal is added to a respective histogram. All the selections above are easily made with the STAR tracking system [4].
The simulation, which are shown in Rows 4–7 of Fig. 3, have been done to evaluate corrections and systematic errors of MIP-calibrations in STAR at RHIC. The results are presented in Fig. 5. At the first step (Row 4 of Fig. 3), it has been assumed that all accumulated MIP-hits were due to pions only, and the contributions to the signals of invisible hits141414Neutrals and energy leaks from neighbor towers. from underlying events have also been neglected. In this case, the only factor, affecting the positions and shapes of MIP peaks, is the pion’s momentum spread151515Effect of STAR magnetic field is still ignored here.. For pion spectra, it would be natural to expect MIP-peak positions close to that of mono-momentum pions with equal to the mean over the spectrum, 0.3 GeV/c. These expectations are shown with the dashed lines in Fig. 5. One can observe that the results of -fits agree within the errors with the expectations, while -fits yield -parameter values lower by the same 1% as they were in the case of mono-momentum pions with hadronic interactions on.
After including the PYTHIA-HIJING’s [16] spectra of kaons and (anti)protons in the MIP samples (Row 5 of Fig. 3),16161666% of pions, 16% of kaons, and 18% of . -parameters move up by approximately 1–2% for 1 GeV/c. However, at 1.5 GeV/c, there is virtually no shifts beyond the statistical errors. Such a difference between 1 and 1.5 GeV/c could be due to some complex interplay of -dependences for all three species which, due to different masses, reach their minima at different .

Turning on the 0.5 T STAR magnetic field makes the simulated distributions in Row 6 of Fig. 3 close to the ones, expected in real minimum bias proton-proton and low-multiplicity (peripheral) nucleus-nucleus collisions at RHIC. The magnetic field moves MIP-peak positions up by 1% more at 1 GeV/c, and by somewhat less values at 1.5 GeV/c.
To evaluate the effects of invisible hits from underlying events, the HIJING-GEANT energy deposit spectra from neutral particles in the extreme case of central gold-gold events have been simulated for the towers at various (Fig. 6, left frame). Then, by combining these spectra and MIP signal distributions from Row 6 of Fig. 3, the histograms for Au-Au central events (Row 7 of Fig. 3) have been generated in the straightforward way, using formula:
| (5) |
where is the probability density for the total signal in a tower, and and are probability densities for the contributions from MIPs and from invisible neutral hits, respectively.

It should be underlined that backgrounds from neutrals and, for example, from hadronic interactions of MIPs themselves affect signal spectra differently. Hadronic interactions of MIPs add to the spectrum of purely ionization losses another, much wider distribution, not shifting in any direction the MIP peak itself. Contrarily, the nonzero energy deposits from neutrals are added on top of MIP signals, thus shifting the total signal to the right in virtually every single event. Actually, large energy deposits from neutrals (larger than MIP peak width of 2–3 MeV) are not so dangerous, because they just reduce the useful statistics, kicking the respective events completely out of MIP peaks. However, the contributions of small energy deposits from neutrals are not distinguishable in the fits (3)–(4) from electronics noise. As a result, they make the “effective pedestal” and MIP peak looking wider and, due to unipolar nature of this effect, they shift both, effective and by about the same amount to the right.
From the consideration above it follows that, if in fits (3)–(4), the characteristics of the effective pedestals were used for and rather than of the electronic pedestals measured, for example, with no beam in RHIC, then these fits should yield better estimates for -parameter even in the high multiplicity environment of central Au-Au events. These effective pedestals are measurable by accumulating the signal distributions in each tower from the same sample of events used for the respective MIP histograms, and with the same hit selection criteria except that no charged particles at all entering a tower. Then, the effective and could be extracted from the simple gaussian fits as shown in the right frame of Fig. 6. Using effective pedestals in the fits to histograms in Row 7 of Fig. 3 yielded -parameters for central Au-Au events in the remarkably good agreement with , 0.5 T (see Fig. 5)171717Actually, in most cases of measuring the energy of a single photon or electron, it would be correct to calculate the net signal relative to an effective pedestal rather than the electronic one. However in other cases of, for example, measuring the mean electromagnetic energy in the event, usage of electronic pedestals would be more appropriate..
The other interesting observation from Fig. 5 is that, within 1%, the ratios 1 GeV/c for the both, and Au-Au events are virtually independent of either or , and for the practical purpose could be fixed at 1.045–1.050181818For -fits; using suggests the lower values by 1%. (shown in Fig. 5 with the solid horizontal lines). Actually, the corrections bring MIP-peak positions in STAR to approximately 2.5 GeV/c for mono-momentum pions with no magnetic field. Of course, this combined correction coefficient is based on simulations only, and, for example, due to different compositions of MIP-hits in real events, it might require some additional adjustment. The bottom line, however, is that all corrections themselves are small, and even if just crudely evaluated by these simulations, the residual uncertainties should be well below the limit acceptable for the STAR BEMC calibration errors.
An important thing to underline is that, in the simulations, all charged particles originated from the vertex exactly at the STAR’s center. In the real experiment, the vertices are spread over a significant collision diamond, and as a result, MIP peaks could be shifted somewhat due to such spread. However, this effect is almost purely geometrical, and the respective correction can easily be made to the signal from each hit before filling the histogram.

The 1 GeV/c-ratios measured in the Beam-Test-’98 are shown in Fig. 7 [12]. Functionally, the experimental -dependence of is consistent with GSTAR191919GSTAR is the configured with STAR setup version of GEANT. simulations:
| (6) |
However, the normalization constants differ from each other by 12%. This difference might partially be due to some residual experimental uncertainties, but overestimating of by the standard GSTAR at 5–10% cannot be excluded either. After applying the combined correction coefficient above to the experimental data, the following formula could be written for the -dependence in STAR:
| (7) |
For the time being, until the better data from measurements at an external beam are available, formula (7) is suggested for use in the STAR BEMC calibrations at RHIC.
6 Statistics and calibration time
From the analysis of Sec. 5 it follows that, using MIPs from physics events at RHIC allows an absolute calibration of the BEMC at a percent level of systematic uncertainties. To achieve comparable statistical errors, a sufficient number of useful MIP-hits must be accumulated in each tower. MIP-peak widths in signal distributions are expected at 20%. Thus, to measure MIP-peak positions with a relative statistical error , the number of useful hits should be . Due to the deflection in the STAR magnetic field, the projected trajectories of only 50–60% of all charged particles at 1 GeV/c, which enter a tower, will cross all 21 scintillator tiles. Out of them, 60–70% will experience hadronic interactions and produce signals out of MIP peaks. As a results, the total number of high- entries per tower should be .
At design RHIC luminosity, the limiting factor for the useful event rate will be the data acquisition bandwidth rather than physics cross sections. To minimize MIP-hit accumulation time, the STAR Level-3 (L3) tracking [17] will be exploited a) to select among all incoming events those with high- tracks, pointing out to the BEMC towers; b) to reconstruct parameters of these tracks and, probably, even c) to fill histograms. The input L3 event rate could be as high as 100 Hz. However, the actual MIP-hit accumulation rate will also depend on the type of incoming events. Here we will provide the time estimates for three event types: a) and b) Au-Au minimum-bias events with at least one charged particle, detected in the CTB () within its acceptance of , , and c) low-multiplicity (peripheral) Au-Au events with . In these events, according to PYTHIA-HIJING, the average numbers of tracks with 1 GeV/c within the BEMC acceptance would be 0.23, 7.25 and 1.05, respectively. Putting these numbers together, we get the running times of Table 1, to achieve the indicated statistical accuracies on the MIP-peak positions.
| Statistical error | 20% | 10% | 5% | 2% | 1% |
|---|---|---|---|---|---|
| Minimum Bias | 23 min | 1.5 hr | 6 hr | 38 hr | 6.3 day |
| Peripheral Au-Au | 5 min | 20 min | 1.3 hr | 8.3 hr | 1.4 day |
| Minimum Bias Au-Au | 1 min | 3 min | 12 min | 1.2 hr | 5 hr |
It is worth noting that the above estimates are for the time required to get every BEMC tower calibrated. However, after the towers are equalized to a few percents, the monitoring of the mean gain variation for a patch, consisting of towers, will take by a factor of less time compared to what was necessary to calibrate every single tower with the same statistical uncertainty.
Conclusion
To summarize, the study in this paper has shown that, using MIP-hits, the equalization and transfer of the absolute scale from the test beam calibrations can be done to a percent level accuracy in a reasonable amount of time for the entire STAR BEMC. MIP-hits are also an effective tool for continuously monitoring the variations of the BEMC tower’s gains, virtually without interference to STAR’s main physics program. This method does not rely on simulations for anything other than geometric and some other small corrections, and also for estimations of the systematic errors: it directly transfers measured test beam responses to operations at RHIC.
Acknowledgments
It is our pleasure to thank E. P. Kistenev, J. M. Landgraf, J. S. Lange, M. J. LeVine, P. L. Nevski, E. K. Shabalina, P. P. Yepes and many members of the STAR EMC collaboration for the useful discussions. This work has been supported in part by the U.S. Department of Energy Grant DE–FG0292ER40713.
References
- [1] D. Decamp, et al. (ALEPH), Nucl. Inst. & Meth. A294 (1990) 121; Y. Seiya (CDF), FERMILAB-Conf-95/001-E CDF, 1995; S. Lusin (CDF), FERMILAB-Conf-98/003-E CDF, 1998.
- [2] B. G. Bylsma et al. (ZEUS), Nucl. Instr. & Meth. A305 (1991) 354; I. Ambats, et al. (ZEUS), Nucl. Instr. & Meth. A320 (1992) 161; T. A. Armstrong, et al. (E864), Nucl. Instr. & Meth. A406 (1998) 227.
- [3] STAR EMC Collaboration, STAR BEMC Technical Design Report, 1998 (unpublished).
- [4] J. W. Harris, et al. (STAR Collaboration at RHIC), Nucl. Phys. A566 (1994) c277; STAR Collaboration, Conceptual Design Report for the Solenoidal Tracker At RHIC, BNL PUB-5347, June 15, 1992 (unpublished).
- [5] W. J. Llope (for the STAR-EMC Collaboration), Proc. VI International Conference on Calorimetry in High Energy Physics, 1996, Frascati Physics Series, v. VI, p. 187.
- [6] T. J. LeCompte, STAR Note 306, 1997; S. Chattopadhyay, et al., STAR Note 414, 1999 (both at http://www.star.bnl.gov).
- [7] D. Underwood, STAR Note 180, 1994; B. Hubner, G. D. Westfall, A. M. Vander Molen, STAR Notes 275 and 276, 1996 (all at http://www.star.bnl.gov).
- [8] GEANT – Detector Description and Simulation Tool, CERN Program Library, http://wwwinfo.cern.ch/asd/geant/index.html.
- [9] C. Albajar, et al. (UA1), Phys. Lett. B209 (1988) 385; J. A. Appel, et al. (UA2), Phys. Lett. B176 (1986) 239.
- [10] E. Anassontzis, et al. (ISR), Z. Phys. C13 (1982) 277.
- [11] A. A. Derevschikov, O. D. Tsai, STAR Note 216, 1995, http://www.star.bnl.gov.
- [12] V. L. Rykov and A. N. Vasiliev, STAR Note 433, 2001, http://www.star.bnl.gov.
- [13] P. V. Vavilov, Soviet J. Exp. Theor. Phys. 5 (1957) 749.
- [14] A. Rotondi, P. Montagna, K. S. Kölbig, CERN, Program Library – Short Writeups, http://wwwinfo.cern.ch/asdoc/shortwrupsdir/g115/top.html.
- [15] Physics Analysis Workstation (PAW) User’s guide, CERN Program Library – Long Writeup Q121, http://wwwinfo.cern.ch/asdoc/.
- [16] S. Torbjörn, et al, PYTHIA (and JETSET) Physics, Manual and updates, http://www.thep.lu.se/torbjorn/Pythia.html; M. Gyulassy and X.-N. Wang, HIJING Monte Carlo Model, http://www-nsdth.lbl.gov/xnwang/hijing.html.
- [17] J. S. Lange et al., Nucl. Instr. & Meth. A453 (2000) 397.