Evidence for the Electroweak Penguin Decay
Abstract
We report a search for the flavor-changing neutral current decay using a 29.5 fb-1 data sample accumulated at the resonance with Belle detector at the KEKB storage ring. We observe evidence for and report the preliminary branching fraction of
.
We also set the following 90% confidence level upper limits on the branching fractions for exclusive and inclusive decays,
,
,
,
,
.
pacs:
K. Abe9, K. Abe37, R. Abe27, I. Adachi9, Byoung Sup Ahn15, H. Aihara39, M. Akatsu20, K. Asai21, M. Asai10, Y. Asano44, T. Aso43, V. Aulchenko2, T. Aushev13, A. M. Bakich35, E. Banas25, S. Behari9, P. K. Behera45, D. Beiline2, A. Bondar2, A. Bozek25, T. E. Browder8, B. C. K. Casey8, P. Chang24, Y. Chao24, K.-F. Chen24, B. G. Cheon34, R. Chistov13, S.-K. Choi7, Y. Choi34, L. Y. Dong12, J. Dragic18, A. Drutskoy13, S. Eidelman2, V. Eiges13, Y. Enari20, C. W. Everton18, F. Fang8, H. Fujii9, C. Fukunaga41, M. Fukushima11, A. Garmash2,9, A. Gordon18, K. Gotow46, H. Guler8, R. Guo22, J. Haba9, H. Hamasaki9, K. Hanagaki31, F. Handa38, K. Hara29, T. Hara29, N. C. Hastings18, H. Hayashii21, M. Hazumi29, E. M. Heenan18, Y. Higasino20, I. Higuchi38, T. Higuchi39, T. Hirai40, H. Hirano42, T. Hojo29, T. Hokuue20, Y. Hoshi37, K. Hoshina42, S. R. Hou24, W.-S. Hou24, S.-C. Hsu24, H.-C. Huang24, Y. Igarashi9, T. Iijima9, H. Ikeda9, K. Ikeda21, K. Inami20, A. Ishikawa20, H. Ishino40, R. Itoh9, G. Iwai27, H. Iwasaki9, Y. Iwasaki9, D. J. Jackson29, P. Jalocha25, H. K. Jang33, M. Jones8, R. Kagan13, H. Kakuno40, J. Kaneko40, J. H. Kang48, J. S. Kang15, P. Kapusta25, N. Katayama9, H. Kawai3, H. Kawai39, Y. Kawakami20, N. Kawamura1, T. Kawasaki27, H. Kichimi9, D. W. Kim34, Heejong Kim48, H. J. Kim48, Hyunwoo Kim15, S. K. Kim33, T. H. Kim48, K. Kinoshita5, S. Kobayashi32, S. Koishi40, H. Konishi42, K. Korotushenko31, P. Krokovny2, R. Kulasiri5, S. Kumar30, T. Kuniya32, E. Kurihara3, A. Kuzmin2, Y.-J. Kwon48, J. S. Lange6, S. H. Lee33, C. Leonidopoulos31, Y.-S. Lin24, D. Liventsev13, R.-S. Lu24, D. Marlow31, T. Matsubara39, S. Matsui20, S. Matsumoto4, T. Matsumoto20, Y. Mikami38, K. Misono20, K. Miyabayashi21, H. Miyake29, H. Miyata27, L. C. Moffitt18, G. R. Moloney18, G. F. Moorhead18, N. Morgan46, S. Mori44, T. Mori4, A. Murakami32, T. Nagamine38, Y. Nagasaka10, Y. Nagashima29, T. Nakadaira39, T. Nakamura40, E. Nakano28, M. Nakao9, H. Nakazawa4, J. W. Nam34, Z. Natkaniec25, K. Neichi37, S. Nishida16, O. Nitoh42, S. Noguchi21, T. Nozaki9, S. Ogawa36, T. Ohshima20, Y. Ohshima40, T. Okabe20, T. Okazaki21, S. Okuno14, S. L. Olsen8, H. Ozaki9, P. Pakhlov13, H. Palka25, C. S. Park33, C. W. Park15, H. Park17, L. S. Peak35, M. Peters8, L. E. Piilonen46, E. Prebys31, J. L. Rodriguez8, N. Root2, M. Rozanska25, K. Rybicki25, J. Ryuko29, H. Sagawa9, Y. Sakai9, H. Sakamoto16, M. Satapathy45, A. Satpathy9,5, S. Schrenk5, S. Semenov13, K. Senyo20, Y. Settai4, M. E. Sevior18, H. Shibuya36, B. Shwartz2, A. Sidorov2, S. Stanič44, A. Sugi20, A. Sugiyama20, K. Sumisawa9, T. Sumiyoshi9, J.-I. Suzuki9, K. Suzuki3, S. Suzuki47, S. Y. Suzuki9, S. K. Swain8, H. Tajima39, T. Takahashi28, F. Takasaki9, M. Takita29, K. Tamai9, N. Tamura27, J. Tanaka39, M. Tanaka9, Y. Tanaka19, G. N. Taylor18, Y. Teramoto28, M. Tomoto9, T. Tomura39, S. N. Tovey18, K. Trabelsi8, T. Tsuboyama9, T. Tsukamoto9, S. Uehara9, K. Ueno24, Y. Unno3, S. Uno9, Y. Ushiroda9, S. E. Vahsen31, K. E. Varvell35, C. C. Wang24, C. H. Wang23, J. G. Wang46, M.-Z. Wang24, Y. Watanabe40, E. Won33, B. D. Yabsley9, Y. Yamada9, M. Yamaga38, A. Yamaguchi38, H. Yamamoto8, T. Yamanaka29, Y. Yamashita26, M. Yamauchi9, S. Yanaka40, M. Yokoyama39, K. Yoshida20, Y. Yusa38, H. Yuta1, C. C. Zhang12, J. Zhang44, H. W. Zhao9, Y. Zheng8, V. Zhilich2, and D. Žontar44
1Aomori University, Aomori
2Budker Institute of Nuclear Physics, Novosibirsk
3Chiba University, Chiba
4Chuo University, Tokyo
5University of Cincinnati, Cincinnati OH
6University of Frankfurt, Frankfurt
7Gyeongsang National University, Chinju
8University of Hawaii, Honolulu HI
9High Energy Accelerator Research Organization (KEK), Tsukuba
10Hiroshima Institute of Technology, Hiroshima
11Institute for Cosmic Ray Research, University of Tokyo, Tokyo
12Institute of High Energy Physics, Chinese Academy of Sciences, Beijing
13Institute for Theoretical and Experimental Physics, Moscow
14Kanagawa University, Yokohama
15Korea University, Seoul
16Kyoto University, Kyoto
17Kyungpook National University, Taegu
18University of Melbourne, Victoria
19Nagasaki Institute of Applied Science, Nagasaki
20Nagoya University, Nagoya
21Nara Women’s University, Nara
22National Kaohsiung Normal University, Kaohsiung
23National Lien-Ho Institute of Technology, Miao Li
24National Taiwan University, Taipei
25H. Niewodniczanski Institute of Nuclear Physics, Krakow
26Nihon Dental College, Niigata
27Niigata University, Niigata
28Osaka City University, Osaka
29Osaka University, Osaka
30Panjab University, Chandigarh
31Princeton University, Princeton NJ
32Saga University, Saga
33Seoul National University, Seoul
34Sungkyunkwan University, Suwon
35University of Sydney, Sydney NSW
36Toho University, Funabashi
37Tohoku Gakuin University, Tagajo
38Tohoku University, Sendai
39University of Tokyo, Tokyo
40Tokyo Institute of Technology, Tokyo
41Tokyo Metropolitan University, Tokyo
42Tokyo University of Agriculture and Technology, Tokyo
43Toyama National College of Maritime Technology, Toyama
44University of Tsukuba, Tsukuba
45Utkal University, Bhubaneswer
46Virginia Polytechnic Institute and State University, Blacksburg VA
47Yokkaichi University, Yokkaichi
48Yonsei University, Seoul
I Introduction
Flavor-changing neutral current (FCNC) processes are forbidden at the tree level in the Standard Model (SM), but are induced by loop or box diagrams. If non-SM particles participate in the loop or box diagrams, their amplitudes may interfere with the SM amplitudes. This makes FCNC processes an ideal place to search for new physics.
CLEO first observed and measured the radiative penguin decay [1], which constrains the magnitude of the effective Wilson coefficient of the electromagnetic penguin operator, . This provides the most stringent indirect limit on the charged Higgs mass range[2]. However, it cannot constrain the phase of , which is essential to obtain definitive evidence of new physics since is positive in the SM while it can be negative in non-SM physics[3]. In particular, is constrained to be negative in the minimal SUGRA model[4]. The electroweak penguin decay is promising from this point of view since the coefficients and can be completely determined by measuring the dilepton invariant mass distributions, forward-backward charge asymmetry of the dilepton together with the decay rate[5].
The branching fractions predicted within the framework of the Standard Model are listed in Tables I and II [REFERENCES–REFERENCES]. Although several groups [11][12][13] have searched for exclusive and decays*** is referred as hereafter. and CLEO[14] has searched for inclusive decays, no evidence has been observed.
| Predicted branching fraction | |||
|---|---|---|---|
| Mode | Ali et al.[6] | Greub et al.[7] | Melikhov et al.[8] |
| Predicted branching fraction | ||
| Mode | Ali et al.[9] | Krüger et al.[10] |
| N/A | ||
| 6.7 | ||
In this paper, we present the preliminary results of a search for decays to an oppositely charged lepton pair and a strange hadron system using data produced in annihilation at the KEKB asymmetric collider [15], and collected with the Belle detector. The data sample corresponds to 29.5 fb-1 taken at the resonance and contains approximately 31.3 million pairs.
Belle is a general-purpose detector based on a 1.5 T superconducting solenoid magnet that surrounds the KEKB beam crossing point. Charged particle tracking covering approximately 90% of the total cm solid angle is provided by a Silicon Vertex Detector (SVD), consisting of three nearly cylindrical layers of double-sided silicon strip detectors [16], and a 50-layer Central Drift Chamber (CDC)[17]. Impact parameter resolutions are measured as functions of momentum (GeV/) to be m and m, where is the polar angle with respect to the beam direction. The transverse momentum resolution for charged tracks is , where is in GeV/. Particle identification is accomplished by a combination of a silica Aerogel Cherenkov Counters (ACC)[18], a Time of Flight counter system (TOF)[19] and measurements in the CDC. The combined response of the three systems provide identification with an efficiency of about 85% and a charged pion fake rate of about 10% for all momenta up to 3.5 GeV/. A CsI(Tl) Electromagnetic Calorimeter (ECL) located inside the solenoid coil is used for detection and electron identification[20]. The photon energy resolution is , where is in GeV. The detector (KLM)[21] is located outside of the coil. An Extreme Forward Calorimeter (EFC)[22] is situated near the beam pipe. A detailed description of the Belle detector can be found elsewhere[23].
II Signal Property
To estimate the signal detection efficiency, we generate exclusive and inclusive simulated signal events. The exclusive and Monte Carlo (MC) sample is generated according to a model described by Greub, Ioannissian and Wyler[7]. The decay has a pole at since a nearly real photon couples to dileptons, while does not have a pole at due to helicity suppression.
The inclusive MC sample is generated according to an -distribution with the lepton mass term modeled by Krüger and Sehgal[10], and a -distribution modeled by Ali et al.[24]. The exclusive MC sample described above is used to account for resonant states in the region GeV/. The fractions for exclusive decays are determined from the inclusive branching fractions predicted by Ali, Hiller, Handoko and Morozumi[9] and the exclusive branching fractions predicted by Ali, Ball, Handoko and Hiller[6] shown in Tables I and II. The interference between and long distance processes is not considered for either MC sample.
III Analysis
A Exclusive Analysis
In decays, the K(*) hadronic system and the two oppositely charged leptons form a quasi-three body state. In the mode, the hadronic system is one kaon, while in the mode, the hadronic system contains one kaon and a pion.
The distance of the closest approach to the interaction point of the charged track is required to be less than 0.5 cm in the plane and less than 5.0 cm in the direction. This requirement reduces the combinatorial background from photon conversion, beam-gas and beam-wall events. Electrons are identified from the ratio of shower energy in the ECL to the momentum measured by the CDC, the shower shape of the cluster in the ECL, the energy deposit in the CDC and the light yield in ACC. Tracks are identified as muons by their penetration length in the KLM and the matching between the tracks found by the CDC and hits in the KLM. To reduce the misidentification of hadrons as leptons, we require that the momentum be greater than GeV/ and GeV/ for electron and muon candidates, respectively.
A charged is identified by a likelihood ratio based on the in the CDC, time-of-flight information and ACC response.
Photons are selected from isolated showers in the ECL whose energy is greater than MeV and whose shape is consistent with electromagnetic shower. Neutral pion candidates are reconstructed from pairs of these photons and required to have the invariant mass within MeV/ of the nominal mass. candidates are reconstructed from oppositely charged tracks whose vertex position is displaced from the interaction point. We require the invariant mass lies within MeV/ of the nominal mass.
candidates are formed by combination of a charged or neutral kaon and a pion (, , or ).†††Charge conjugate modes are implied throughout this paper. The invariant mass is required to lie within MeV/ of the nominal mass. This value corresponds to 1.5 times the natural width. For modes involving ’s, there are large combinatorial backgrounds due to the abundance of low momentum ’s. To reduce such backgrounds, we require that the helicity angle , defined as the angle between momentum direction and kaon momentum direction in the rest frame, be less than 0.8.
candidates are reconstructed from the hadron system and an oppositely-charged lepton pair. The backgrounds from the long distance processes are rejected using the dilepton invariant mass. The veto windows are defined as,
To suppress background from photon conversions or Dalitz decays, we require the dielectron mass to satisfy GeV/.
The backgrounds from continuum events are suppressed using event shape variables. Continuum events have a jet-like shape while events have a spherical shape in the center-of-mass frame. A Fisher discriminant [26] is calculated from the energy flow in 9 cones along the candidate sphericity axis and the second Fox-Wolfram moment [25]. In addition to the Fisher discriminant, the meson flight direction and the angle between meson sphericity axis and the axis, , are used to suppress the continuum events. For the muon mode, is not used since its distribution is nearly the same for signal and continuum due to detector acceptance. We combine , and into one likelihood ratio defined as,
where and are the products of the likelihoods for signal and continuum background, respectively.
Most lepton candidates originate from semileptonic decays in events. The missing energy of the event, , is used to suppress the background since we expect large missing energy due to the undetected neutrino. The meson flight angle is also used to suppress combinatorial background in events. We combine and into the likelihood ratio .
We use the beam constrained mass and the energy difference in the center-of-mass frame to select candidates where
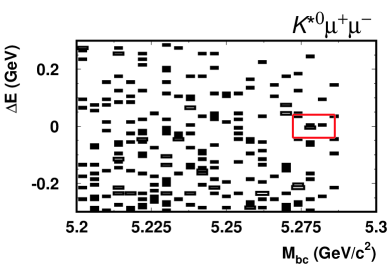
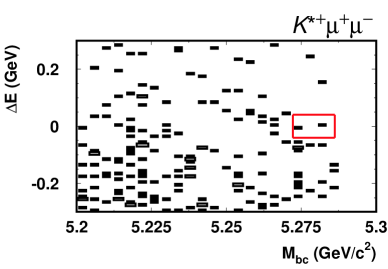
The selection criteria are tuned to maximize the expected significance where is the signal yield and is the expected background in the signal box. and are determined from GEANT based MC samples with an effective luminosity of 40 fb-1, assuming the branching fractions predicted by Ali et al.[6]. The signal box is defined as GeV/ () for both the electron mode and the muon mode and GeV for the electron mode and GeV for the muon mode. We require and for all modes except for and final states, where the selection criterion is tightened to be . The detection efficiencies estimated using MC samples are summarized in Table IV. Figure 1 shows the vs. scatterplot for each mode.
(a) (b)
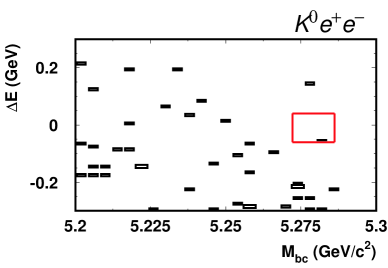
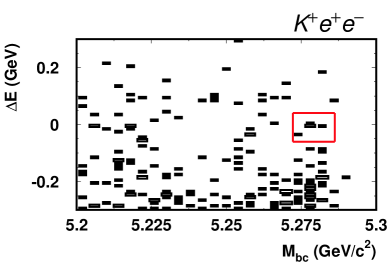
(c) (d)
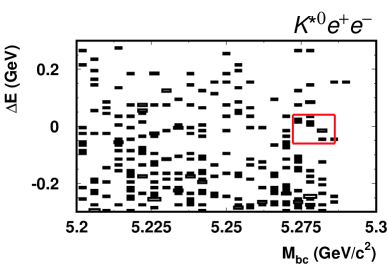
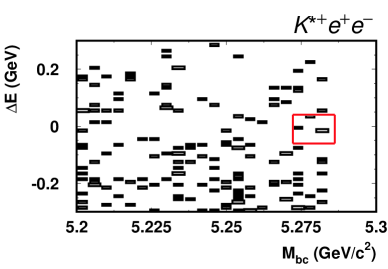
(e) (f)
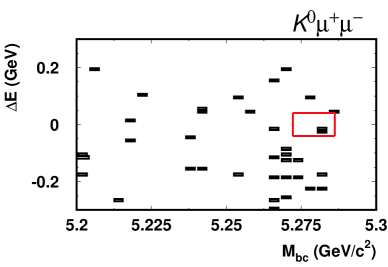
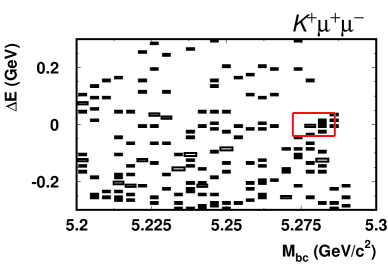
(g) (h)
To determine the signal yields, we must take into account backgrounds from both misidentified leptons and real leptons. The distribution is fitted with the sum of a Gaussian function to represent the signal and two ARGUS functions[27] plus a Gaussian function to represent the background. The mean and the width of the Gaussian function are calibrated using and events. The shape of the background function is determined using data to model the background from misidentified leptons and a 200 fb-1 MC dilepton sample for the real lepton background. One ARGUS function and one Gaussian function in the background function is introduced to account for the misidentified lepton background. The other ARGUS function represents the real lepton background and its normalization is a free parameter in the fit.
Figures 2 and 3 show the distributions after the selection on . The fit results for the and samples are also shown. The fit results are summarized in Table IV.
(a) (b)


(c) (d)


(a) (b)


(c) (d)

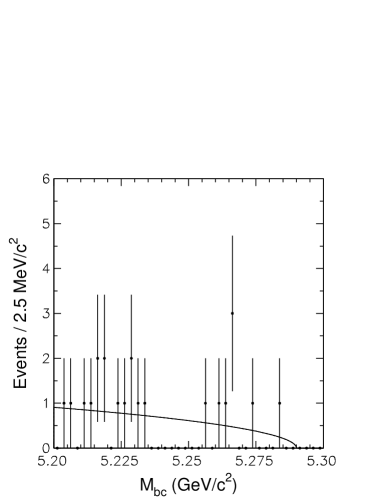
We observe an excess in with a significance of and in with a significance of . Statistical significance is calculated as where is the maximum likelihood in the fit and is the likelihood when the signal yield is constrained to be zero. When the distribution of and modes are combined, the fit yields signal events as shown in Figure 4 (a). The statistical significance now increases to 4.8. We observe a clear peak in the signal region. Figure 4 (b) shows the distribution of the candidates. The fit yield is consistent with the yield from the fit.
(a) (b)


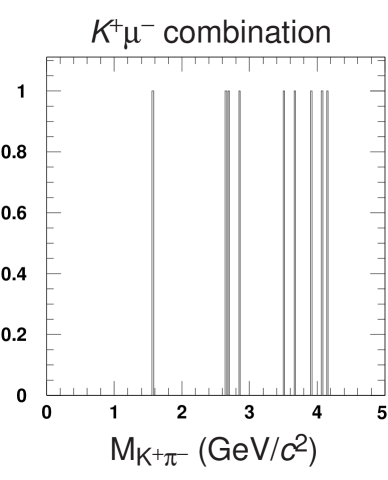
The kinematical properties of the events are further examined to check for potential backgrounds. decays ( refers hadrons) can contribute to the peak in the distribution when both of hadrons are misidentified as muons. The decay chain is expected to be the largest source of this background. We expect 0.2 events from this source using a 300 fb-1 MC sample. The background is also evaluated using data. All combinations are weighted by the measured misidentification probability. This study yields 0.3 events in the peak region, which is consistent with the MC result. Another possible background source is double-misidentification of the decay chain where the kaon and the muon are misidentified as a muon and a kaon, respectively. Figs. 5 (a) and (b) show mass distribution of the combinations with the and the hypotheses, respectively. We observe no events in the mass or mass region, which confirms the MC expectation.
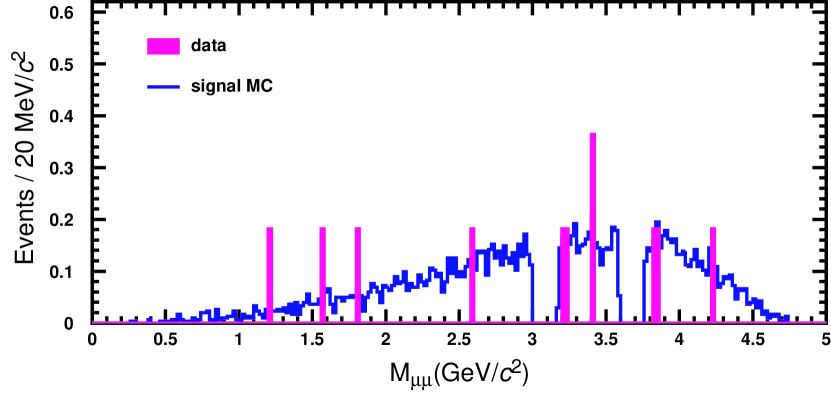
The decay chain can be another background source when muon pairs from decays avoid the veto. We expect 0.1 events from this background using a MC sample corresponding to 220 fb-1. Fig. 5 (c) shows the dimuon mass distribution for the candidates. The hatched histogram shows the data distribution while the solid histogram shows the MC signal distribution. The data distribution is consistent with the MC expectation. We observe no events close to the or veto region, which confirms the MC expectation for the background contribution.
(a) (b)
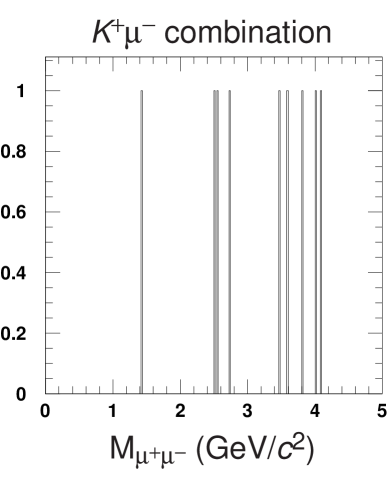
(c)
To summarize, we observe no indication of a background that could peak in the distribution in the sample.
B Inclusive Analysis
The inclusive decay is reconstructed by combining the system with two oppositely charged leptons. The system is formed by combining a charged kaon or with 0–4 pions in which at most one pion can be neutral.
We reject backgrounds from decays by vetoing GeV/, GeV/, GeV/ and GeV/. These criteria are rather tight since these backgrounds can satisfy the requirement described below by adding additional pions and populate the sideband. We also reject electrons from photon conversions or Dalitz decays by requiring GeV/.
Continuum backgrounds are reduced by requiring to be less than 0.35. The remaining continuum backgrounds are further suppressed by the requirement where is the angle between the thrust axis of the candidate and the thrust axis of the rest of the event. Continuum events peak at while the signal events are uniformly distributed. After these requirements, the continuum background becomes negligibly small; the requirement of two leptons eliminates almost all events. Most of the remaining background is from events with two leptons from semileptonic decays of either or mesons.
We calculate a likelihood ratio, , using the missing energy in the event and the invariant mass of the system. In the variable , where is the angle between the charged or neutral kaon (not ) and the lepton, the background peaks around zero while the signal tends to be negative. A cut on this variable does not bias the distribution. This variable is combined with the flight direction to form another likelihood ratio, . We require for the sample and for the sample, and for both samples, which minimize the expected upper limits.
When we have two or more candidates in one event, we choose the candidate with minimum . Finally, is required to be less than 30 MeV.
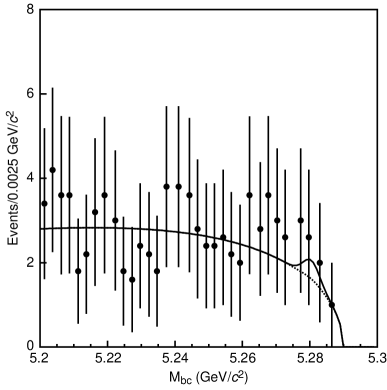
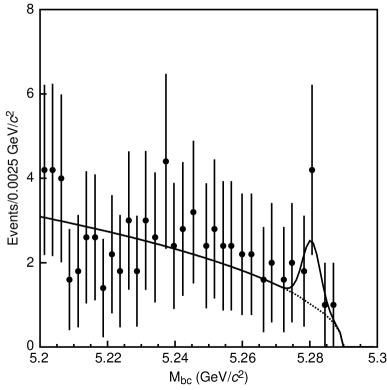
We obtain the signal yield by a fit to the distribution with the sum of a Gaussian function for the signal and an ARGUS function for the background. The background shape is determined in this fit while the signal function shape is calibrated using the sample in data. The fits yield for the sample and for the sample. Figure 6 shows the distributions with the fit results. The statistical significance of the signal is . Of these 11.4 signal events, 5.9 events are reconstructed as either or .
(a) (b)
IV Systematic Uncertainties
We consider systematic effects from the fit and the efficiency determination. Uncertainty in the background function is the dominant source of the systematic error.
A Systematic error due to fit
The systematic error associated with the signal function is evaluated by varying the mean and the width of the Gaussian function determined from events by .
In the exclusive analysis, the systematic error due to the background function is obtained by varying the ARUGS shape parameter, which was determined from a large MC sample, by .
In the inclusive analysis the requirement is varied to estimate the systematic error associated with modeling of the background shape. We also use the background shape from a MC sample corresponding to 80 fb-1. The differences from the above results are considered to be systematic errors.
Total systematic errors are calculated by adding all systematic errors in quadrature. The systematic errors associated with the fit function are shown in the third column of Table IV.
B Systematic error due to efficiency
Systematic uncertainties for the tracking, charged kaon ID, charged pion ID, electron ID, muon ID, detection and detection efficiencies are 1.5 to 1.7%, 2.1 to 2.5%, 0.8%, 1.8%, 2.2%, 8.7% and 6.8% per particle, respectively. For each final state in the inclusive analysis, these systematic uncertainties are included and weighted by the fraction of the final state times efficiency to calculate the average systematic error over all final states. Table III summarizes the systematic errors associated with the efficiency determination.
(a) Exclusive Analysis.
| Fractional error (%) | ||||||
|---|---|---|---|---|---|---|
| Source | electron mode / muon mode | |||||
| Tracking | 3.4 | 5.1 | 6.4 | 3.4 | 4.9 | 4.9 |
| Kaon ID | - | 2.5 | 2.1 | - | - | 2.1 |
| Pion ID | - | - | 0.8 | - | 0.8 | - |
| Lepton ID | 3.6/4.4 | 3.6/4.4 | 3.6/4.4 | 3.6/4.4 | 3.6/4.4 | 3.6/4.4 |
| detection | 8.7 | - | - | 8.7 | 8.7 | - |
| detection | - | - | - | 6.8 | - | 6.8 |
| BG suppression | 2.3 | 2.3 | 2.3 | 2.3 | 2.3 | 2.3 |
| MC statistics | 1.9/1.6 | 1.5/1.3 | 2.2/1.6 | 4.0/3.7 | 2.5/2.3 | 3.5/2.9 |
| total | 10.4/10.7 | 7.3/7.7 | 8.3/8.6 | 13.0/13.1 | 11.2/11.4 | 10.3/10.4 |
(b) Inclusive Analysis.
| Source | Fractional error (%) | |
|---|---|---|
| Tracking | ||
| Kaon ID | ||
| Lepton ID | ||
| detection | ||
| MC statistics | ||
| Model | ||
| Total | ||
The uncertainty in the reconstruction efficiency due to signal modeling in the inclusive analysis is estimated by varying the branching fractions by the errors shown in Tables I and II. Model dependence of the efficiency is also considered by using branching fractions from different models. Since exclusive modes have much higher efficiencies, uncertainties in their branching fractions are the dominant source of the systematic error.
V Results
For the modes with more than significance, we quote branching fractions. We find,
,
,
where the first and second errors are statistical and systematic, respectively. We combine neutral and charged -meson results for modes and obtain the combined branching fraction,
.
In order to calculate upper limits for signal yields in the presence of background, we employ the unified approach of Feldman and Cousins. The upper limits for the branching fractions are calculated using the upper limit of the signal yield and lower limit of the efficiency to obtain conservative upper limits. We obtain upper limits at 90% confidence level, which are given in Table IV.
(a) Exclusive Analysis.
| mode | observed | signal yield | background | efficiency | U.L. | signif. | |
|---|---|---|---|---|---|---|---|
| events | [%] | ||||||
| 1 | 0.62 | - | 2.78 | - | |||
| 5 | 2.75 | - | 1.32 | - | |||
| 6 | 3.37 | - | 1.19 | - | |||
| 9 | 5.78 | - | 5.63 | - | |||
| 4 | 1.64 | - | 8.57 | - | |||
| 13 | 7.48 | 5.07 | 2.10 | ||||
| 2 | 0.12 | 3.21 | 2.59 | ||||
| 9 | 1.43 | - | 4.09 | ||||
| 11 | 1.47 | - | 4.76 | ||||
| 6 | 2.97 | - | 3.90 | - | |||
| 2 | 2.00 | - | 6.10 | - | |||
| 8 | 5.16 | - | 3.01 | - |
(b) Inclusive Analysis.
| mode | observed | signal yield | background | efficiency | U.L. | signif. | |
|---|---|---|---|---|---|---|---|
| events | [%] | ||||||
| 33 | 30 | - | 10.2 | - | |||
| 26 | 14.6 | 19.9 | 2.7 |
VI Conclusions
We have observed evidence for the electroweak penguin decay . The preliminary branching fraction for this decay mode is,
.
This value is consistent with theoretical predictions [6] [7] [8]. The errors are dominated by statistics, which can be improved in the coming runs. We report 90% confidence level upper limits of branching fractions for the following exclusive and inclusive decays.
,
,
,
,
.
These values are close to the SM predictions. The results reported here are preliminary.
VII Acknowledgements
We wish to thank the KEKB accelerator group for the excellent operation of the KEKB accelerator. We acknowledge support from the Ministry of Education, Culture, Sports, Science, and Technology of Japan and the Japan Society for the Promotion of Science; the Australian Research Council and the Australian Department of Industry, Science and Resources; the Department of Science and Technology of India; the BK21 program of the Ministry of Education of Korea and the CHEP SRC program of the Korea Science and Engineering Foundation; the Polish State Committee for Scientific Research under contract No.2P03B 17017; the Ministry of Science and Technology of Russian Federation; the National Science Council and the Ministry of Education of Taiwan; the Japan-Taiwan Cooperative Program of the Interchange Association; and the U.S. Department of Energy. A.I. would like to acknowledge support from Research Fellowships of the Japan Society for the Promotion of Science for Young Scientists.
REFERENCES
- [1] M. S. Alam et al. (CLEO Collaboration), Phys. Rev. Lett. 74, 2885 (1995).
- [2] F. Borzumati and C. Greub, Phys. Rev. D 58, 074004 (1998); F. Borzumati and C. Greub, Phys. Rev. D 59, 057501 (1999); M. Ciuchini, G. Degrassi, P.Gambino and G. F. Giudice, Nucl. Phys. B 527, 21 (1998).
- [3] T. Besmer, C. Greub, T. Hurth. CERN-TH-2001-136, BUTP-01-12, ZU-TH-15-01, hep-ph/0105292; M. Ciuchini, G. Degrassi, P.Gambino and G. F. Giudice, Nucl. Phys. B 534, 3 (1998); C. Bobeth, M. Misiak and J. Urban, Nucl. Phys. B 567, 153 (2000); F. Borzumati, C. Greub, T. Hurth and D. Wyler, Phys. Rev. D 62, 075005 (2000).
- [4] T. Gotou, Y. Okada and Y. Shimizu, KEK-TH-611, hep-ph/9908499.
- [5] A. Ali, G. F. Giudice and T. Mannel, Z. Phys. C 67, 417 (1995); A. Ali, T. Mannel and T. Morozumi, Phys. Lett. B 273, 505 (1991); B. Grinstein, M. J. Savage and M. B. Wise, Nucl. Phys. B 319, 271 (1991); W. Jaus and D. Wyler, Phys. Rev. D 41, 3405 (1990).
- [6] A. Ali, P. Ball, L. T. Handoko and G. Hiller, Phys. Rev. D61, 074024 (2000).
- [7] C. Greub, A. Ioannissian and D. Wyler, Phys. Lett. B346, 149-158 (1995).
- [8] D. Melikhov and N. Nikitin, Phys. Lett. B410, 290-298 (1997).
- [9] A. Ali, G. Hiller, L. T. Handoko and T. Morozumi, Phys. Rev. D55, 4105 (1997).
- [10] F. Krüger and L.M. Sehgal, Phys. Lett. B380, 199-204 (1996).
- [11] B. Aubert et al. (BaBar Collaboration), BABAR-CONF-00/16 (2000).
- [12] T. Affolder et al. (CDF Collaboration), Phys. Rev. Lett. 83 3378-3383 (1999).
- [13] R. Godang et al. (CLEO Collaboration), CLEO-CONF 98-22 (1998).
- [14] S. Glenn et al. (CLEO Collaboration), Phys. Rev. Lett. 80 2289 (1998).
- [15] KEKB B Factory Design Report, KEK Report 95-7 (1995), unpublished; Y. Funakoshi et al., Proc. 2000 European Particle Accelerator Conference, Vienna (2000).
- [16] G. Alimonti et al., Nucl. Inst. Meth. A453 71 (2000).
- [17] H. Hirano et al., Nucl. Inst. Meth. A455 294 (2000); M. Akatsu et al., Nucl. Inst. Meth. A454 322 (2000).
- [18] M.H.R. Khanet al., Nucl. Inst. Meth. A413 201 (1998); T. Sumiyoshi et al., Nucl. Inst. Meth. A433 385 (1999); T. Iijima et al., Proceedings of the 7th International Conference on Instrumentation for Colliding Beam Physics, Hamamatsu, Japan, Nov. 15–19, 1999.
- [19] H. Kichimi et al., Nucl. Inst. Meth. A453 315 (2000).
- [20] H. Ikeda et al., Nucl. Inst. Meth. A441 401 (2000).
- [21] A. Abashian et al., Nucl. Inst. Meth. A449 112 (2000).
- [22] M. Z. Wang et al., KEK preprint 99-141, submitted to Nucl. Inst. Meth. KEK Progress Report 2000-4, submitted to Nucl. Instr. and Meth.
- [23] K. Abe et al. (Belle Collaboration), KEK Progress Report 2000-4 (2000), to be published in Nucl. Inst. and Meth. A.
- [24] A. Ali et al., Phys. Rev. D55, 4105 (1997).
- [25] G. Fox and S. Wolfram, Phys. Rev. Lett 41, 1581 (1978).
- [26] R. A. Fisher, Ann, Eugen. 7, 179 (1936); M. C. Kendall and A. Stuart, The Advanced Theory of Statistics, Second Edition (Hafner, Ner York, 1968) Vol III.
- [27] H. Albrecht et al. (ARGUS Collaboration), Phys. Lett. B 241, 278 (1990).
- [28] G. J. Feldman and R. D. Cousins, Phys. Rev. D57, 3873 (1998).